


Unreliable data sources
Arduino Octave integration, although convenient and easy to use, seems to have some weak points:
- control is rather slow - for example, when switching two relays one by one, operator can differentiate by sound when second relay engages, which raises a question about precision of timestamping of reads (if timestamp gathered after the read operation is precise enough) ,
- reference voltage for ADC cannot be selected, leaving user is at the mercy of power supply voltage changes,
Arduino integration performance
To measure Arduino operation delay some tests were performed.
First, mean time of obtaining timestamp was measured:
tm_start = toc();while i < 9 i = i + 1; tm_stop = toc();endwhile
measured at below of 40us/call.
Next, Arduino communication performance was measured:
sw_start = toc();while i < 10 i = i + 1; writeDigitalPin(ar, charge_pin, 0);endwhile sw_stop = toc();
rd_start = toc();while i < 10 i = i + 1; in = readVoltage(ar, "A2");endwhile rd_stop = toc();
both measured at about 30ms/call - not very fast...
Suspicious data
During the development I have found myself in the situation where I started to wonder if measurement inaccuracies are disrupting my calculations. I was measuring capacitance from time constant of RC circuit (time to obtain certain voltage) but results were strange. When comparing capacitance calculated during charge cycle (time to obtain 0.632 of supply voltage) and discharge cycle (time for voltage to drop to 0.368 of initial voltage) I was consistently getting about 10% difference. For example, when measuring electrolytic capacitor marked as 1500uF, measured as 1600uF using multimeter, i was getting results like this:
Capacitance [charge, using precise charge time] = 0.001520 [F]
Capacitance [discharge, using precise discharge time] = 0.001681 [F]
charge/discharge difference [precise time] = -10.62 [%]
Curve fitting using Octave
To improve data quality, one can use some additional knowledge about measured process - in this situation capacitor charge curve is known to be:
U = Vcc * (1 - exp(-t/RC))
So - using specialized math tool like GNU Octave - we can try to find function parameters that will define curve as similar as our input data vector as possible.
Continuing from our previous blog post, we will now add two estimated curves to our plot:
First, define our model functions (one for charge curve, another for discharge) with their initial parameter values:
fc = @(p, x) p(1)*(1-exp(-x / p(2)));fd = @(p, x) p(1)*exp(-x / p(2));init_par1 = [power_voltage; 1]; init_par2 = [power_voltage; 1];
then, employ curve fitting and plot resulting curves:
[pc, mod_valc, cvgc, outpc] = nonlin_curvefit(fc, init_par1, x1_axis, data_chr);[pd, mod_vald, cvgd, outpd] = nonlin_curvefit(fd, init_par2, x2_axis, data_dis);
plot(x1_axis, data_chr, x2_axis, data_dis, x1_axis, mod_valc, x2_axis, mod_vald);
line([0 x1_axis(i)], [power_voltage*0.632 power_voltage*0.632], "color", "r");line([0 x2_axis(i)], [data_dis(1)*0.368 data_dis(1)*0.368], "color", "g");
legend("charging curve", "discharging curve", "estimated charging curve", "estimated discharging curve", "tau (charge)", "tau (discharge)", "location", "northeastoutside");xlabel("time [s]");ylabel("voltage [V]");
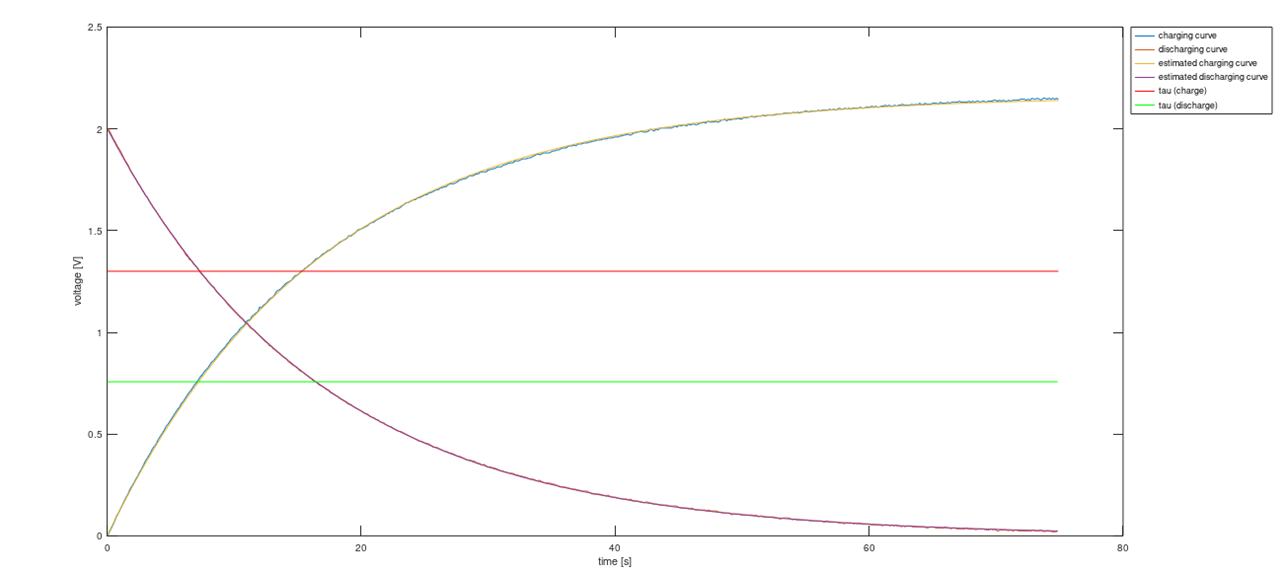
which will give us a plot as below - we can notice that estimated curves are very well matched to the input data vectors:
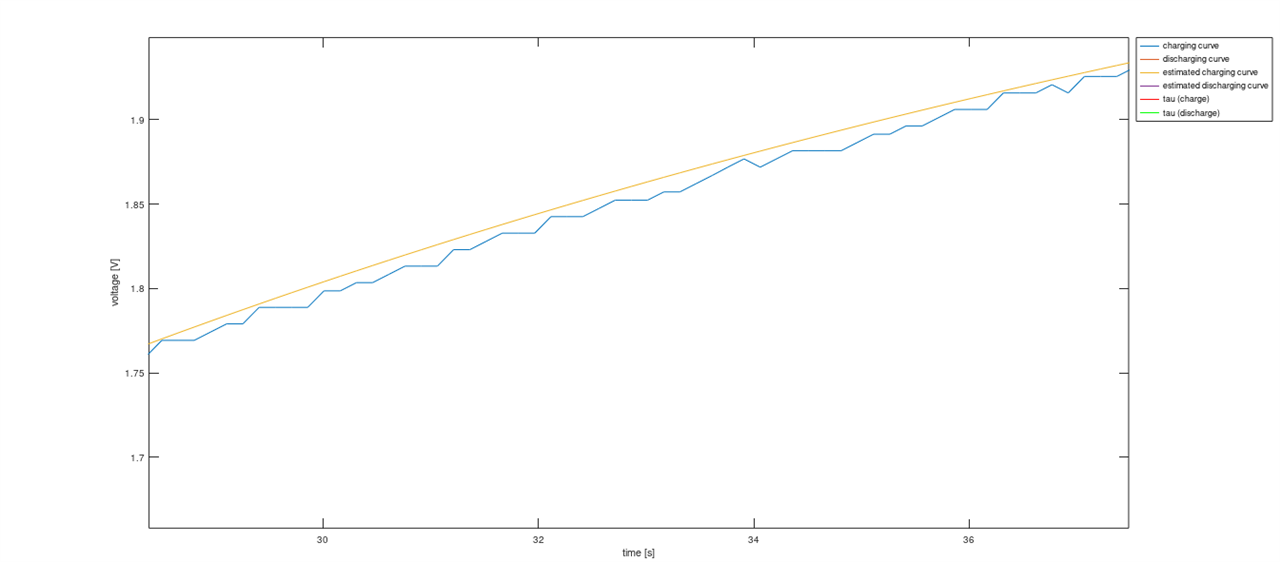
and a close-up - we can see how close those data series are:
Our fitting operation have resulted in new function parameters, calculated by the Octave:
pc = 2.1643 16.7360
pd = 2.0027 16.8979
first parameter is an estimated initial voltage, second is estimated RC constant, from which we can calculate C value:
Capacitance [charge, using curve fitting] = 0.001674 [F]
Capacitance [discharge, using curve fitting] = 0.001690 [F]
charge/discharge difference [curve fitting] = -0.97 [%]
which is giving us difference of 0.97% instead of 10.6%
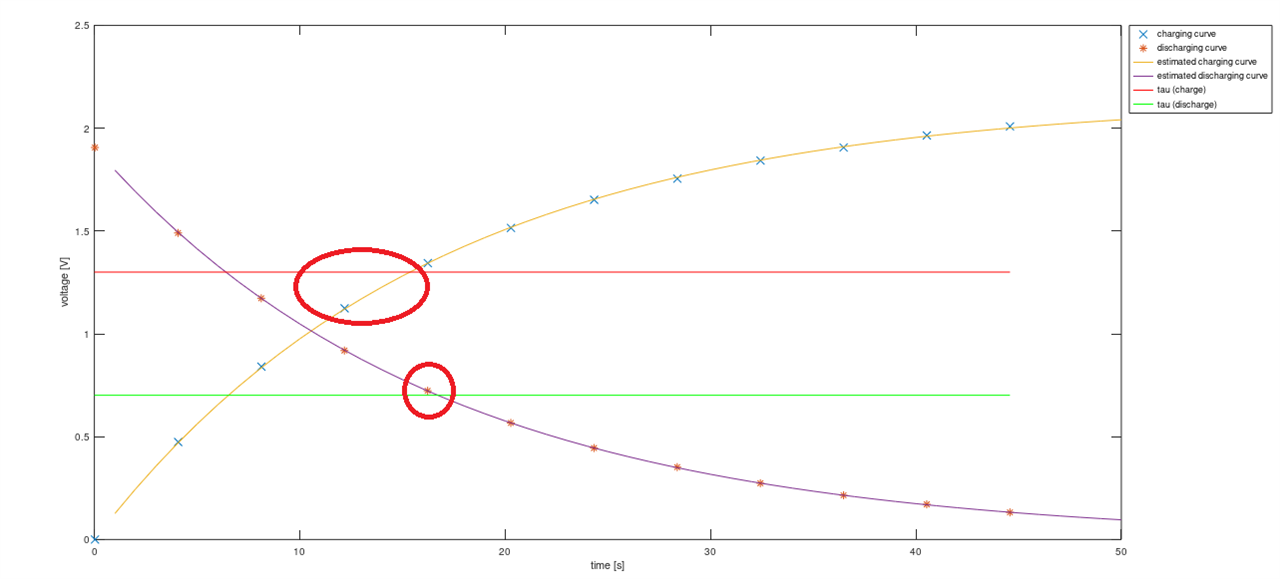
To better illustrate this, we will limit number of data points to 12 (measured every 4s) - in this case timing of crossing 0.368U and 0.632U thresholds cannot be precisely measured - resulting in significant error, but curve fitting still provides good quality data:
Capacitance [charge, using coarse charge time] = 0.001218 [F]
Capacitance [charge, using curve fitting] = 0.001645 [F]
Capacitance [discharge, using coarse discharge time] = 0.001620 [F]
Capacitance [discharge, using curve fitting] = 0.001671 [F]
charge/discharge difference [coarse time] = -32.99 [%]
charge/discharge difference [curve fitting] = -1.56 [%]
As we can see below, by accident measurement point during discharge happened to be near threshold line, but qualifying (with value lower than threshold) data point during charging happened almost 4s earlier, giving large measurement error. Of course, when using better formula (involving not only elapsed time but also voltage difference) errors are reduced, but not to the level of estimation using curve fitting.
Conclusion
Although root error cause (unexpected rise of measured supply voltage during capacitor charging - either caused by real voltage increase or drop of voltage powering Arduino, that is currently the only possible ADC reference voltage) was identified afterwards, curve fitting using GNU Octave has proven to be a reliable and easy to use method of dealing with less-than-ideal input data.
