


This is a continuation of my previous blog - finishing off the open tasks for the submersion test and the additional tasks for the thermal testing.
- Add threaded inserts to enclosure for mounting the RJ45 backshell

- Mount and connect the water leak detector
- Finish submersion frame
- Finish wiring external ethernet and USB cables
- Add InfluxDB to save time series data for thermal tests
Add threaded inserts for RJ45 backshell
Using the rubber boot for a template, I marked the hole positions and drilled the two pilot holes.

Then gradually used increasing drill sizes until I had the 5/32" holes needed for the inserts. Because I don't have the proper fixturing, I chose to hammer the inserts in from the backside. Not perfect, but a reasonable job that works well.

A picture showing the connectors mated with the backshell installed.
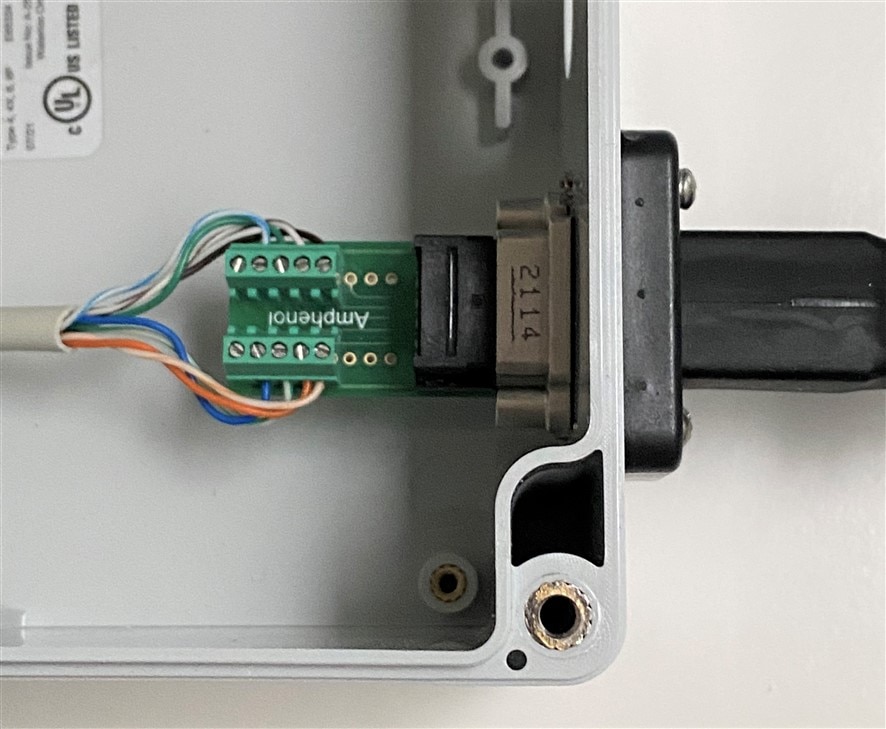
Mount and connect the water leak detector
I mounted the leak detector face down under the baseplate that holds the lattePanda. It should start conducting when the water level reaches 1 mm above the floor of the enclosure. The sensor contacts go through the baseplate and use Dupont jumper wires to connect to the lattePanda I/O.

Sensors wired for software test

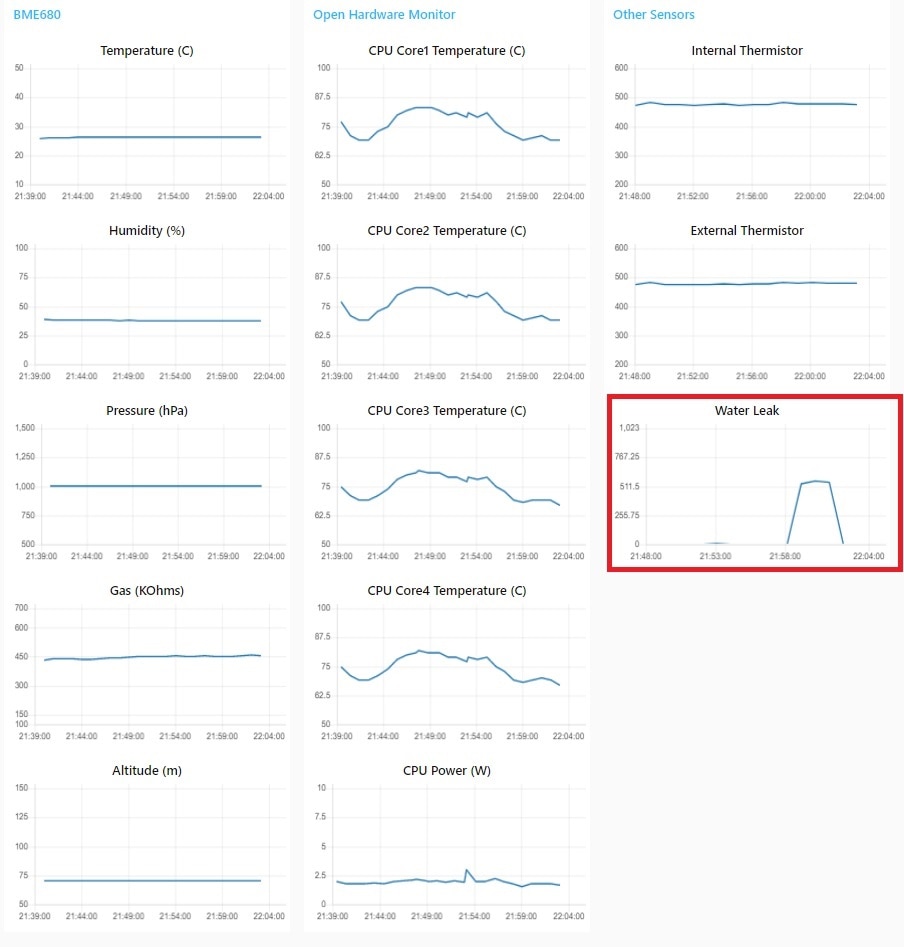
Sensors on Node-Red dashboard. The leak detector is shown in the red box. Normally reads "0" - the jump in value is a result of 30% of the sensor trace area in contact with water.
Finish submersion frame
I needed to add a top structure to the frame to bring it to the correct height to allow me to clamp it in the basin that I'm using for the submersion test. Here is a picture of the completed frame.

And showing it clamped into the test basin.

Finish wiring external ethernet and USB cables
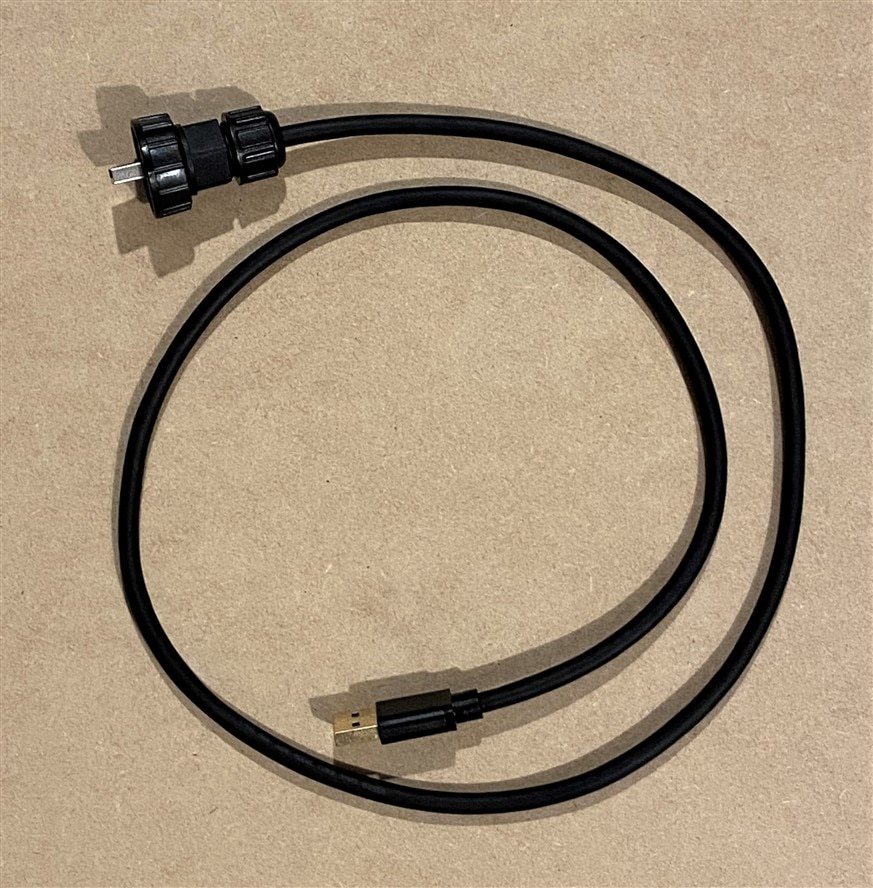
These cables are being used specifically for the submersion test fixture, so I built them just long enough to keep the non-submerged ends clear of the water. I will use the appropriate extender cable lengths to get to the monitoring equipment.
Ethernet cable

USB cable
Add InfluxDB to save time series data for thermal tests
My initial Node-Red dashboard allowed me to visualize the sensor data from the lattePanda, but for testing I need to capture the data into a database for analysis. I looked at using cloud databases. I saw a Hackster project that used Qubitro and it was quite easy to interface the MQTT JSON data, but their dashboard structure and documentation are quite lacking. It turns out that they are in the midst of getting out a new release that will have the features that I need and hopefully better documentation - but that won't help me right now. I decided that I would use a local instance of InfuxDB that I can run on the RPi4 that I'm using for the Node-Red dashboard and there is an integration (contributed nodes) available to allow me to use the current Node-Red flow and dashboard.
Install InfluxDB
The process to add InfluxDB to the RPi4 is straightforward, but slightly convoluted.
- Insure that all installed packages are up to date by running the following commands:
- sudo apt update
- sudo apt upgrade
- Add the InfluxDB repository key
- curl https://repos.influxdata.com/influxdata-archive.key | gpg --dearmor | sudo tee /usr/share/keyrings/influxdb-archive-keyring.gpg >/dev/null
- Add InfluxDB repository to sources list
- echo "deb [signed-by=/usr/share/keyrings/influxdb-archive-keyring.gpg] https://repos.influxdata.com/debian $(lsb_release -cs) stable" | sudo tee /etc/apt/sources.list.d/influxdb.list
- Update the package list
- sudo apt update
- Install influxDB
- sudo apt install influxdb
- Start InfluxDB at boot
- sudo systemctl unmask influxdb
- sudo systemctl enable influxdb
- Start the InfluxDB server
- sudo systemctl start influxdb
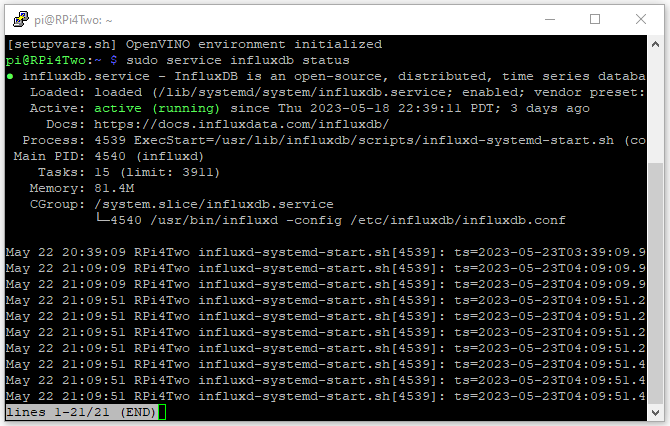
- Verify that InfluxDB is running
- sudo service influxdb status
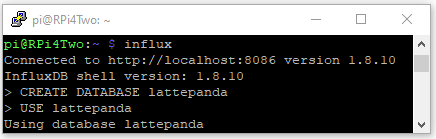
Use the influxdb cli to create the "lattepanda" database to store the sensor data.
Add InfluxDB interface nodes to Node-Red
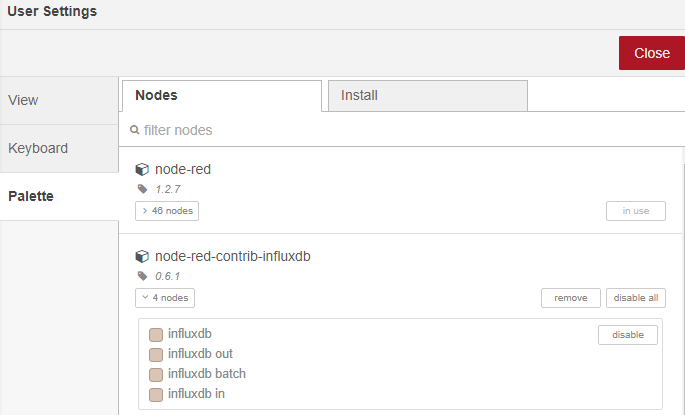
To install the InfluxDB interface - go into Pallette Manager and install node-red-contrib-influxdb.
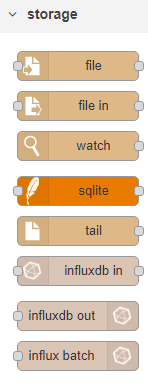
The nodes will appear in the Storage section
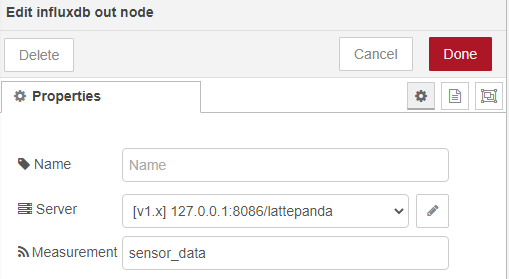
Add the influxdb out node to the flow to load the lattePandaSensors JSON data into the database.
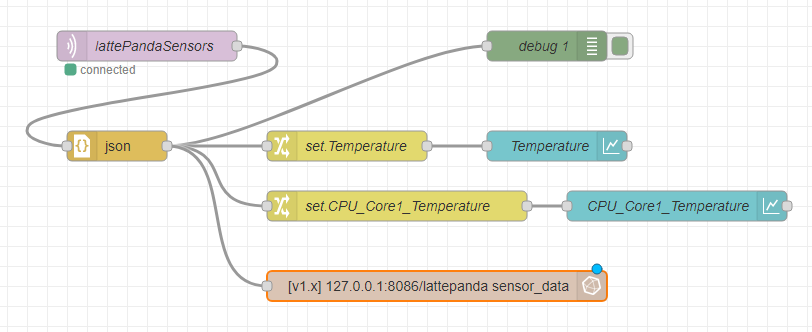
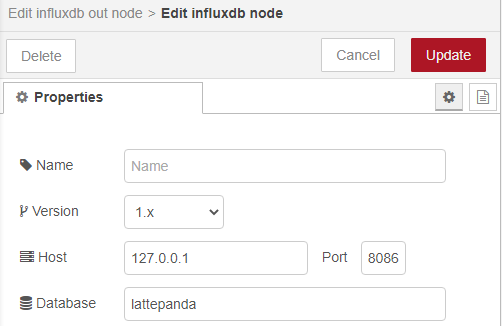
The influxdb out node is configured to send data to the "lattepanda" database. I am running the InfluxDB on the same RPi as Node-Red, so it connects to localhost using Port 8086. The measurements will be stored in a table called "sensor_data".
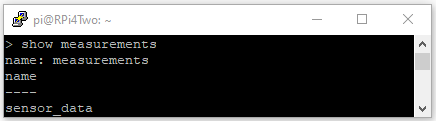
Query the database to see the measurement table.
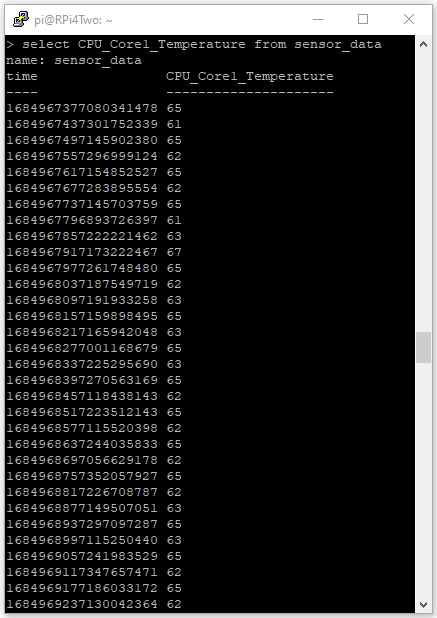
Read a sample from the database to verify storage is working. For this example I read the time series data for the CPU Core1 Temperature.
Time to start testing...
The hardware and software components are now complete. It's time to assemble all the hardware and start testing.