


Introduction
The raspberry pi does not have the conventional x86 architecture for a processor. Instead it has an ARM processor running at 400MHz. Now this means that even though you are running Linux and even though you can compile the same program using GCC on ARM as on a PC, the output of the compiler will be totally different due to the underlying instruction set. This ultimately means that programs such as MySQL may be different on a PC than the RPi in terms of their execution as well. A lot of times the code is also optimized for the platform such as RPi and all this means that MySQL on the PC might not be the same as on the RPi. Java is an exception because it run on top of the JVM BUT resources on the JVM are not same across platform. Like com ports on windows are like com1, com2 etc but in Linux, everything is a file like /dev/usb0 /dev/AMA0 etc.
The Problem
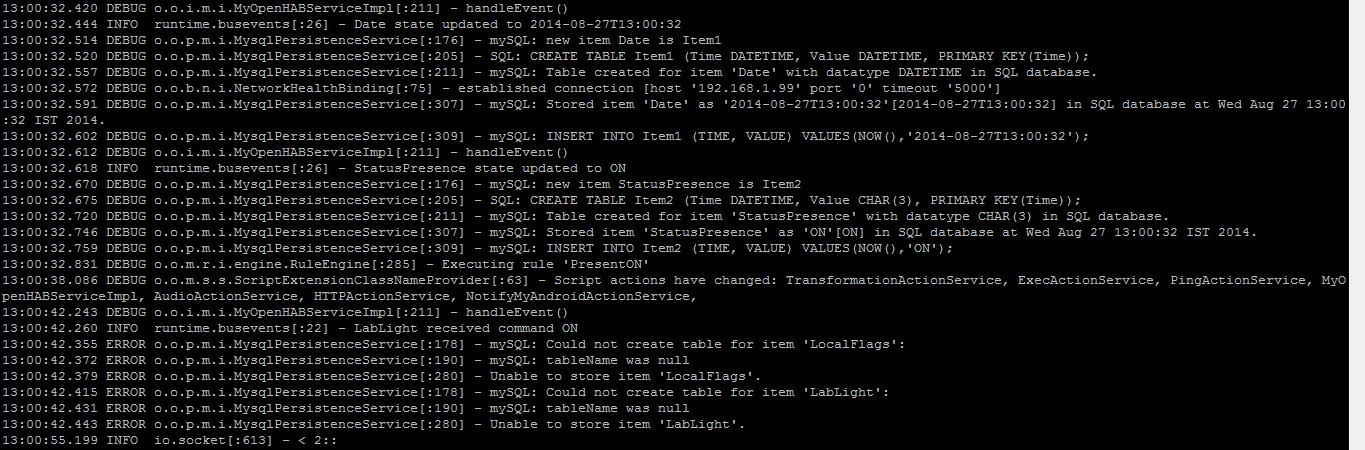
I struggled with getting persistence to work on the RPi and it simply did not work. I tried the MySQL approach but OpenHAB just did not post values as expected. I got the following on the console.
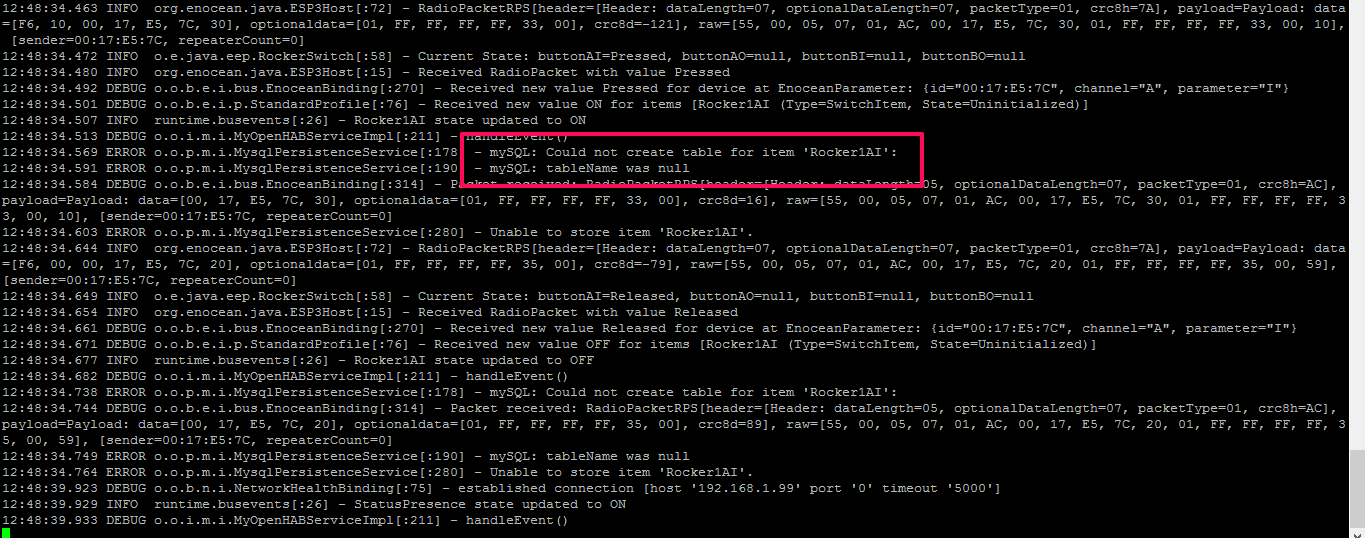
It did work some times but it seemed temperamental and I was not interested in fiddling around more than I already had. All I want is some graphs of temperatures and other things. I might try setting up MySQL elsewhere and then try connecting it from the RPi but I don't need that right now. I already have an MQTT broker, Samba and SSH running so if I can do without MySQL, I would be better off. Additionally, the MySQL database can grow with time which will needs to be maintained. If I plan this to be an independent device, I would much rather have a database else where. MySQL not now...
RRD4J- The setup (illustrated)
I opted for RRd4J which is a Round Robin Database for Java. The upside is that it stores everything in a file and with time, it discards intermediate samples so that the database gets compressed. I wont need temperature for every minute from 10 months ago. For that I would have a database elsewhere. The second upside is that OpenHAB uses it to create graphs anyways. There is a downside as well. It cannot be queried like a standard database. But I'm OK with that. I started by downloading the add-on for RRD4J. I then created a persist file that looked like this.
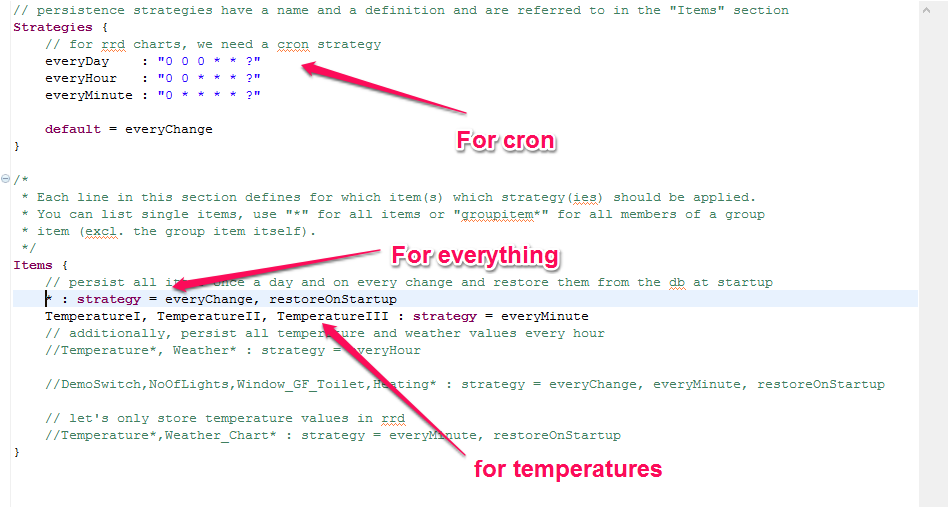
The strategies are basically names given to cron arguments. The items section tells us what to store and when. Now with time, you can add a lot of things to the database and you can use a wildcard (*) to store everything, but I would rather add individual items. For buttons, I used the 'onChange' strategy so that it gets saved only when there is a click. Honestly, I won't need em but hey, why not. The next is my temperatures. Now people would use onChange here as well but then how would you plot em if the temperature never changed through the night? Instead I choose the everyMinute and onChange strategy. The EnOcean modules by default, will send significant changes after 100 seconds which can be changed by pins or via software. I will get to that in a different blog, but right now the focus is persistence. For RRD4J, you do not need to set permissions, access control etc. At this point we are basically done. The RRD4J is setup and will save data in files as per strategy.
The Output
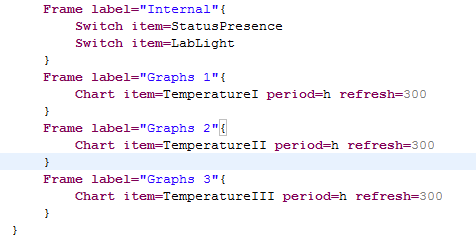
Now to display these things. The simplest thing to do would be to plot something. For that, my sitemap and output looks like....
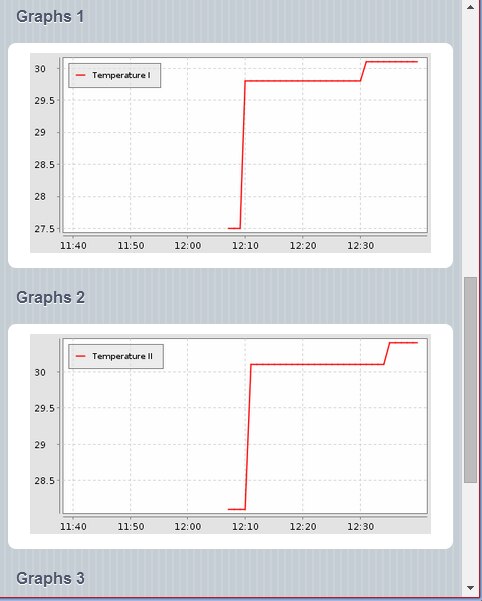
Combining Plots
Here I have plotted the graph individually. I have three temperature sensors so I would rather plot them all together. To do that we need to change the Items file and make the temperatures part of a group. First we define a group and add the temperature variables to that group.
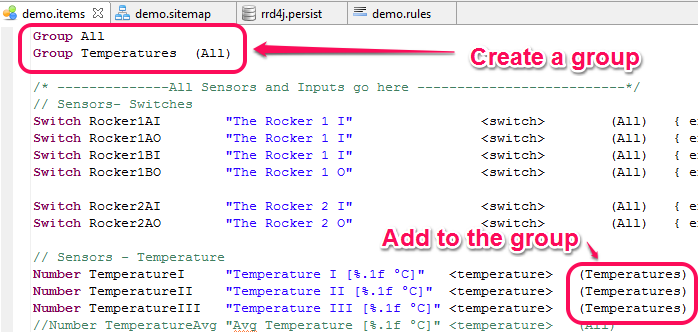
Items File
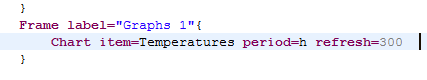
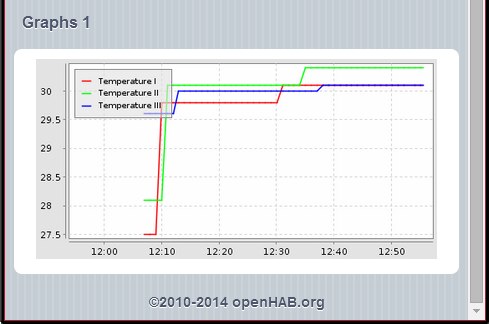
Modified Site Map
Next we can simple plot the entire group instead of individual items. Simple.
Doing Calculations
Next I would like to measure the average, maximum and minimum temperatures... For that we add another variable to the items. Below the three number items add the following...
Number TempAvg "Avg Temperature [%.1f °C]" <temperature> (Temperatures)
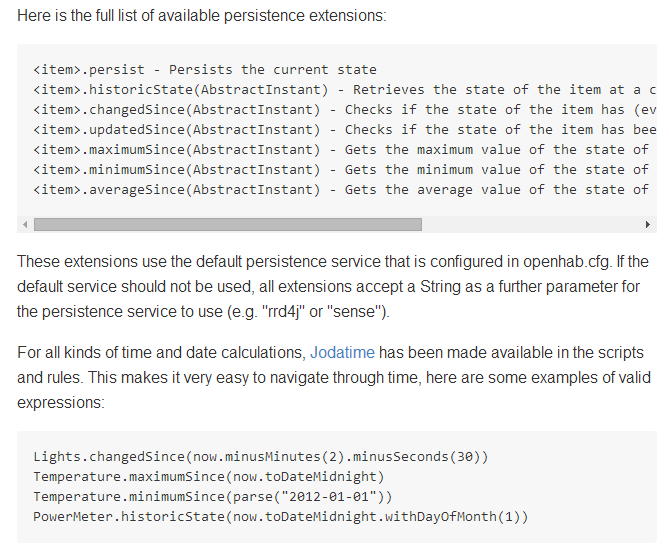
This is where we can store the average temperature. Next we need to calculate the average temperature. We can simply do that using the in build functions. I found a list at the wiki.
https://github.com/openhab/openhab/wiki/Persistence
I use the following rule
rule "Calculate Average I"
when
  Item TemperatureI changed
then
  var temp = TemperatureI.averageSince(now.minusHours(4))
  postUpdate(TempAvgI, temp)
end
You can do a multitude of things using persistence and the in built functions. I will be looking at thresholds. My requirement is to use rules in thresholds to generate notifications and alarms. Here is a scenario.
One More Thing
One last thing about charts is that the ones we have worked out have a fixed duration. The period has be set to 'h'. This can be changed on the fly. What we want is to be able to move between hours, days and weeks for periods. Credit for the code goes to F. Vanderbosch and his post. For this the first thing we need is a set of buttons. Add the line to the sitemap where you want the selection buttons.
Switch item=Temperature_Chart_Period label="Chart Period" mappings=[0="Hour", 1="Day", 2="Week"]
Here the item Temperature_Chart_Period will have value 0,1 or 2 and will have labels Hours, Day and week. You can change things here as per requirement. Now we do not generate charts on the fly. Actually we will be generating all the desired charts but will be setting the visibility for only the one we want but adding some code to the chart item in the sitemap. Modify the chart items as follows:
Frame label="Graphs"{
  Switch item=Temperature_Chart_Period label="Chart Period" mappings=[0="Hour", 1="Day", 2="Week"]
  Chart item=TemperatureI period=h refresh=300  visibility=[Temperature_Chart_Period==0, Temperature_Chart_Period=="Uninitialized"]
  Chart item=TemperatureI period=D refresh=1800 visibility=[Temperature_Chart_Period==1]
  Chart item=TemperatureI period=W refresh=3600 visibility=[Temperature_Chart_Period==2]
  }
This should produce a row of buttons with one graph being visible at a time. Be creative!
I really recommend visiting the following link. https://code.google.com/p/openhab-samples/wiki/Tricks
While on the topic... Timers and Rules
While we are on the subject I wanted to show some basic examples on making time based rules.
Example 1. When you want to start a timer on an event and stop on a different event AND snooze on another.
I have in my project a contact switch which is part of the waiting platform which is used as a placeholder for hot food. We expect the food to cool down in say 20 minutes. After 20 minutes, an alarm should sound. If we want to snooze the notification, we should click a rocker switch and that should extend the timer for say 5 minutes and so on. The alarm should also keep ringing till the platform is emptied. Here we go.
var Timer waitTimer=null
var boolean alarmState=false

rule "Waiting Begins"
when
     Item Contact1 changed
then
     if(Contact1.state==CLOSED) {
         waitTimer=createTimer(now.plusMinutes(20))[
               alarmState=true //Set the variable once Time is over
          ]
     } else { // if we have lifted the utensil
           if(waitTimer!=null){
                waitTimer.cancel
                waitTimer=null
                alarmState=false
          }
     }
end
Now For the alarm rule
rule "Alarm State every minute"
when
     Time cron "0 0 * * * ?"
then
     if(alarmState==true) {
          playSound(doorbell.mp3)
     }
end
And lastly, we need to snooze
rule "Snooze Waiting"
when
     Item Rocker1BO changed from OFF to ON
then
     if(Contact1.state==CLOSED){
          waitTimer=createTimer(now.plusMinutes(5))[
               alarmState=true
          ]
     }
I took pointers from this link https://code.google.com/p/openhab-samples/wiki/Rules
EnOcean Modules and Things other than Temperature
I initially intended to use the EnOcean Temperature sensor to send temperature as well as another analog value to the EnOcean Pi. I am able to do so, but it seems that the OpenHAB Binding does not support anything other than the TEMPERATURE parameter at this point. I would like to make changes to the bindings themselves but I do not thing it will be a good exercise at this point. If anyone can help please send me a message.
There is a problem with the network so I will continue this a bit later.
TO BE CONTINUTED HERE
Top Comments