Introduction
In the previous forum post, I have unboxed the TDK USSM kit and then completed a deep-dive into the respective hardware components and their specifications. In this forum post I'll connect the USSM sensors to the demo kit and then explore the TDK's GUI.
Mounting the USSM's in the Enclosure
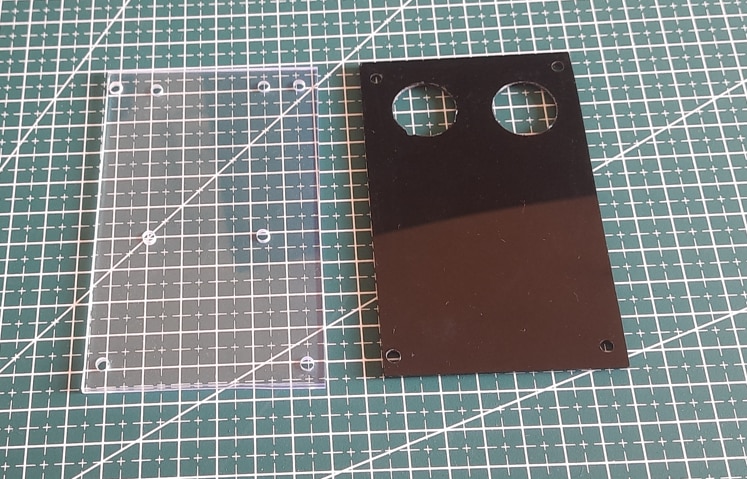
Before even plugging anything in, I wanted to give my hardware a proper enclosure. A stable and secure mounting for the USSMs is critical for getting clean, repeatable data. So, I designed a simple but effective case using two acrylic sheets as shown in the below, the transparent sheet(on the left) to mount the demo board which is the bottom layer and the black opaque sheet (on the right) which is the top layer having mounting holes for the USSM sensor.
The USSMs are mounted as per the instructions(as shown below) which is given in the sensor's datasheet.
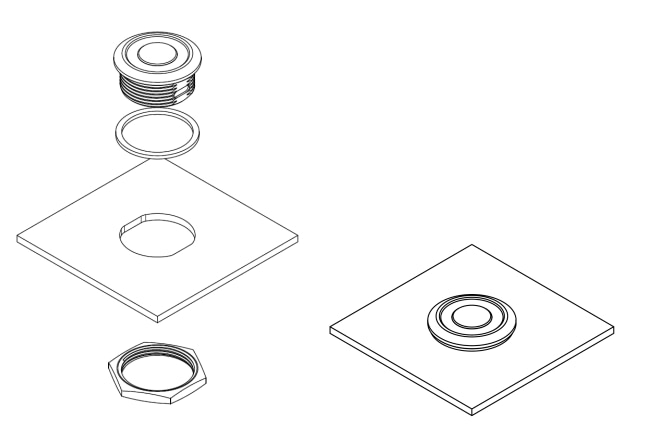
This acrylic enclosure allows the two USSM1.0 PLUS-FS sensors to be snugly fitted and secured with their included locking nuts. This setup not only protects the two USSM's but also provides a solid base for the demo board along with the USSM's, so that I can easily mount them to a tripod for testing and configuration.

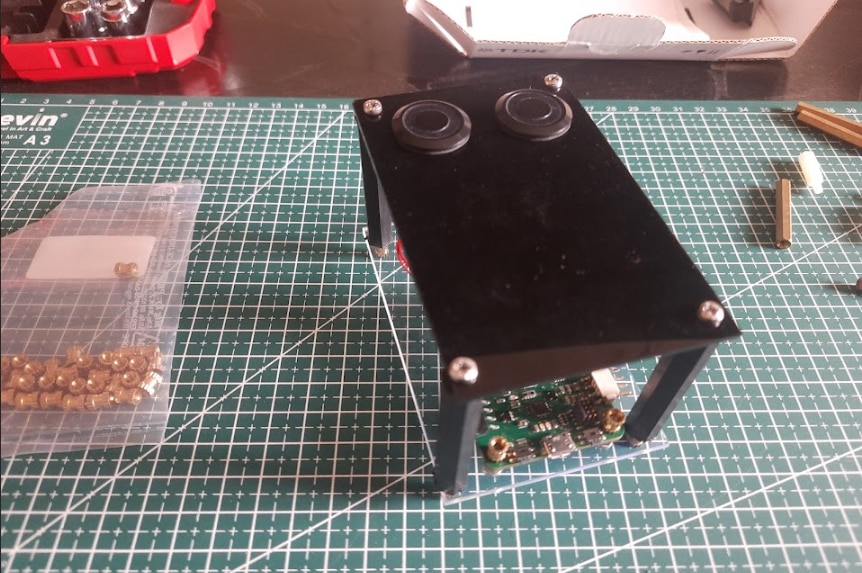
Here's how it looks after all the assembly is done.
Getting the TDK USSM GUI
Now that I have fitted the sensors and the demo kit into the enclosure, I can proceed to download the GUI by going to the TDK Demo Kit Software downloads page.
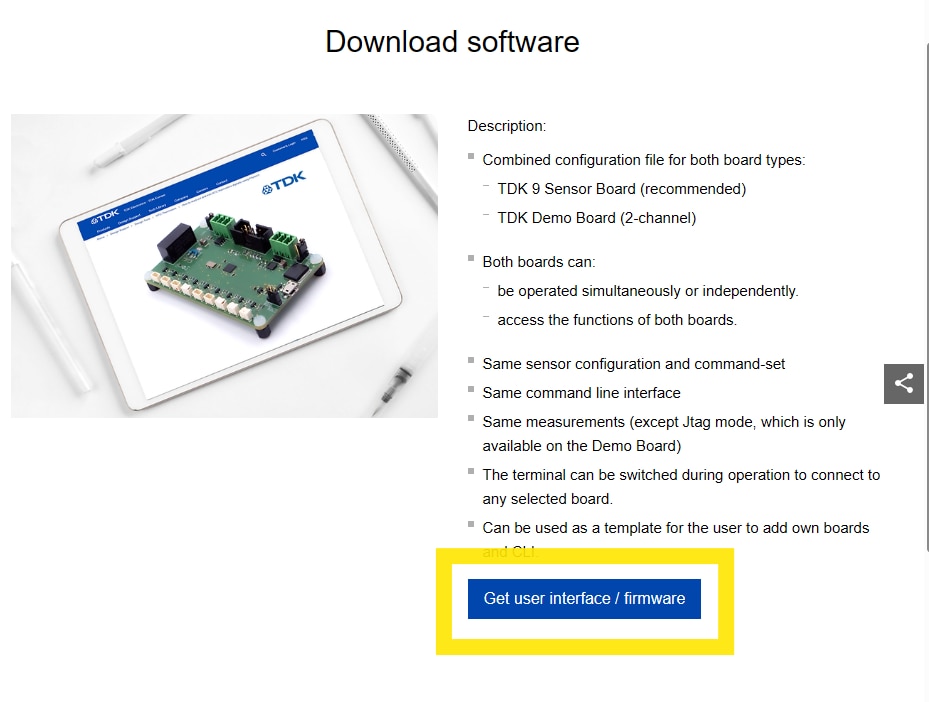
And then I clicked on get user interface/ firmware.
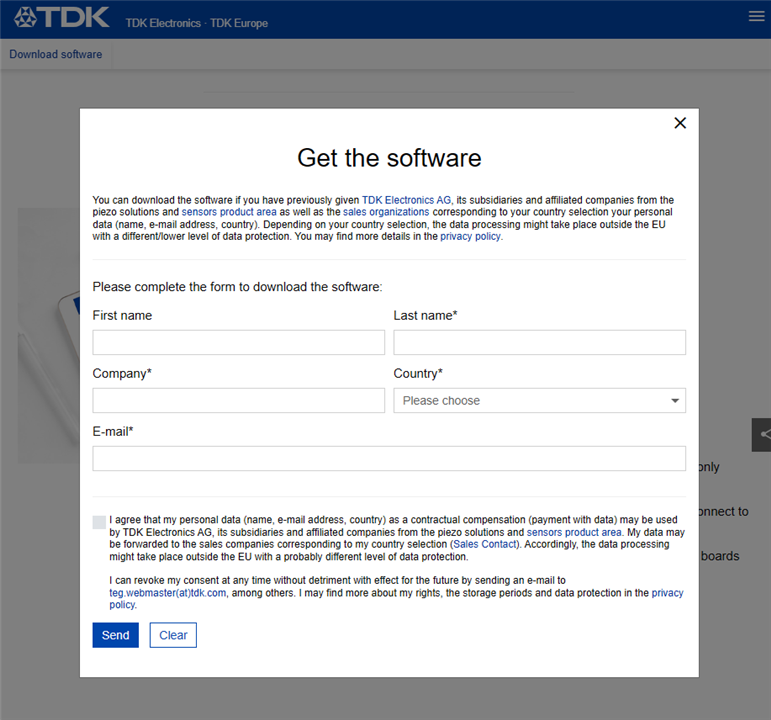
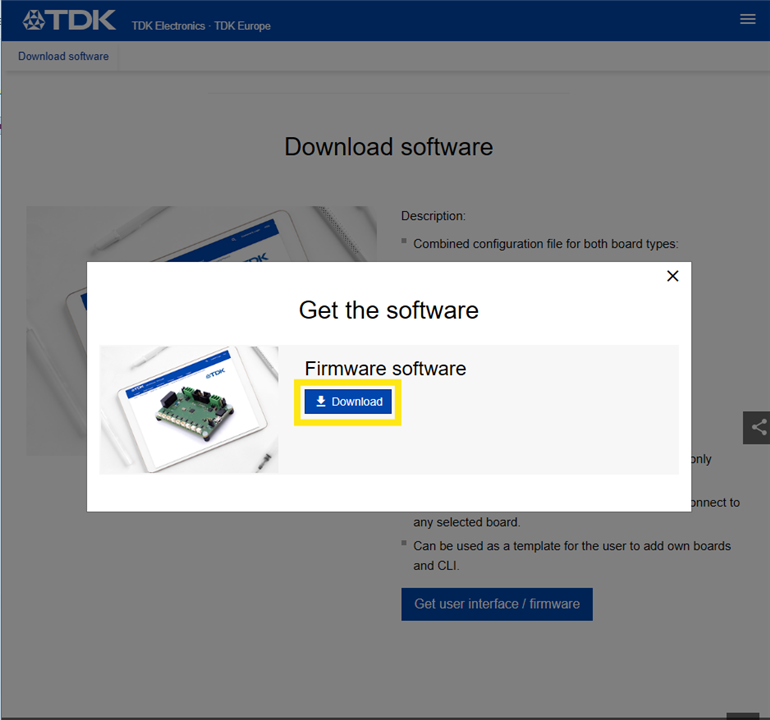
Then I entered the details in the pop-up “Get the Software” then clicked on send and got the download option(as shown below) to download the .zip file.
After the .zip file is downloaded I extracted the files to a folder. There's a folder named "config" and an .exe file. The .exe file named "20250228_TDK_USSM_Sensor_GUI_V3.5" is the GUI for the USSM Demo kit.
Note : The instructions for installation and using the GUI, provided in the reference manual seems to be for the previous version of the GUI which is different as compared to the present(v3.5) version of the GUI available for download.
Exploring the TDK USSM Demo Kit's GUI
Now, after downloading and extracting the GUI, I connected the demo kit to the pc via the USB cable and then launched the GUI.

Note: The demo kit has to be connected to the PC before launching the GUI, else the GUI doesn't detect the connected demo kit and you'll have to relaunch the GUI for it to detect the demo kit.
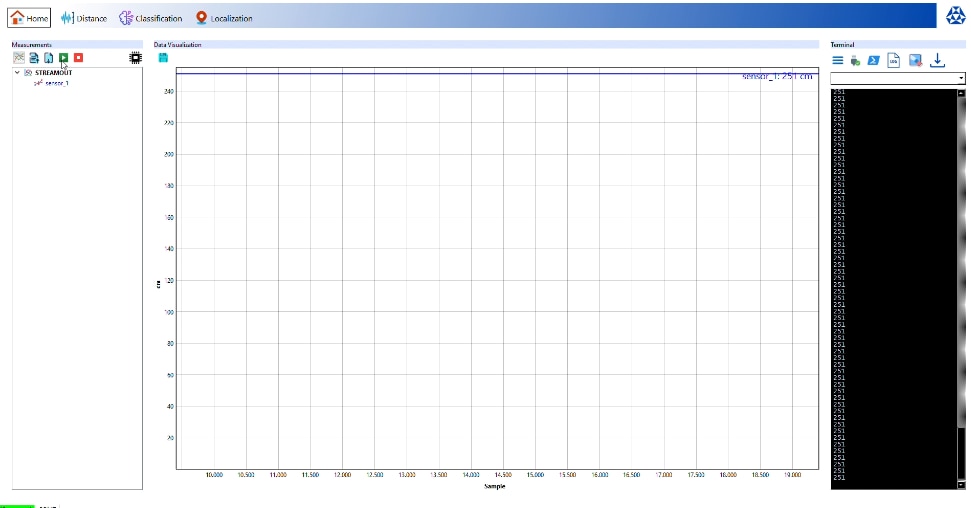
After the GUI loaded I was greeted with the home screen consisting of the Measurements, Data Visualization and the Terminal sections as shown below.
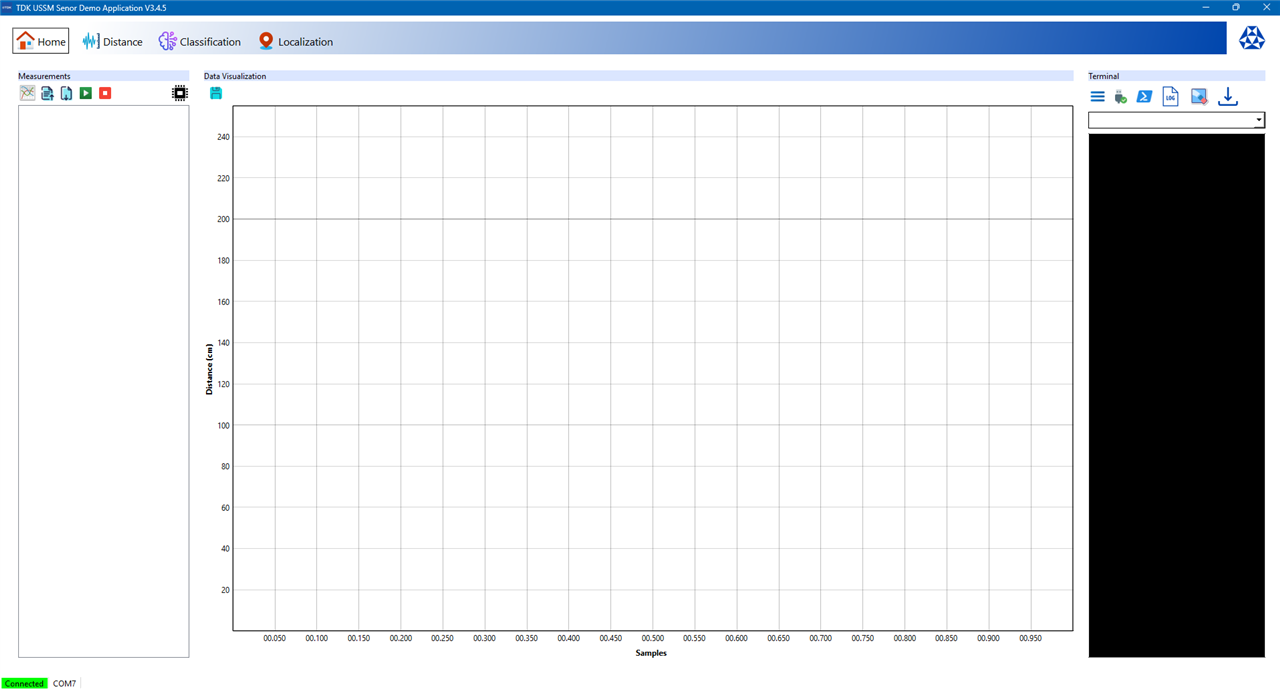
At the bottom of the GUI application the connection status and through which COM port the device is connected is listed.
Measurements Section
The measurements section is the command panel for running tests. It's possible to add new measurement tasks, select from the sensor's various operational modes (I'll discuss more about these modes in the project blog) as shown below.
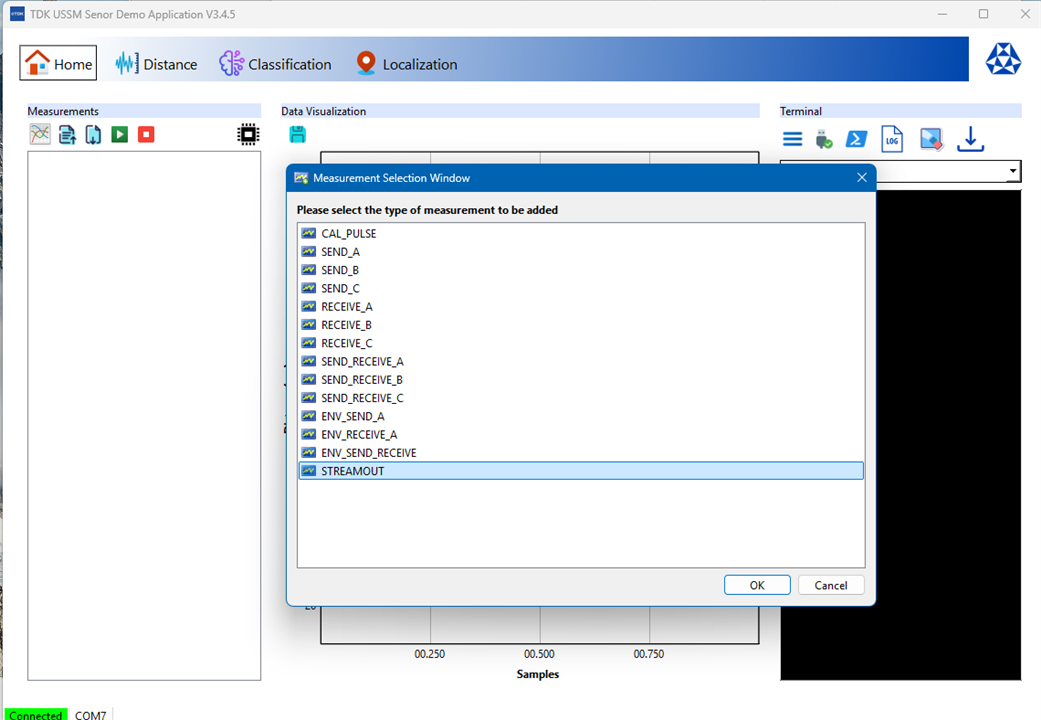
STREAMOUT is the preferrable type of measurement for my initial testing which involves getting the sensor's reading in centimeters so as to check how accurate the distance reading from the USSM is. Another point to be noted is that only one type of measurement can be active at a time, it's not possible to allocate multiple type of measurements for each USSM.
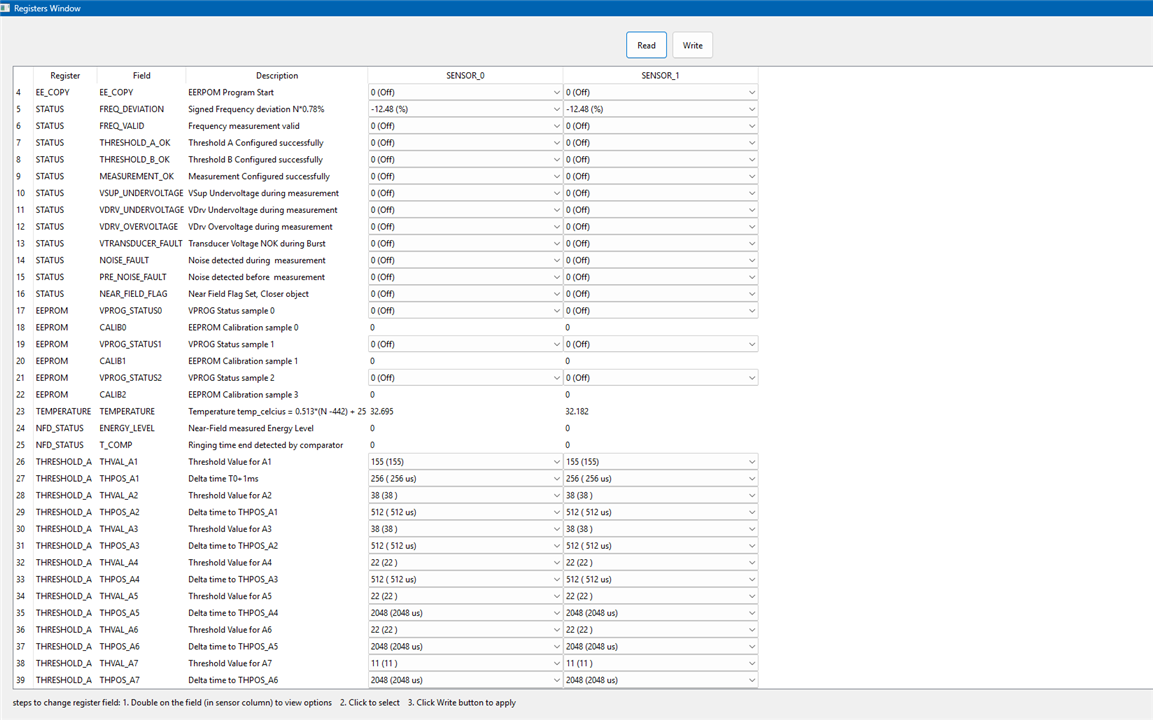
The measurements section can also be used to assign specific sensors to the measurement task, and then start, stop, and save or either export the results from/to a file. There's also a icon to access the Registers Window which allows for the configuration of the sensors parameters (I'll dive into this in my project blog since there's a lot of parameters(109 of them ! but only a few may be required in the final application) to be discussed and configured).
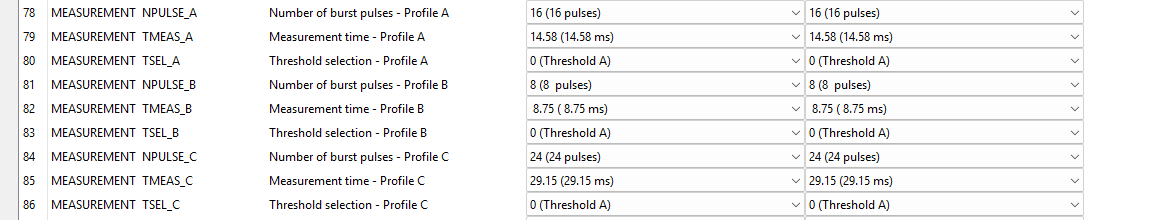
Note: The measurement profiles A,B,C can also be configured through this Registers Window.
Data Visualization Section
It's a real-time graphing window that visualizes the data from the USSMs. It's possible add and visualize data from multiple USSMs and see the sensor's perception through this section.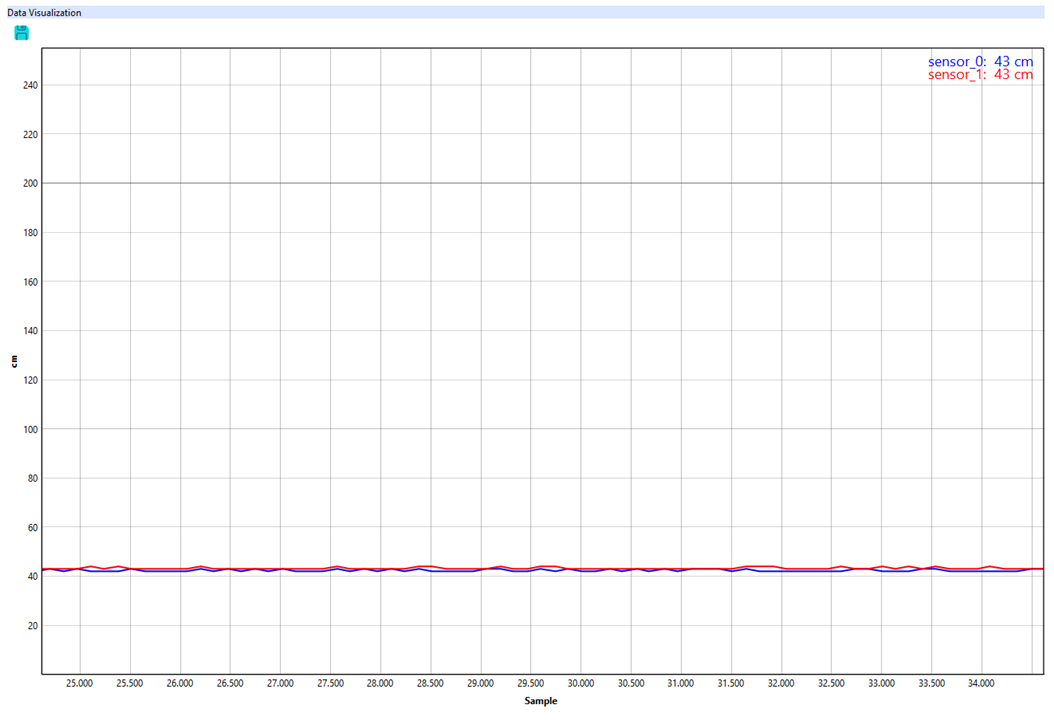
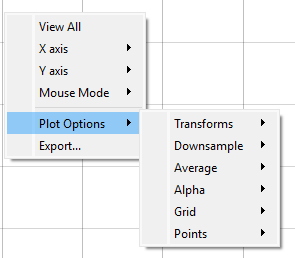
Note : It also has some features for data analysis through transforms, accessible by right-clicking on the graph, which is useful for some quick analysis of the USSM's waveforms.
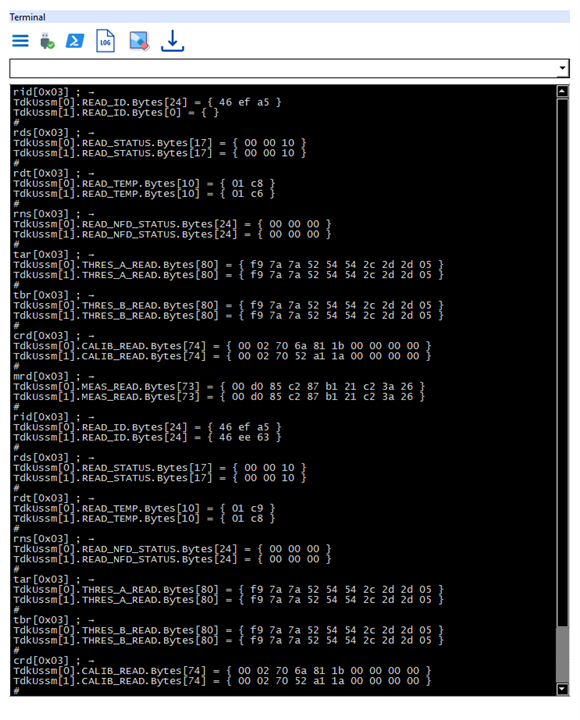
Terminal Section
This is the only working serial console available to pass send commands(as listed in the reference manual) directly to the demo kit through the COM port. It's also possible to save the log of commands and update the firmware of the board in this terminal section.
Note: I did try to connect through the COM port using PuTTY to send commands but it wasn't working. Pressing on the boot button gave some metadata.
Taking the measurements from the USSMs
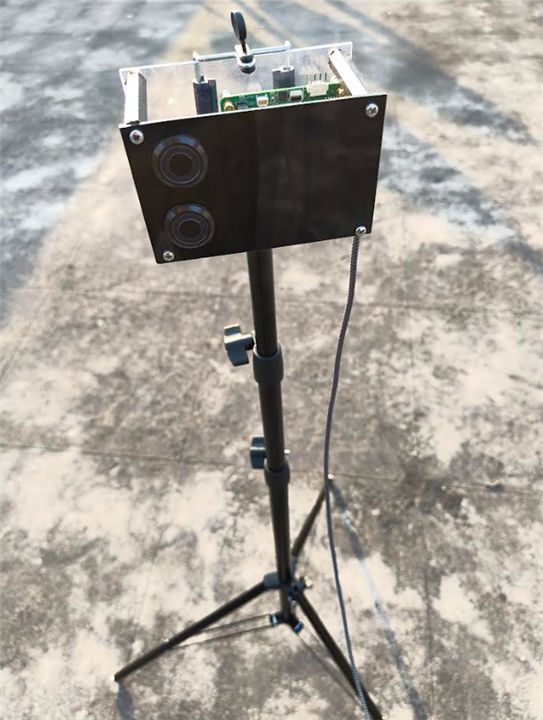
I mounted the TDK USSM Demo Kit on the tripod stand and took it outside to take some measurements using the solo mode for each USSM, by placing a wooden surface nearly 3 feet away from the sensors.
Here's how it looks
Now, using the STREAMOUT measurement type, I observed the measurements from the USSMs.
It seems like the sensor_0 was giving me some fluctuating and "jumpy" readings, especially when compared to the sensor_1's readings, the same result can also be observed from the Distance tab (only the solo measurement mode is available to test even though the picture at the center of GUI shows the range for pitch and catch mode) in the TDK GUI.
Even after placing the the sensors nearly 2 feet away from the wooden surface the sensor_0 readings had too much of the fluctuations.
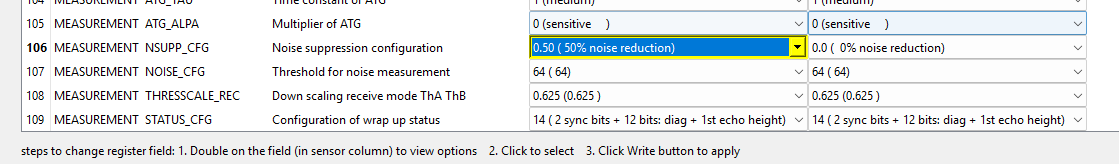
So, I looked into the sensor parameter's through the Registers Window and found that the some of the register values were a bit different.
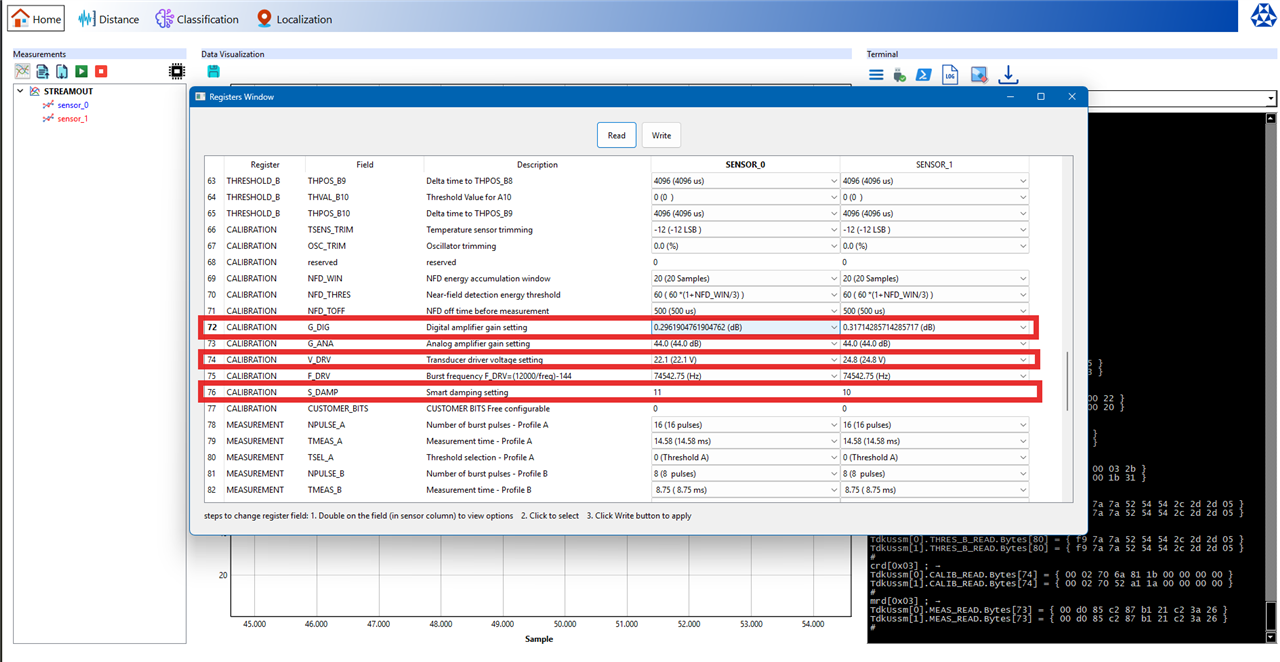
My first thought was that this might be an error. But in fact, this is probably the sign of calibration during the manufacturing process. No two physical components are ever perfectly identical. There may be some tiny, microscopic variations in the piezoelectric material of the transducer or in the analog components of the ASIC and TDK probably performed an end-of-line calibration for each sensor, testing its specific performance and then writing a unique set of calibration values to its internal EEPROM (non-volatile memory) to compensate for the these defects.
This discovery also likely explains an issue I was having, was related to these parameters. So I did adjust the noise suppression from 0% to 50% and the temperature, to try and see if the readings are stabilized for the sensor_0.
After comparing the data from the STREAMOUT measurement for both the USSM's the readings seems to be relatively stable after the calibration, with the margin of error within +/- 1cm (hopefully after a through final re-calibration, I'll try to resolve this too).
Then, I moved the the wooden surface and then did a max range test of the USSM's solo mode (only the pitch and catch mode has the max range of 5m) both the sensors gave different values.
Sensor_0 maxed out at 238 cms
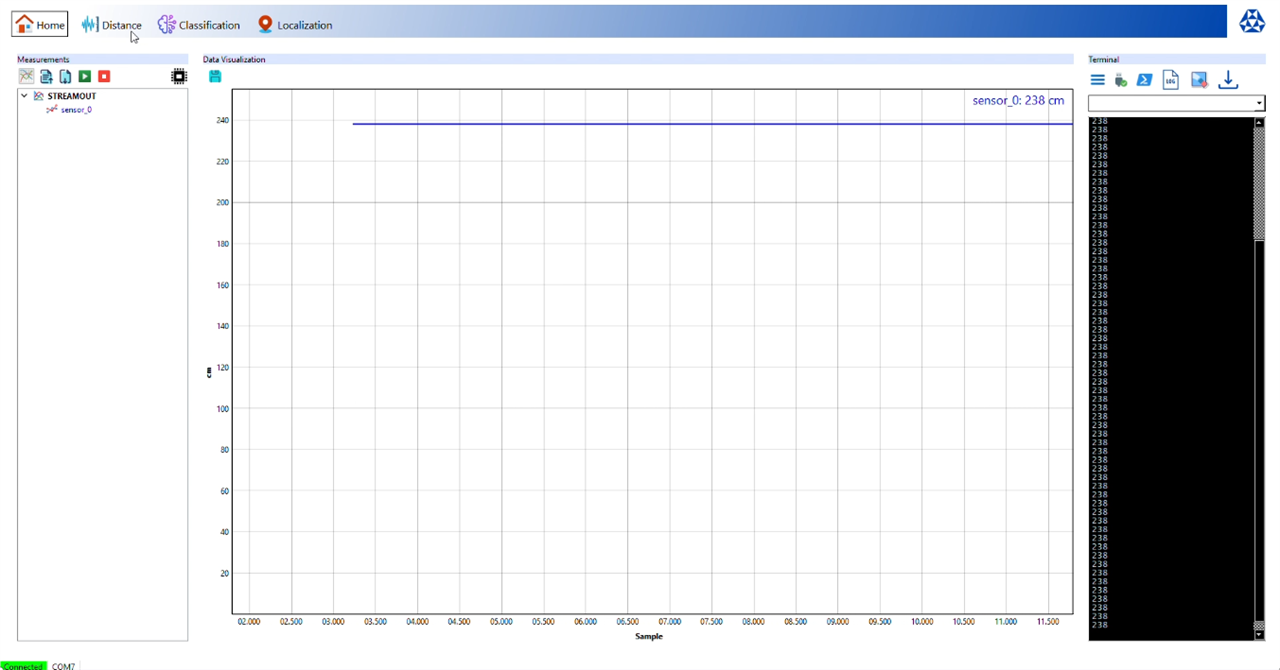
Sensor_1 maxed out at 251 cms.