Blog Content
In this blog entry I will run through the software set up I have used on th instation end of my Just Encase design challenge for remote monitoring of my garden pond, I have split this into two main sections Hardware and Software setup.
Hardware Setup
This is a short and simple one :) I have used the MKR1300 and a single Raspberry Pi (I have used a Model 4b) that was looking for a purpose.
The MKR1300 is connected directly to the raspberry pi using a serial connection on USB. You do not need to seperately power the MKR1300 as it can draw enough from the USB connection (just make sure you are using a good power supply, I am using the USB-C 3A official supply, they do what is needed, are inexpensive and look the part. Function, then form 
Software Setup
Ubuntu (OS used)
Ubuntu is my day to day OS, we just clicked and its stuck with me. Accordingly my instructions on how to replicate the build are geared towards this.
So many ways to go here, least friction route is to make use of the pi image burner for SD cards, you can find it here: https://www.raspberrypi.com/software/
Next grab yourself a stable Ubuntu image, I went with 20.04, burn your image, connect your pi up and away we go!
Decision Point - Pick One.
- Do you want a time series database to store your data and then use Grafana to create your dashboards? if Yes --> InfluxDB (Time series database) to use with Grafana if for you.
- Do you want a time series database to store your data and then use the inbuild UI and dashboard of that database instead of Grafana if Yes --> InfluxDB (Time series database) verion 2 is for you.
I originally started out with Invflux 1.8 and Grafana which i have documented below.
I subsequently forgot about WHY I went with 1.8 and upgraded in place to 2+ (first mistake) and then failed to validate my backup (second mistake).
If I had not forgotten about the conscious design choice, which I had documented, just not read again, I would have stuck with my original apporach. For completeness, I am updating with the you went with the second option. ONLY PICK ONE!!
Finally - design choice. InfluxDB changed the query language between 1 -> 2. Currently the new query language is only supported in Beta for grafana, consequently I broke my dashboard.
InfluxDB (Time series database) to use with Grafana
First step is to add the APT key used to authenticate packages for Influxdb and then add the the influxdb repo:
wget -qO- https://repos.influxdata.com/influxdb.key | sudo apt-key add -
source /etc/os-release
echo "deb https://repos.influxdata.com/debian $(lsb_release -cs) stable" | sudo tee /etc/apt/sources.list.d/influxdb.list
Update APT and then straight to install influxdb:
sudo apt update

sudo apt install -y influxdb
Influxdb is now installed, but not yet running. To make sure Influxdb starts up even if the Raspberry Pi is restarted, we need to enable and start the Influx Systemctl service.
//unmask the service so it can run

sudo systemctl unmask influxdb.service

//start influxdb

sudo systemctl start influxdb

//enable the service to start influx on boot

sudo systemctl enable influxdb.service
and thats it - you now have Influxdb up and running :)
Configuring
Now you have some INfluxDB installed, time to create your first database
//From your terminal

influx

// will

create database pond

//you then need to select your database

use pond

//as we are going to be connecting to grafana lets add it as a user and set a password

create user grafana with password 'your password here' with all privileges

grant all privileges on pond to grafana

//make sure you have added the user

show users

user admin
---- -----
grafana true

// have a looksey at your new database

show database

name
----
_internal
pond
Remember your credentials for the next step :) (p.s. I kept a single user grafana for the node red and grafana piece, you might want to add seperate users? probably a good idea)
next:
InfluxDB (Time series database) and inbuild Dashboard
Backup all the things (if you have saved data like me)
Then install the the ARM64 Ubuntu flavour of the release as such:
wget -qO- https://repos.influxdata.com/influxdb.key | gpg --dearmor | sudo tee /etc/apt/trusted.gpg.d/influxdb.gpg > /dev/null
export DISTRIB_ID=$(lsb_release -si); export DISTRIB_CODENAME=$(lsb_release -sc)
echo "deb [signed-by=/etc/apt/trusted.gpg.d/influxdb.gpg] https://repos.influxdata.com/${DISTRIB_ID,,} ${DISTRIB_CODENAME} stable" | sudo tee /etc/apt/sources.list.d/influxdb.list > /dev/null

sudo apt-get update && sudo apt-get install influxdb2
sudo influxd upgrade
ubuntu@ubuntu:~$ sudo influxd upgrade
{"level":"info","ts":1645701944.5967607,"caller":"upgrade/upgrade.go:402","msg":"Starting InfluxDB 1.x upgrade"}
{"level":"info","ts":1645701944.597043,"caller":"upgrade/upgrade.go:405","msg":"Upgrading config file","file":"/etc/influxdb/influxdb.conf"}
{"level":"info","ts":1645701944.597638,"caller":"upgrade/upgrade.go:409","msg":"Config file upgraded.","1.x config":"/etc/influxdb/influxdb.conf","2.x config":"/root/.influxdbv2/config.toml"}
{"level":"info","ts":1645701944.597724,"caller":"upgrade/upgrade.go:419","msg":"Upgrade source paths","meta":"/var/lib/influxdb/meta","data":"/var/lib/influxdb/data"}
{"level":"info","ts":1645701944.59778,"caller":"upgrade/upgrade.go:420","msg":"Upgrade target paths","bolt":"/root/.influxdbv2/influxd.bolt","engine":"/root/.influxdbv2/engine"}
{"level":"info","ts":1645701944.6292257,"caller":"bolt/bbolt.go:83","msg":"Resources opened","service":"bolt","path":"/root/.influxdbv2/influxd.bolt"}
{"level":"info","ts":1645701944.6325235,"caller":"migration/migration.go:175","msg":"Bringing up metadata migrations","service":"migrations","migration_count":18}
> Welcome to InfluxDB 2.0!
? Please type your primary username admin
? Please type your password *********
? Please type your password again *********
? Please type your primary organization name e14-ham
? Please type your primary bucket name pond_monitoring
? Please type your retention period in hours, or 0 for infinite 0
? Setup with these parameters?
  Username:          admin
  Organization:      e14-ham
  Bucket:            pond_monitoring
  Retention Period:  infinite
 Yes
{"level":"info","ts":1645701969.4598284,"caller":"upgrade/setup.go:73","msg":"CLI config has been stored.","path":"/root/.influxdbv2/configs"}
{"level":"info","ts":1645701969.460073,"caller":"upgrade/database.go:202","msg":"Checking available disk space"}
{"level":"info","ts":1645701969.4712574,"caller":"upgrade/database.go:223","msg":"Computed disk space","free":"23 GB","required":"93 MB"}
? Proceeding will copy all V1 data to "/root/.influxdbv2"
  Space available: 23 GB
  Space required:  93 MB
 Yes
{"level":"info","ts":1645701974.9004018,"caller":"upgrade/database.go:51","msg":"Upgrading databases"}
{"level":"info","ts":1645701975.3185875,"caller":"upgrade/database.go:195","msg":"Database upgrade complete","upgraded_count":1}
{"level":"info","ts":1645701975.3188024,"caller":"upgrade/security.go:45","msg":"Upgrading 1.x users"}
{"level":"warn","ts":1645701975.3189058,"caller":"upgrade/security.go:50","msg":"User is admin and will not be upgraded","username":"admin"}
{"level":"info","ts":1645701975.319021,"caller":"upgrade/security.go:115","msg":"User upgrade complete","upgraded_count":0}
{"level":"info","ts":1645701975.3191135,"caller":"upgrade/upgrade.go:489","msg":"Upgrade successfully completed. Start the influxd service now, then log in","login_url":"http://localhost:8086"}
sudo systemctl start influxdb

//then: <youripaddress>:8086
Node Red (Flow development tool)
Node Red is a favourite of mine, it provides you with a very simple and intuitive UI for building logical flows, give it some inputs, some processes or functions and you get your outputs.
Installing:
Node red has a few dependancies and if you spend any time on trying to install from apt ... you are going to be in for a bad time. I did not know this and so share in the hope of saving someone else some time down the track.
So instead to get yourself up and running have a look at this: https://raw.githubusercontent.com/node-red/linux-installers/master/deb/update-nodejs-and-nodered
This is a bash script to install and setup node red on your Pi, but before you go and bash curl, have a look so you can see what you are running, where it comes from and not take the word of a stranger on the internet
OK, welcome back, hopefully you are now happy and see what you are going to be running on your raspberry pi.
bash <(curl -sL https://raw.githubusercontent.com/node-red/linux-installers/master/deb/update-nodejs-and-nodered)
Is one way you could do it, or just pull a copy of the file locally and run this way instead.
Give it a few minutes and you should now have a nice clean install with all dependancies installed and ready for you to go.
At this point node red is not yet running. You can either start / stop manually, or you can take advantage of automatically starting it as a service. (I went with the latter).
//To manually start

node-red-start

//To manually stop

node-red-stop

//restart

node-red-restart

OR


//To start as a servive and come back up after a reboot / restart:

sudo systemctl enable nodered.service
Configuring your flow:
In the context of my submission, looking at the flow below (left to right)
- LoRA Reciever Bridge to Pi is my input. This uses a serial connetion to the Pi: /dev/ttyACM0 and reads in the recieved LoRA message.
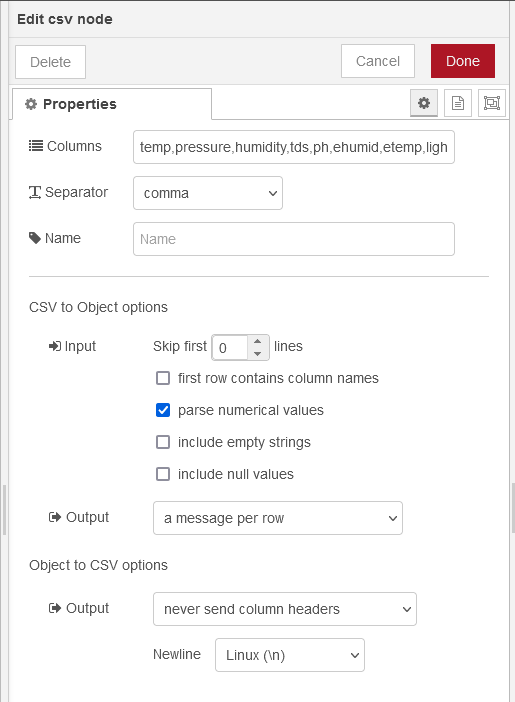
- CSV: defines the list of comma seperated values that come in on the LoRA message
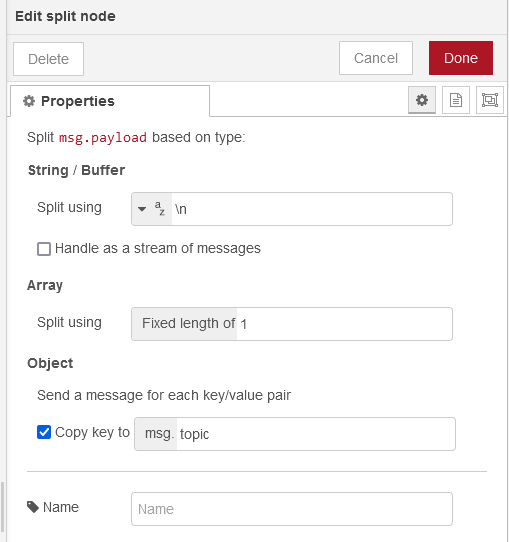
- Split: defines how the message is split, in this case Split
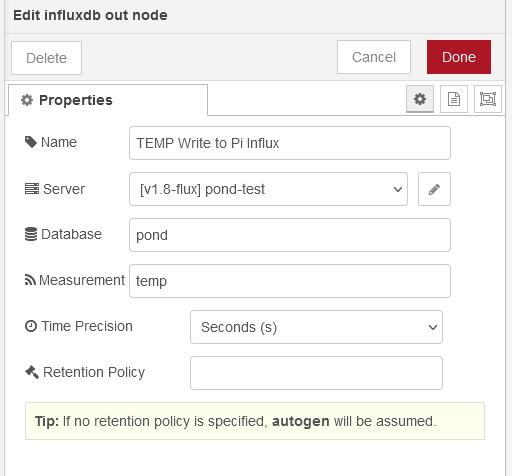
msg.payload, which gives you a payload topic + value (or Key and value) - Switch: Takes the data and for each topic and value, routes this to the correct write instruction to InfluxDB.
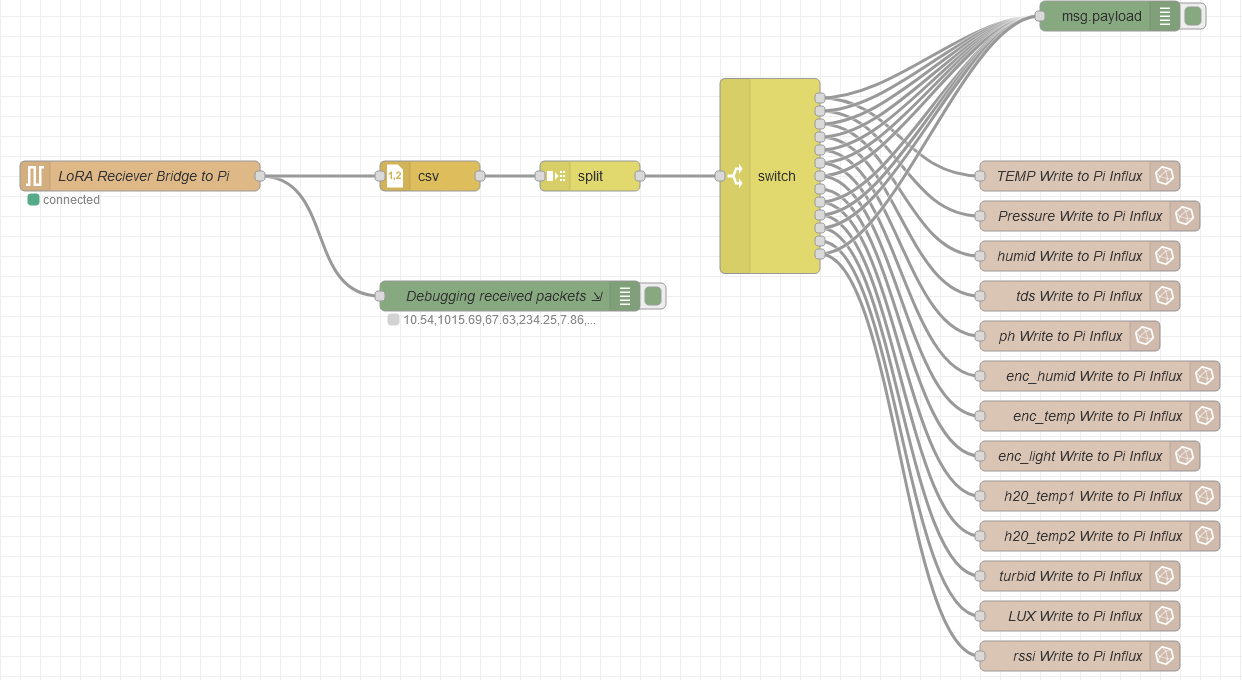
You will also see Debugging recieved packets and msg.payload nodes have been used. So i find it really helpful to see what is actually coming in / out as I was putting the flow together. When you toggle the debugging (green square, rightmost on the two nodes), you will see the outputs in the debugging pane of your nodered window.
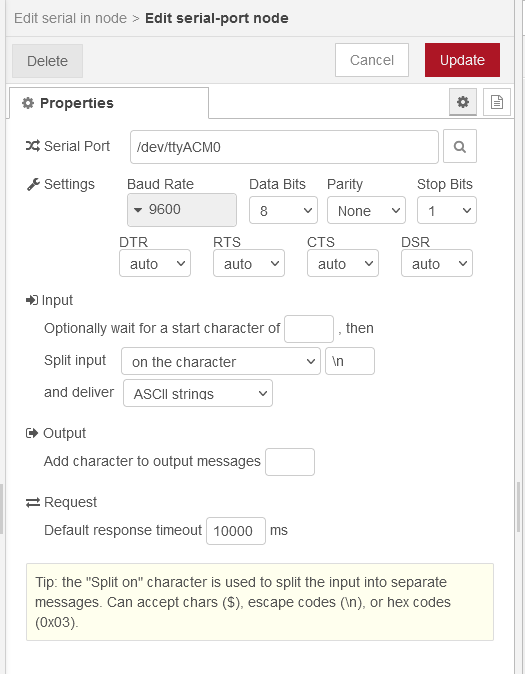
This shows the config for serial connection, to find your own device name (for your Arduinio) open up a console and:
ls /dev/tty*
You should then see /dev/ttyACM0 or if you have more than one USB device attached /dev/ttyACM#, where # might be 1 or another number
I kept my implementation and use of the LoRa message simple, in fact as simple as could be. I do not serialise, deserialise, I have not elected to encrypt the data (as the MKR1300 has the abillity to do this).
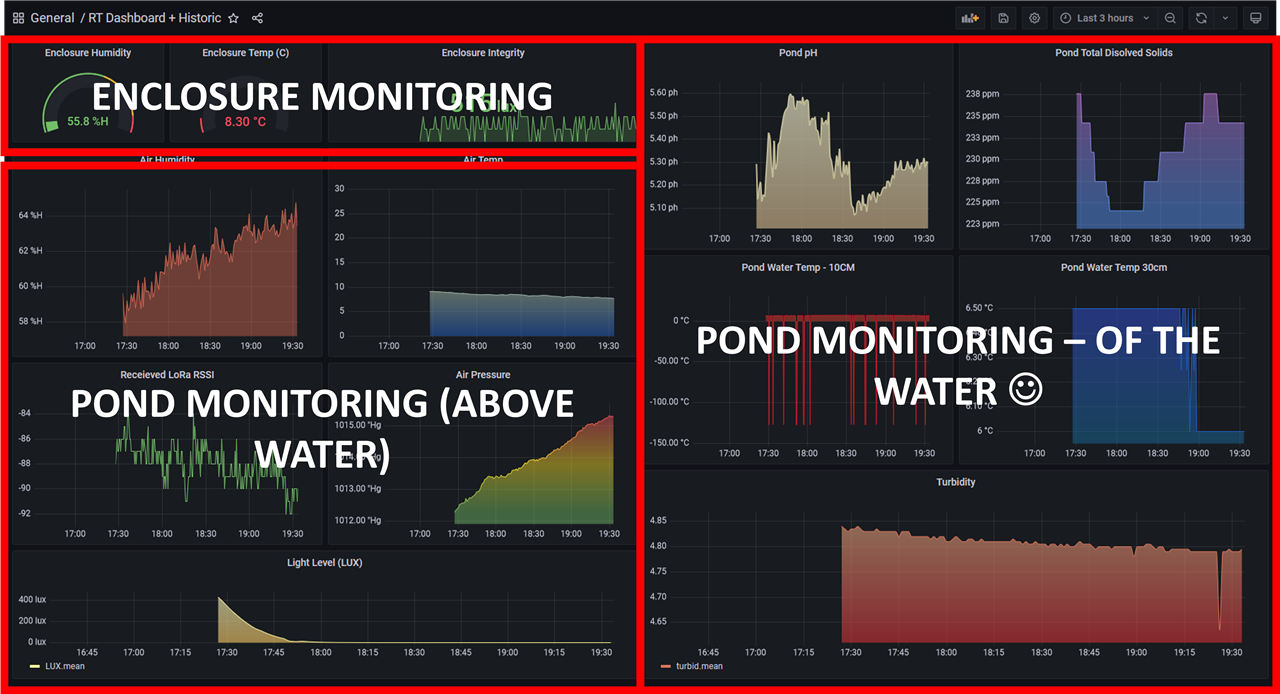
My mesage contains a simple string comprising of comma seperated values, specifically "temp,pressure,humidity,tds,ph,ehumid,etemp,light,temp1,temp2,turbid,LUX,RSSI"
- temp, from the BME280
- pressure, from the BME280
- humidity, from the BME280
- tds, total disolved solids sensor measurement
- ph, pH sensor measurement
- ehumid, DHT22 measurement of enclosure humidity
- etemp, DHT22 measurement of enclosure temp
- light, grove light level sensor for the enclosure
- temp1, - 10cm water depth temp probe
- temp2, - 30-40cm water depth temp probe
- turbid, turbidity sensor measurement
- LUX, ambient light level sensor measurement
- RSSI - the instation Recieved Signal Strength Indication
Each value name is a topic, which as the string comes in based on the position in the string you know you have values in that order
Keeping it simple, topics and values
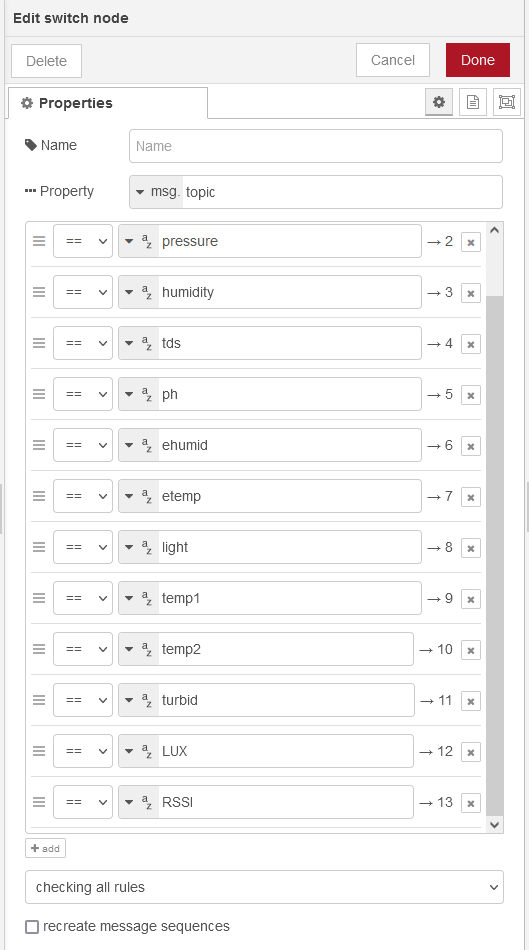
and then connecting using the switch for each topic (or sensor specific measurement), where to write them, as shown below in the final node.
and thats it. Nothing more complicated I hope this is helpful for someone.
Grafana (Dashboards)
Installing:
Now that you’ve got the Raspberry Pi up and running, the next step is to install Grafana.
First step is to add the APT key used to authenticate packages for Grafana
wget -q -O - https://packages.grafana.com/gpg.key | sudo apt-key add -
Next you add the the Grafana repository:
echo "deb https://packages.grafana.com/oss/deb stable main" | sudo tee -a /etc/apt/sources.list.d/grafana.list
Update APT and then straight to install Grafana:
sudo apt-get update

sudo apt-get install -y grafana
Grafana is now installed, but not yet running. To make sure Grafana starts up even if the Raspberry Pi is restarted, we need to enable and start the Grafana Systemctl service.
//Frist you need enable the Grafana server

sudo /bin/systemctl enable grafana-server

//Then you can start the server

sudo /bin/systemctl start grafana-server

//If you need to restart after any changes

sudo /bin/systemctl restart grafana-server
ALMOST There :)
take your pi address and stick:3000 (the Grafana port number on the end) into your browser and you should arrive and the login page.
Last step - default user / password ... admin/admin, you will need to change these on first log in, make them good and secure :)
Setting up your own dashboard: