Well, this is it, my final blog post for the Just Encase Design Challenge! It’s been quite the fun project and I’m so glad that I was chosen to participate in it! In this blog, I’m going to analyze the particulate matter (PM) and temperature data that I collected with my particulate matter device around a campfire. Please see blog #5 for the data collection procedure. The device collected PM2.5, PM10 and temperature data every second and a GPS measured the latitude, longitude, and elevation of each measurement.
This image from Google Earth is a little fuzzy, but it gives the location of the fire pit in relation to the lake.
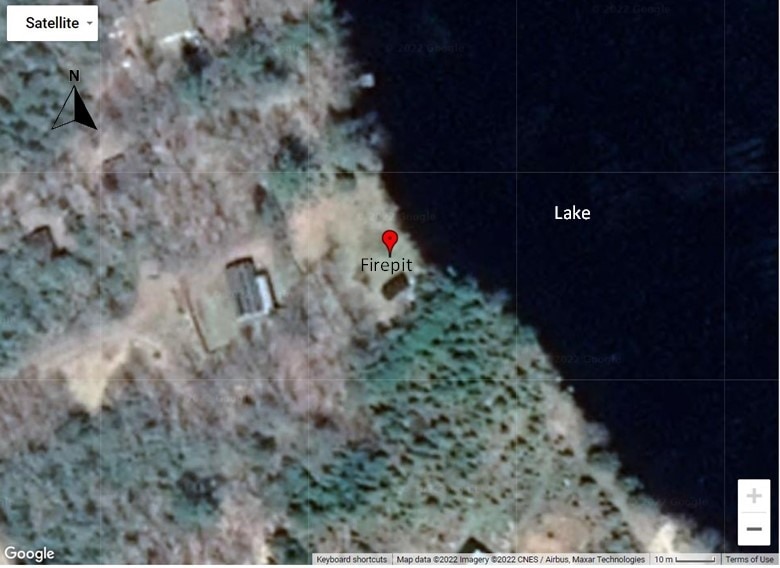
Figure 1: Google Earth view of the location of the firepit.
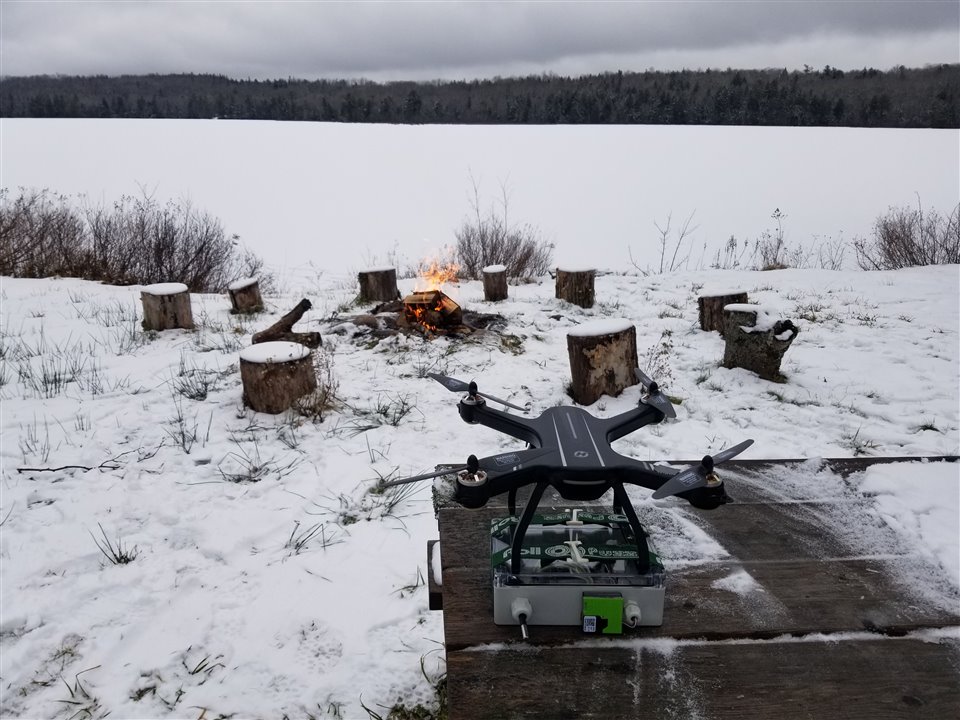
Figure 2: Photo of the drone -mounted device, campfire, and the lake.
First off, I’ll show the temperature plots. When I plotted the data, I converted the latitude and longitude into displacement in meters with the location of the fire as the origin (x=0, y=0, z=0). North is in the positive y direction, east is in the positive x direction, and z is elevation. On the figures, I also indicated the approximate direction of the lake. Each point represents one measurement. The ambient air temperature was around 6°C and it was around 10°C when I passed over the fire. From the plots we can see the wind was blowing in the general direction of the lake because the temperature remained high (near 10 or 11°C) between the fire and the lake. The heat must have also been rising quickly because I recorded higher temperatures at the higher elevation points.
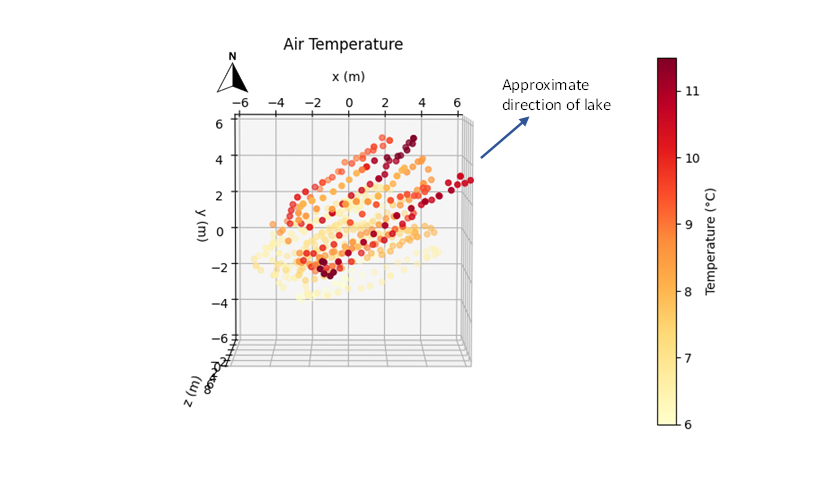
Figure 3: Temperature measurements – top view
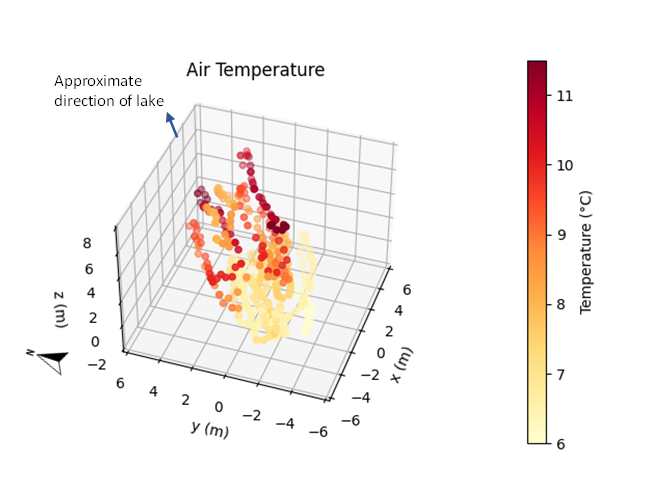
Figure 4: Temperature measurements – isometric view
Now let’s take a look at the particulate matter data. There are two plots for each view (top view and isometric view). One is for PM2.5 which is the particulate matter concentration (in μg/m3) of particles with a diameter of 2.5 μm or less, and PM10 which is the concentration of particles with diameters between 2.5 and 10 μm. The background PM2.5 was around 5 μg/m3 and PM10 was around 0.5 μg/m3. I found it interesting that the background levels were higher for PM2.5 vs. for PM10. This is likely because PM2.5 particles are more easily suspended in air because of their higher area to volume ratio.
The PM data was plotted on a log scale because the readings went from less than 1 to 10 000 and a log scale made it easier to visualize the data. Note than the scale starts at 1 (100) so any values less than 1 (which occurred for background PM10 data) are shown in the corresponding dark purple color. The PM data showed the same trend as the temperature data with higher concentrations occurring in the direction of the lake (assumed wind direction). In the high PM areas (more smoky), the PM2.5 values were generally higher than PM10 which likely indicates that the burning wood was releasing more PM2.5 than PM10.
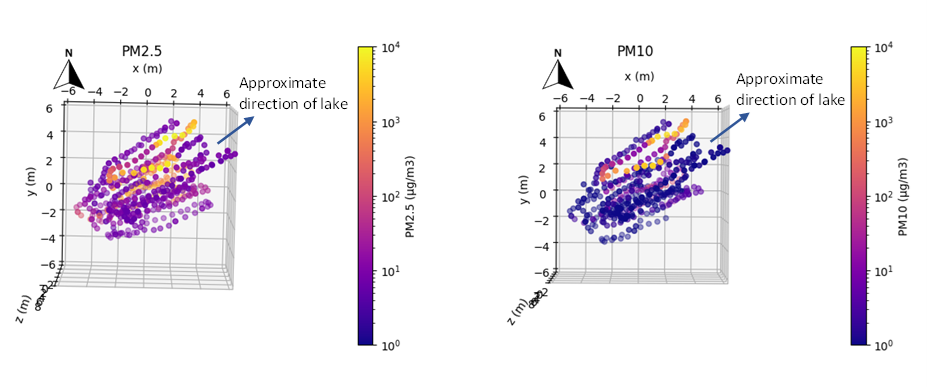
Figure 5: PM measurements – top view
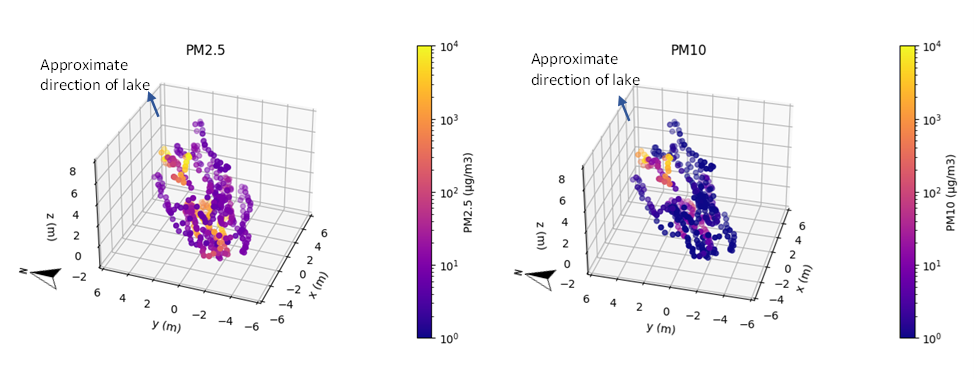
Figure 6: PM measurements – isometric view
The EPA standards for public health indicate that PM2.5 annual mean averaged over three years should not exceed 12 μg/m3 and the 24-hour average limit for PM10 should not exceed 150 μg/m3. From the data, the background levels were below EPA limits but directly above the fire and in the smoke, PM2.5 and PM10 went as high as 10,000 μg/m3 which is way higher than the EPA limits. I should just note that breathing in a few breaths of smoky campfire air would not have significant harmful effects as the EPA standards are time averaged. It would be a different story if you were constantly breathing this air for many hours. For communities near forest fires, the exposure would be continuous and more dangerous, so having a device like mine could help protect communities by mapping particulate matter around a forest fire. These maps could then be used to determine where particulate matter levels are unsafe and which direction and how fast it is changing.
This project showed that a drone-mounted particulate matter sensor device could be a useful tool for mapping particulate matter and temperature due to forest-fires which could help inform public health measures and disaster response planning. The project also demonstrated the durability and performance of the Hammond enclosure in wet, windy, smoky, cold, and hot conditions. It also showed the usefulness of the Arduino MKR WAN 1300 boards and the use of LoRa communication for remote sensing applications.
If I were to take the project to the next level, this is what I would do:
- Get a more powerful drone that could handle higher temperatures and loads
- Get a particulate matter sensor that could handle higher temperatures
- Investigate the effect of the drone’s wash on the PM readings
- Reach out to organizations for possible partnerships for implementation testing
I had a lot of fun with my first design project with the Element14 community. Congratulations to all the other challengers for completing your projects. Thank you for this opportunity and for everyone's interest in my project. And thank you to my husband Nathan and all the others who supported me on this journey!
