Using libraries in Vitis
This blog starts from the training for the Software part described in Lab 10 Libraries.
The lab describes how to use a library in Vitis by selecting a library from those provided for created BSP. In the lab it is taken for example the use of the SPI library to be used with the MIKROE-2731, LSM6DSL Click board. This board contains an iNEMO inertial module which is a
3D accelerometer and 3D gyroscope. In addition, the module also has a temperature sensor.
The MIKROE-2731 can be connected to the Ultra96 board by using the 96Boards Click Mezzanine board provided in the 96Boards Click Mezzanine
Starter Kit.
Fun fact: As many people do, I unboxed the 96Boards Click Mezzanine Starter Kit without reading its datasheet. As I opened the box, only the Mezzanine board was visible so, I thought that that was the only board in the box.
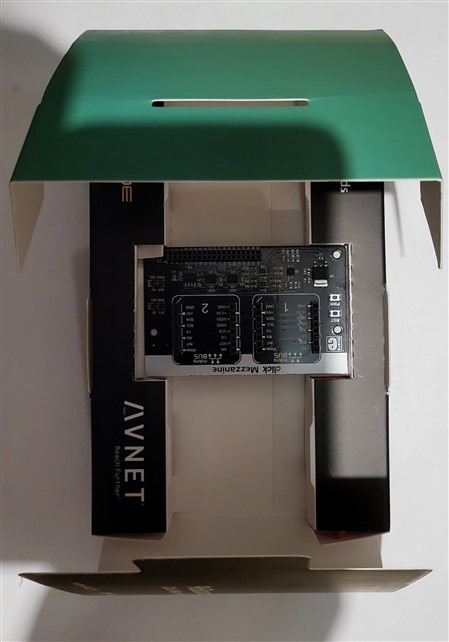
I have followed the instructions of Lab 9 Interrupts (which was supposed to use the LCD Mini Click board) only to the part where the LCD board was to be connected to the Mezzanine board because I've seen no LCD board. I searched on Internet to see where I can buy such a board and planned to order one. Then, when a started Lab 10, I saw that another board was to be used, and there wasn't such a board in the box. I searched also for this board on Internet and planned to order one.
Until I could get these boards, I was thinking to use the Mezzanine board with other sensors with SPI interface in order to use the SPI library. Looking for the pinout of the Mezzanine board, I read the datasheet of the kit and understood that there should be also the other three boards. Finally, looking closer at the box, I discovered the boards hidden in some compartments at the sideways of the box.
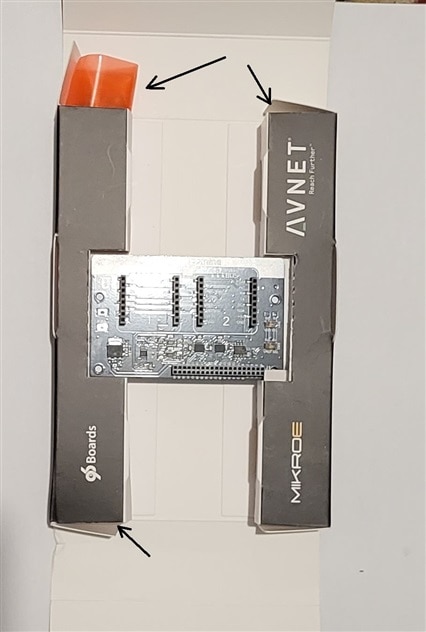
So, I had all that I needed for doing Lab 10 and I followed the steps given in the Lab 10 document and succeded to measure and display temperature in the terminal window.

Hot, isn't it? I mean, we have a hot summer here!
Measuring acceleration
The MIKROE-2731, LSM6DSL Click board. is an inertial module which, is more exactly a 3D accelerometer and 3D gyroscope, right? So we should measure some accelerations and angular rates, not temperature.
Starting from the temperature measurement example code provided in Lab 10, I added lines of code to measure also accelerations on the three axes. In order to do this, the datasheet of the LSM6DSL module must be read. Also, additional information about how to read the sensors from the modules can be found in the application note AN5040 from ST. Here we can find the startup sequence needed to read the sensors. Shortly, after initialization the modules go to Power-Down mode, so it must be configured and waked-up in order to read sensor data.
In the module's datasheet are given the registers for configuration and the registers that should be read in order to obtain the measured data.
Measured data for acceleration is provided in 16-bit 2 complement form, so 2 registers (the low and high bytes) must be read for each axis.
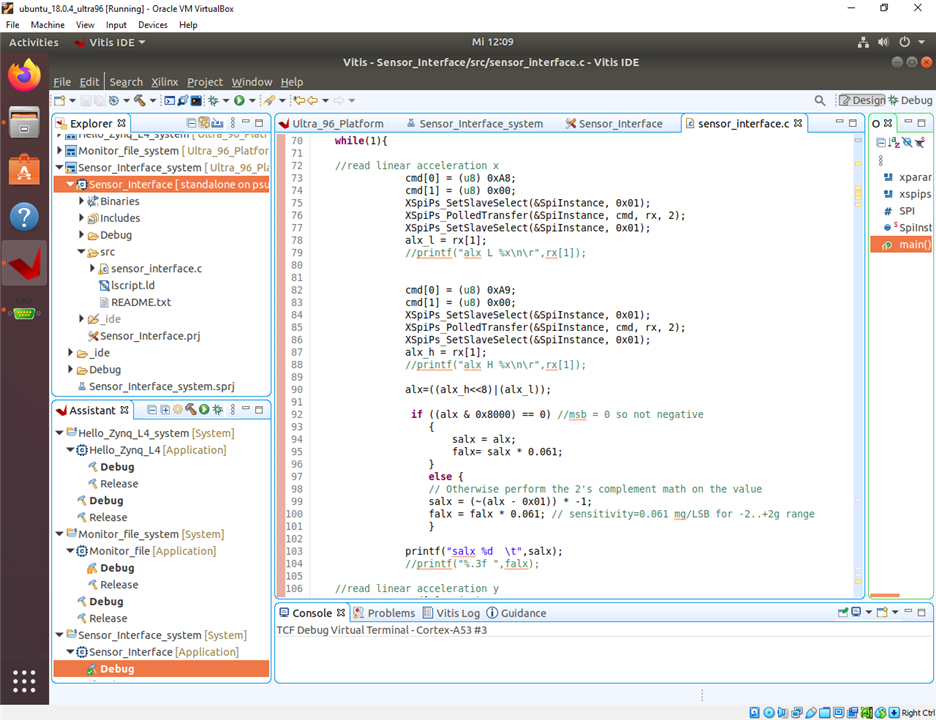
Here is a screenshot of the code for reading acceleration for the x-axis. The configuration was almost the default, the only thing was turning on the accelerometer.
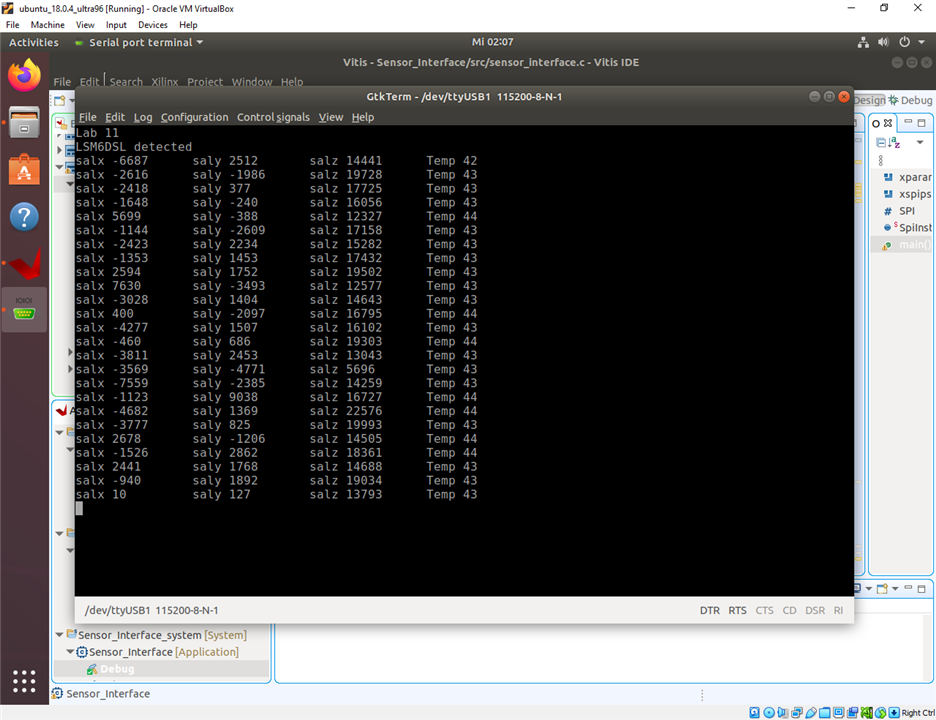
Below is a screenshot of acceleration and temperature data read from the sensors. The real values of the acceleration can be obtained by multiplying these values with the sensitivity of the sensor (depending on the range for which the sensor was configured). In our case, the range is -2...2g, and the sensitivity is (as can be found in the datasheet, 0.061 mg/LSB).
Using ST NanoEdge AI Studio
Recently I started to play with ML, one of the areas I was interested in being the predictive maintenance of electric motors, more exactly, anomaly detection. The idea is to monitor some of motors' parameters, ex. vibration or noise, in order to detect malfunction that can result in motor failure.
I found the ST NanoEdge AI studio to be a software platform from ST Microelectronics that helps developers to design and implement rapidly an application based on ML algorithms running on an embedded system based on ST microcontrollers and sensor boards, to do this monitoring and failure prediction.
To design the application, the designer must follow the steps bellow.

First, the designer must choose an ST board that will be used to implement the application, then acquire the regular and abnormal signals that will be used for the learning process of the ML model. Then the platform will perform the learning, the testing, and the validation of the model that will be provided as a library to be used in the deployment phase.
The regular and abnormal signals can be acquired with the same board (MCU board + sensor shield) and the platform provides directly (once the system is configured) the executable that can be loaded into MCU board to transform it into a data logger.
In my experiments, I used a configuration including a NUCLEO-L476RG board with a X-NUCLEO-IKS01A3 shield that has Arduino UNO R3 connector layout and which features the LSM6DSO 3-axis accelerometer + 3-axis gyroscope, the LIS2MDL 3-axis magnetometer, the LIS2DW12 3-axis accelerometer, the HTS221 humidity and temperature sensor, the LPS22HH pressure sensor, and the STTS751 temperature sensor.
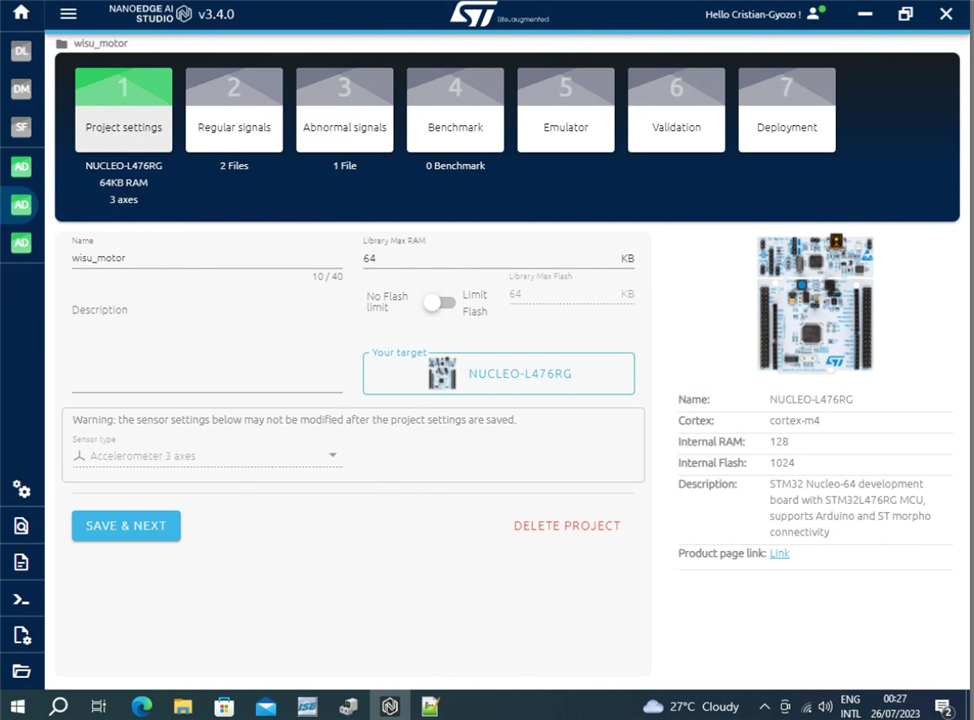
Seeing that the MIKROE Click board has a similar inertial module (LSM6DSO), I was wondering if I can use the Ultra96 board with the MIKROE 2731 as a data logger for creating the ML model for anomaly detection.
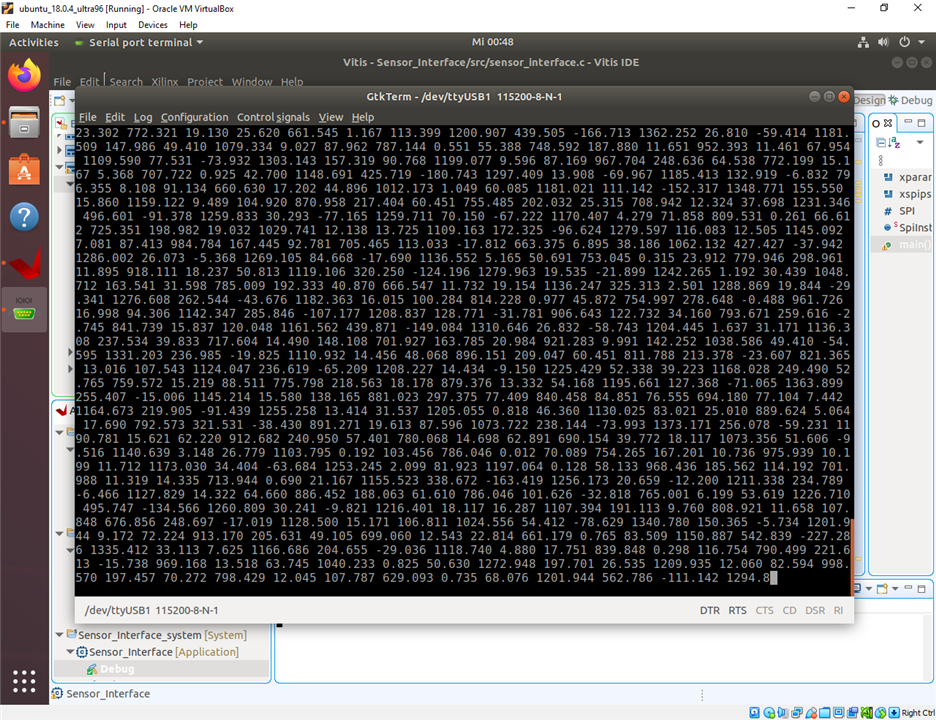
In the setup I used, the NanoEdge AI studio receives signal data on the serial port from the Nucleo board acting as a data logger. The board must provide sets of 1024 data, each data being a triple of accelerations, one for each axis as we can see below:
accx0 accy0 accz0 accx1 accy1 accz1 ....accx1023 accy1023 accz1023
accx0 accy0 accz0 accx1 accy1 accz1 ....accx1023 accy1023 accz1023
:
As we can see, values are separated by spaces, and each set is on a new line.
What I had to modify in my code was to eliminate data labels (ex. salx ..), provide a space between printed values and, using an index variable (idx) to determine the moment when the CR+LF should be provided in order to have the next set of 1024 data sets on the new line. And of course, computing first the value of accelerations using the configured sensitivity.
Here we can see a screenshot of data received in the terminal.
Because I lacked the time and did not have at this moment access to the experimental platform (motor + PC + NanoEdge AI), but only remotely to the PC running NanoEdge AI, I connected to the PC and I used an already-existent configuration in NanoEdge AI and just experiment the logging and loading saved data into NanoEdge AI.
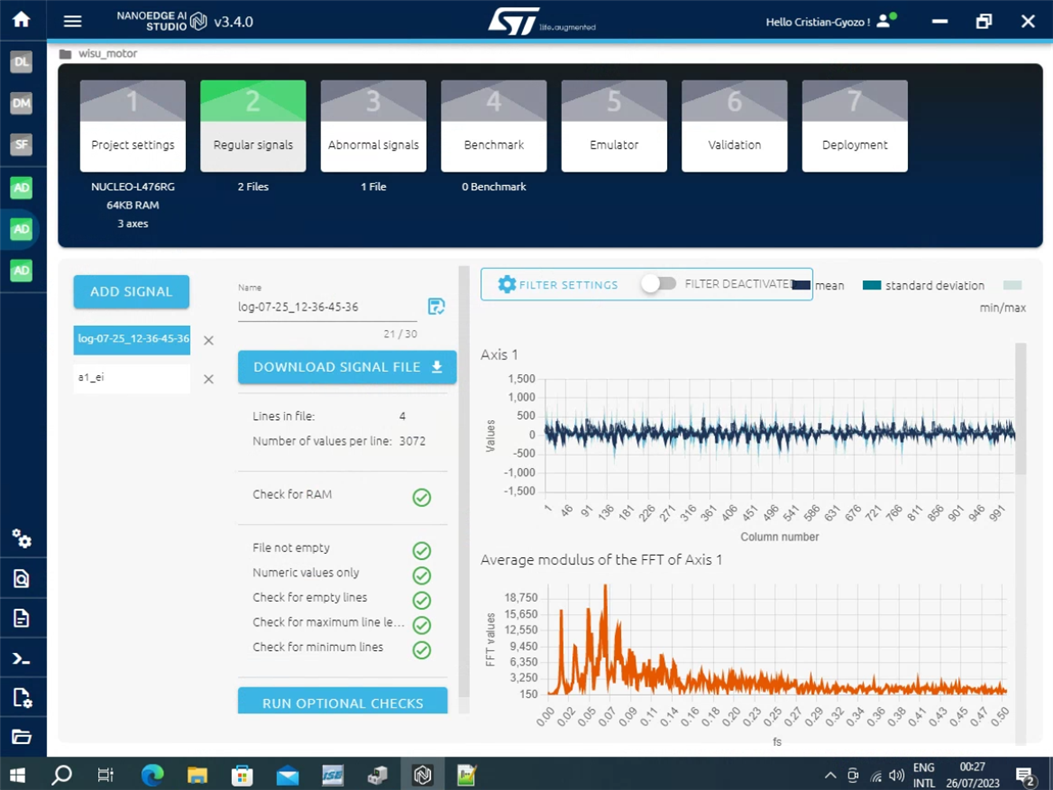
NanoEdge AI offers the possibility to input data (normal and abnormal signals) directly using the serial port or uploading them from files where they were saved before.
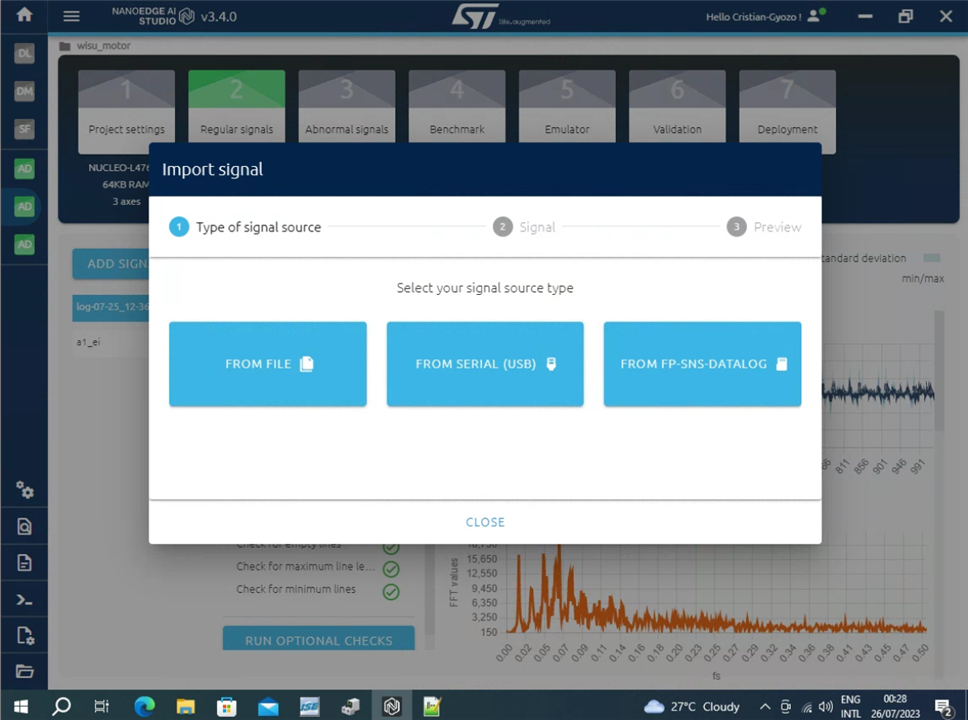
In this experiment, I have logged data sent from the Ultra96 board in a file and I used the Load file option to include the recorded data into NanoEdge AI.
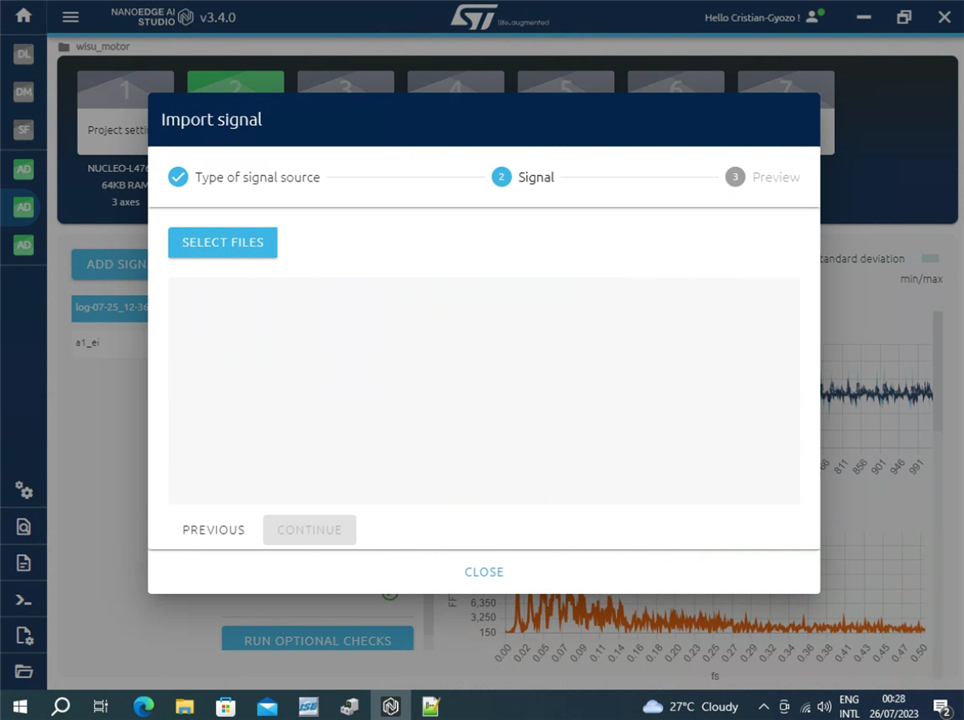
I had to select the file where data were logged (not to forget that the log file had to be moved from VM (where it was saved by GTK terminal) to the host PC and from the host PC to the remote PC running NanoEdge AI).
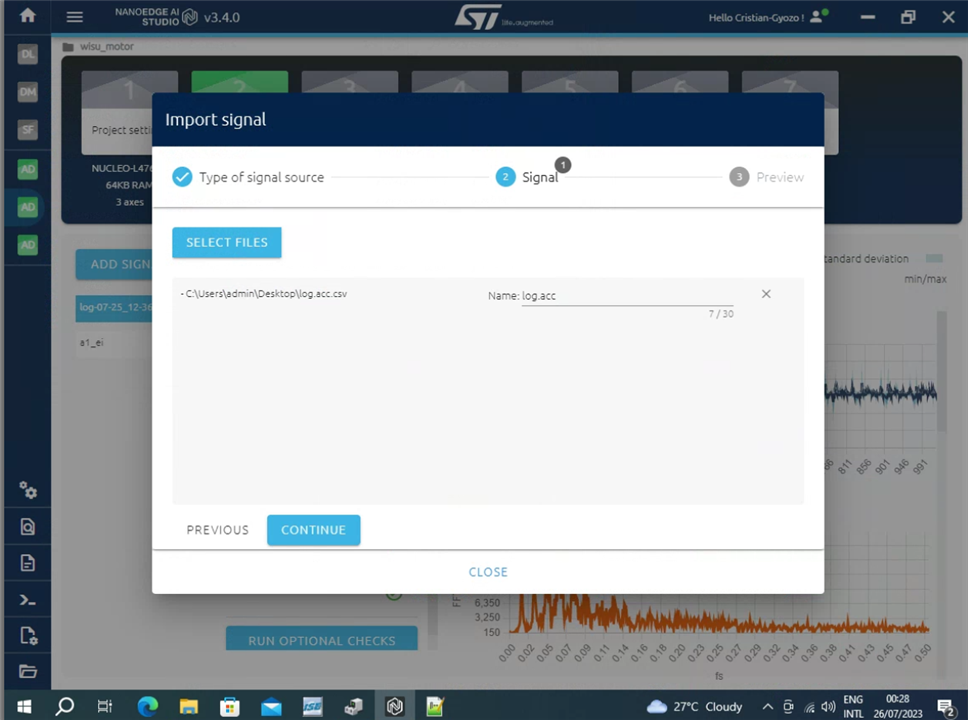
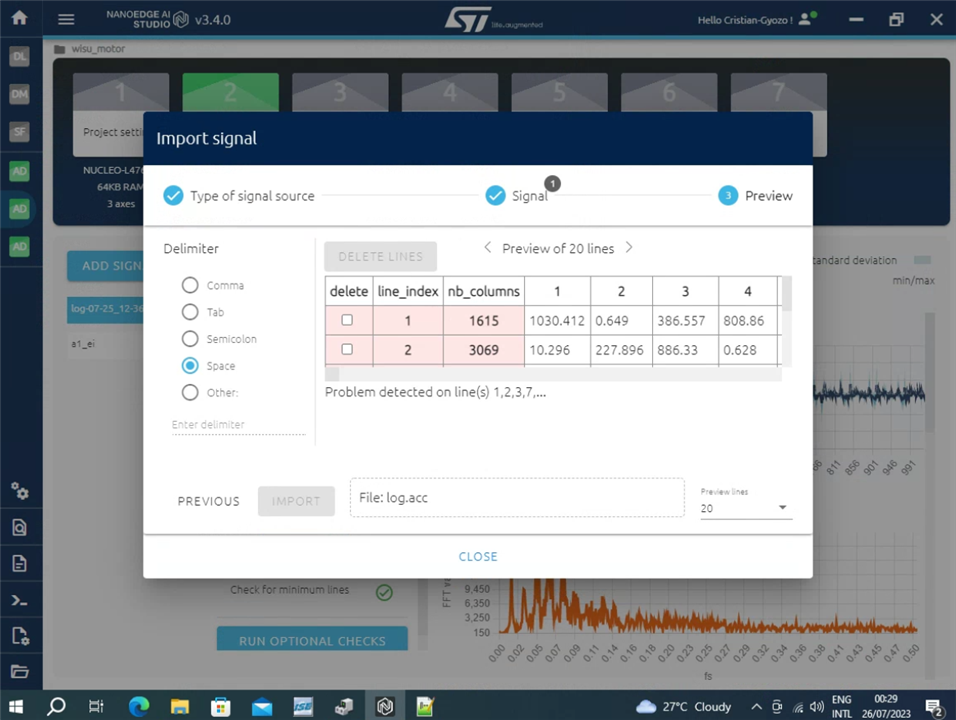
We can see the imported data presented in a tabular form but also the problem that some of the data sets do not have the proper size (first two rows). This is because of the moment the logging was started and as we can see further, because of the moment the logging was stopped.
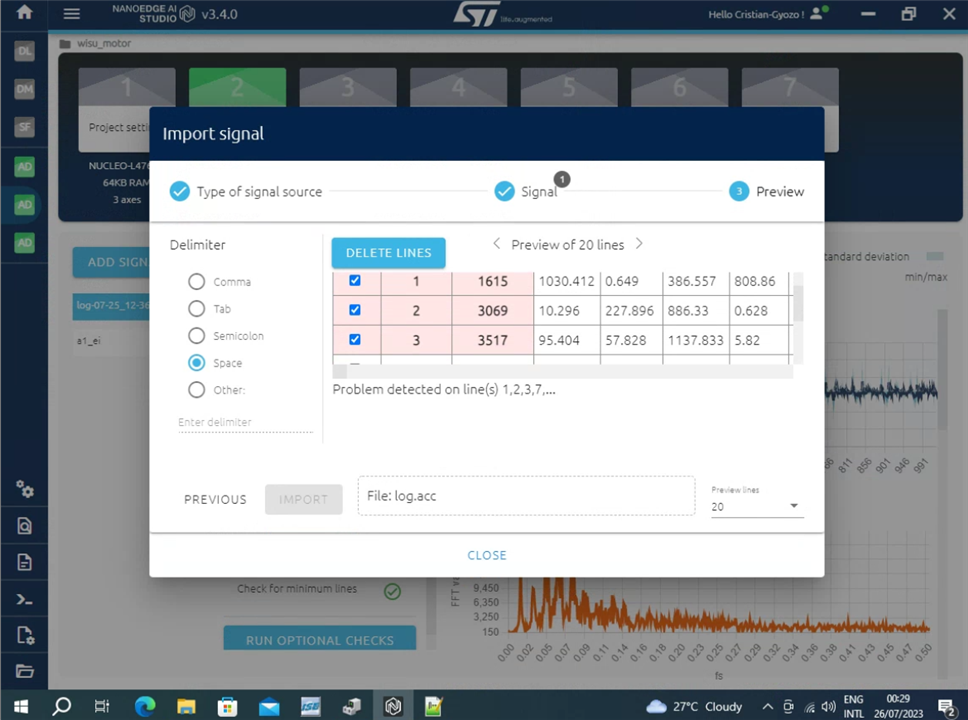
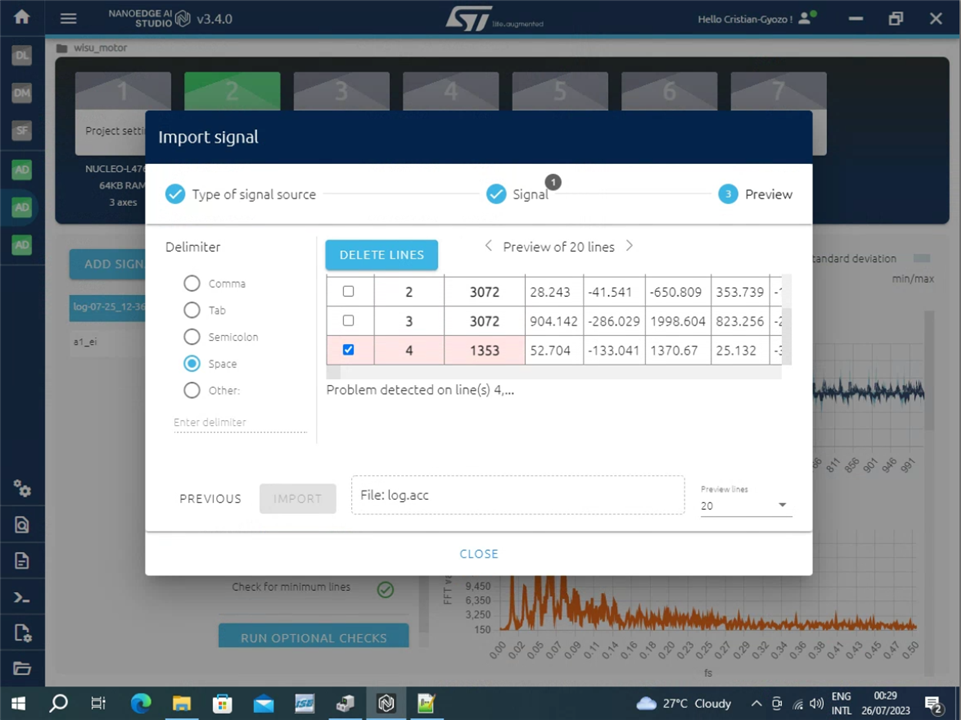
The rows with problems were selected and deleted, therefore, remained only 3 sets of data (each set having 1024 x 3= 3072 values).
These 3 sets were imported and the NanoEdge AI platform displays them in graphical form in order to be inspected. The values have been split so we can see the variation of acceleration on each of the three axes.
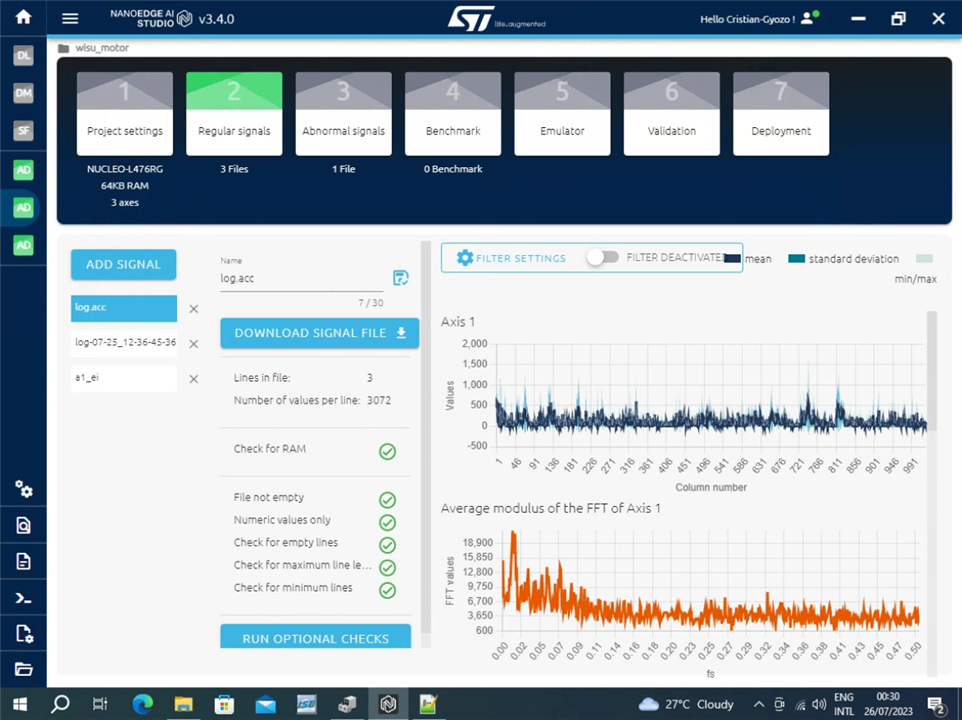
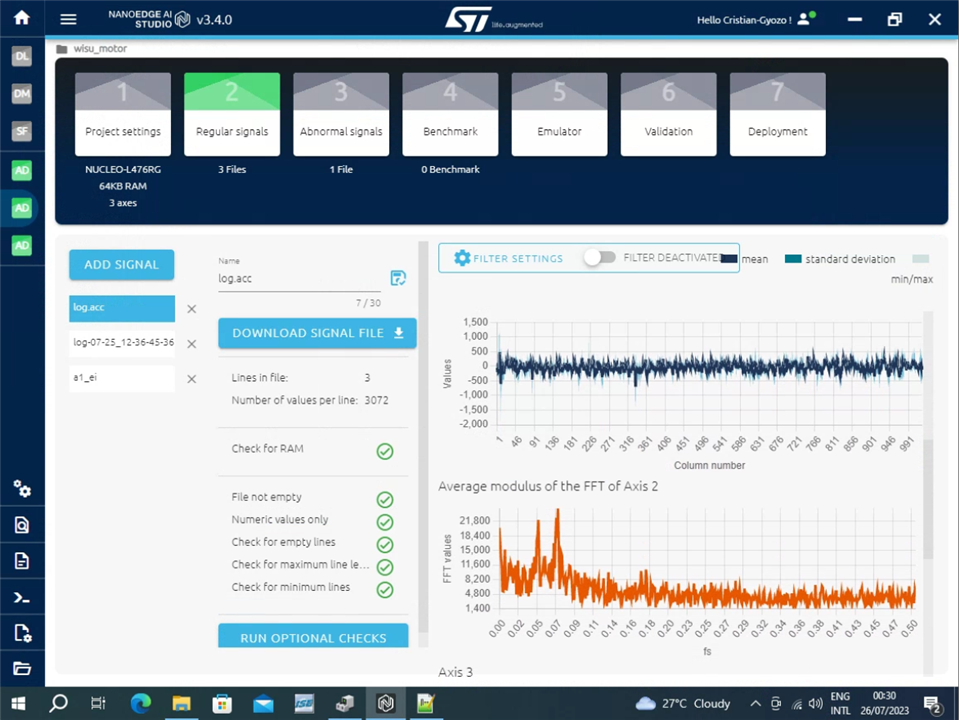
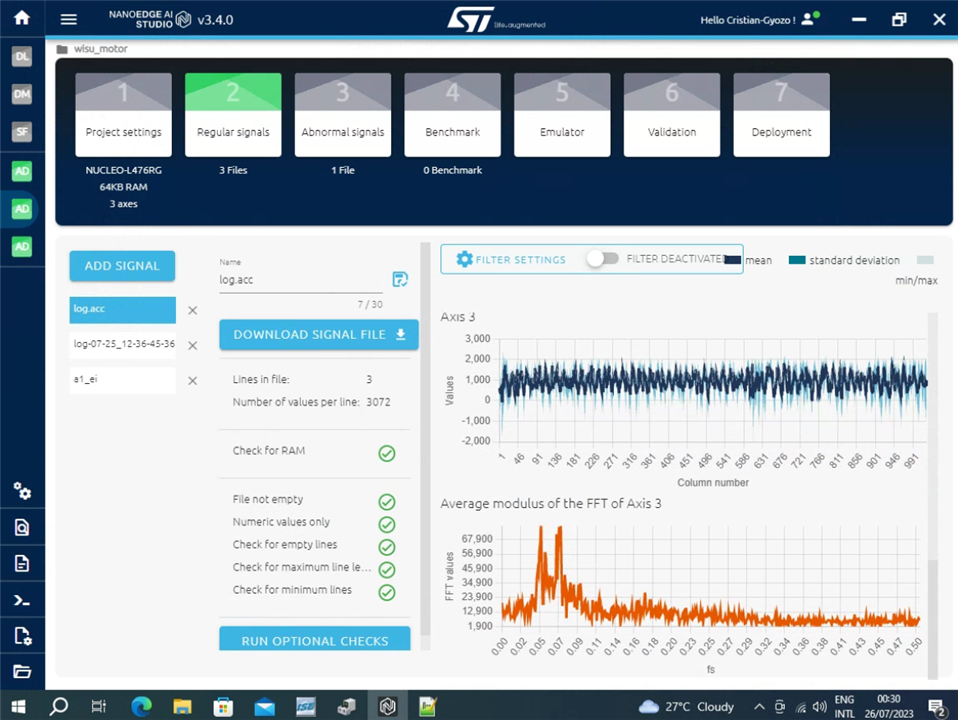
The conclusion is that we can use Ultra96 + MIKROE-2731, LSM6DSL Click board can be used as a data logger for data from the accelerometer, gyroscope, and temperature sensors but, it is not recommended to be used only to do this work.
