There are only a couple of weeks left in this challenge, so we've entered the home stretch.
I've made some changes to what I display on the Node-Red Project dashboard.
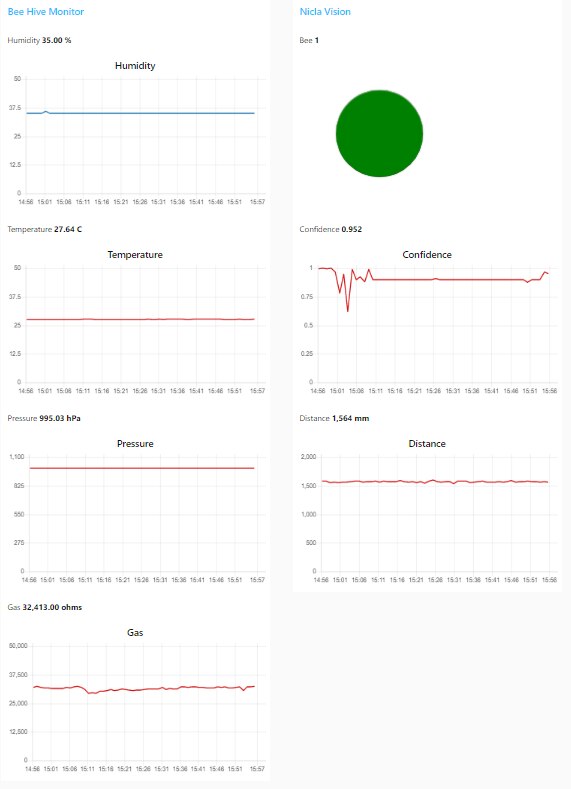
To the Bee Hive Monitor group that displays the internal hive environment I've added the Pressure and Gas readings in addition to Humidity and Temperature.
To the Nicla Vision group I added the inference output of the sound classification model (Bee or No Bee) and a chart of the confidence in that inference in addition to the Proximity measurement..
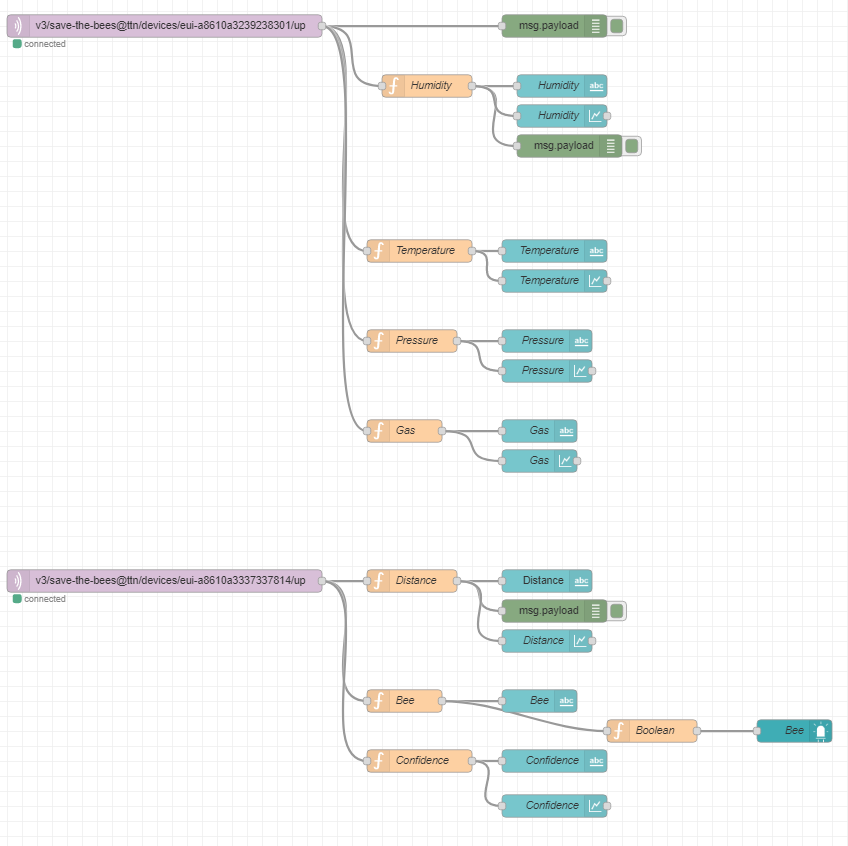
These changes required updating the firmware on all 4 of the boards and the Things project payload decoders in addition to the Node-Red flows.
Here is the updated flow for the two module groups:

And here's the layout in the UI. I'm displaying the inference result as a large "LED" with green for Bee detected and Red for No Bee. I'm also plotting the confidence in the inference result.

I am uploading data from the two modules at 1 minute intervals which is faster than required for the environment data, but too slow for live classification using a model that is sampling every 2 seconds. I am currently rethinking how to report the classification results and will probably rework the code one more time. It probably makes more sense to report the number of detections within each upload interval and an average confidence level. That will give me a better idea of the true bee activity level.
This video is of the current implementation which is reporting the data point just prior to each upload. So, it might be misleading due to the undersampling of the inference data.
Hopefully, I'll have everything finished up in about a week and can try deploying the system outdoors on a mock bee hive. I'll keep my fingers crossed that we'll get some sunny days...
