In my last blog I did successful OCR of a multimeter reading using Raspberry Pi 4. In this blog I will show you how you can upload the OCR data to cloud for your IoT application. Sending data to cloud is very important for any IoT application. So, I doing here how this can be dome automatically and I am going to use very popular MQTT protocol. After sending the data to the cloud the next step is to visualize the data. I will show here how we can use our Raspberry Pi and Node-RED to visualize the data easily. So, keep reading.
A brief about MQTT
MQTT stands for Message Queuing Telemetry Transport is a simple lightweight messaging protocol created by IBM in 1999. It was primarily designed to create a reliable machine-to-machine (m2m) communication. Now, it becomes the most popular messaging protocol in IoT application for device to cloud and device to device communication. It is hugely adopted in most of the home automation system. Now-a-days almost all cloud service support MQTT.
We use "client and server" communication technique for serving internet content, where browser act as a client and the content is on the server. Unlike client-server, MQTT is a "client and broker" communication technique. In MQTT the clients (more accurately the devices) don't send messages directly to each other but instead communicate through a MQTT broker. The device sends the data is called publisher and the receiving device is called subscriber. If two devices want to communicate to each other they become connected to a common broker through a common channel called topic. The word topic refers to an alphanumeric string that the broker uses to filter messages for each connected client. The topic consists of one or more topic levels. Each topic level is separated by a forward slash (topic level separator). For example "myhome/kitchen/temp" is a valid MQTT topic. Messages are published by things using a topic. When a thing subscribes to a specific topic that device receives the message instantly if otherdevice publish a message in that topic. Any device can publish to one or more topic and at the same time it can subscribe to one or more topic. So, it is a bidirectional multi-device communication protocol. MQTT broker takes care of the security, connectivity, authentication, message delivery and message storage. For learning more about MQTT protocol visit hivemq.com/mqtt-protocol.
Above section explained the basic of MQTT but as a maker you may ask, how do we actually use it in device. Every MQTT broker has an address (e.g. test.mosquitto.org) and a port number (e.g. 1883). We use an address and a port number of a broker to set them on the IoT device to connect to that specific broker. For a secure connection you may also need to use username and password. For publishing a message you then create and use a topic in the program. The device wants to receive that message must subscribe to this specific topic.
Communicating with MQTT broker from Raspberry Pi
So, now we have the basic knowledge about MQTT communication and MQTT broker. There are few test brokers are available for maker and lets use one of them for our project. For communicating with a broker or in other words for sending or receiving data from a broker from any IoT device we will be required a client tool for that device. As we are going to send the OCR data from our Raspberry Pi we need a MQTT client for the Raspberry Pi. The paho MQTT python client from Eclipse is possibly the most popular MQTT client among hobbyist and maker community. The Paho Python Client provides a client class with support for MQTT v5.0, MQTT v3.1.1, and v3.1 on Python 2.7 or 3.x. It also provides some helper functions to make publishing one off messages to an MQTT server very straightforward.
Installing paho to Raspberry Pi
For installing paho MQTT client to your raspberry pi just type the following command from the terminal. Within few seconds it will be installed in your pi.
pip3 install paho-mqtt
You will get the following response from the terminal if it installed successfully.

If you face any difficulties on installing paho please visit this site: https://pypi.org/project/paho-mqtt/
After installing paho the next step is to choose a MQTT broker for our communication. There are several options for obtaining an MQTT broker. You can setup your own MQTT broker like Mosquitto MQTT broker, you can use fully managed cloud service like AWS IoT or you can use a free public MQTT broker is exclusively available for those who wish to learn and test the MQTT protocol.
For this project, we will use the free public MQTT broker at broker.emqx.io.
This is the sample code available on official paho website for testing the mqtt setup:
import paho.mqtt.client as mqtt

# The callback for when the client receives a CONNACK response from the server.
def on_connect(client, userdata, flags, rc):
    print("Connected with result code "+str(rc))

    # Subscribing in on_connect() means that if we lose the connection and
    # reconnect then subscriptions will be renewed.
    client.subscribe("$SYS/#")

# The callback for when a PUBLISH message is received from the server.
def on_message(client, userdata, msg):
    print(msg.topic+" "+str(msg.payload))

client = mqtt.Client()
client.on_connect = on_connect
client.on_message = on_message

client.connect("broker.emqx.io", 1883, 60)

# Blocking call that processes network traffic, dispatches callbacks and
# handles reconnecting.
# Other loop*() functions are available that give a threaded interface and a
# manual interface.
client.loop_forever()
I have slightly modified the code for testing on my Raspberry Pi. This is the modified code:
import paho.mqtt.client as mqtt
import time

def on_connect(client, userdata, flags, rc):
    print(f"Connected with result code {rc}")

    # Send a message to the raspberry/topic every 1 second, 5 times in a row
    for i in range(5):
        # The four parameters are topic, sending content, QoS and whether retaining the message respectively
        client.publish('raspberry/topic', payload=i, qos=0, retain=False)
        print(f"send {i} to raspberry/topic")

client = mqtt.Client()
client.on_connect = on_connect
client.connect("broker.emqx.io", 1883, 60)

client.loop_start()


while True:
    try:
        rc,_= client.publish("rpi/temperature", "Hello mqtt", retain=False)
        print("Publish")
        if rc != 0:
            print("Publish error: {}".format(paho.error_string(rc)))

    except Exception as error:
        client.loop_stop()
        raise error

    time.sleep(5)
For testing the MQTT communication MQTTX is an excellent tool. You can download MQTTX from here and install in your host PC for testing. Now run the above code in your raspberry pi and test it from MQTTX either the broker is receiving the message from pi or not. Here is my raspberry pi terminal where I run the example code for testing. My code run successfully and publishing 'Hello mqtt' message every five seconds. The test topic I have chosen for publishing data is 'rpi/temperature'. You can choose any topic you like.
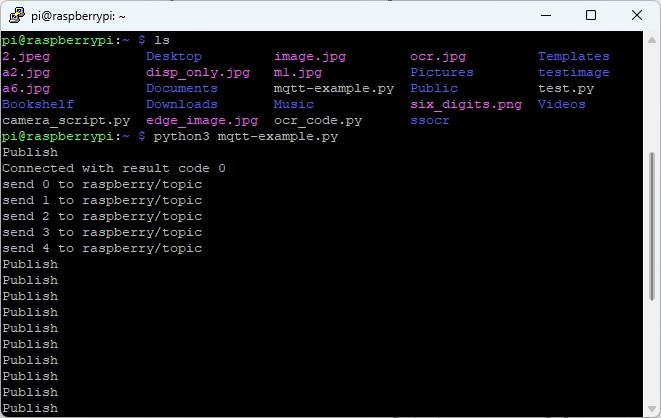
I tested the communication using MQTTX and the screenshot of the tool is given below. Here, I subscribed 'rpi/temperature' from emqx after connecting to the broker and from the image it is clear that I am receiving same message that is publishing from Pi.
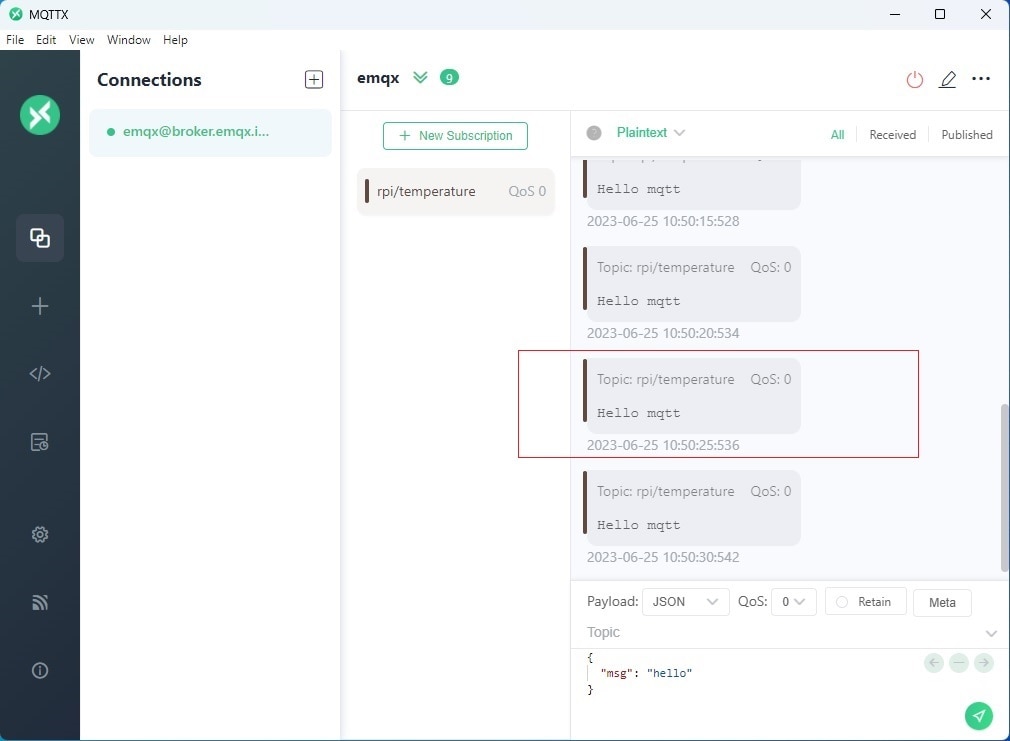
So, my everything is working perfectly. Now I will add this mqtt functionality to my main OCR code so that I can publish the multimeter reading to cloud (mqtt broker) instantly.
Sending Multimeter Reading to Cloud
So, I am going to add the MQTT code to the main ocr_code that I shared in the previous blog. I have changed the topic from 'rpi/temperature' to 'rpi/voltage' as I am going to send the voltage reading from the multimeter. The final code with the cloud upload functionality is as below:
import os
import re
import cv2
import PIL
import imutils
import numpy as np
from time import sleep
from skimage import exposure
from picamera import PiCamera
from pytesseract import image_to_string

import paho.mqtt.client as mqtt
import time

from gpiozero import Button
button_ssocr = Button(3)
button_tesseract = Button(2)

'''this function is for taking image using raspberry pi camera'''
def take_picture(should_save=False):
  '''
  camera = PiCamera()
  camera.start_preview() #preview function only works when monitor connected
  sleep(10) #stabilize camera
  camera.capture('/home/pi/image.jpg')
  camera.stop_preview()
  '''
  sleep(1)
  os.system("raspistill -o /home/pi/image.jpg -w 400 -h 300")
  img = cv2.imread('/home/pi/image.jpg')
  return img

'''This function conver an image to grayscale, blur the image and detect edge'''
def cnvt_edged_image(img_arr, should_save=True):
  image = imutils.resize(img_arr,height=300)
  gray_image = cv2.bilateralFilter(cv2.cvtColor(image, cv2.COLOR_BGR2GRAY),11, 13, 15) #may need to adjust the value
  edged_image = cv2.Canny(gray_image, 30, 200)

  if should_save:
    cv2.imwrite('/home/pi/edge_image.jpg', edged_image)

  return edged_image

'''find display contour, image passed in must be ran through the cnv_edge_image first'''
def find_display_contour(edge_img_arr):
  display_contour = None
  edge_copy = edge_img_arr.copy()
  contours,hierarchy = cv2.findContours(edge_copy, cv2.RETR_TREE, cv2.CHAIN_APPROX_SIMPLE)
  top_cntrs = sorted(contours, key = cv2.contourArea, reverse = True)[:10] #short 10 bigest contour

  for cntr in top_cntrs:
    peri = cv2.arcLength(cntr,True)
    approx = cv2.approxPolyDP(cntr, 0.04 * peri, True)

    if len(approx) == 4:
      display_contour = approx
      break

  return display_contour

'''crop the display contour from the image'''
def crop_display(image_arr):
  edge_image = cnvt_edged_image(image_arr)
  display_contour = find_display_contour(edge_image)
  cntr_pts = display_contour.reshape(4,2)
  return cntr_pts


def normalize_contrs(img,cntr_pts):
  ratio = img.shape[0] / 300.0
  norm_pts = np.zeros((4,2), dtype="float32")

  s = cntr_pts.sum(axis=1)
  norm_pts[0] = cntr_pts[np.argmin(s)]
  norm_pts[2] = cntr_pts[np.argmax(s)]

  d = np.diff(cntr_pts,axis=1)
  norm_pts[1] = cntr_pts[np.argmin(d)]
  norm_pts[3] = cntr_pts[np.argmax(d)]

  norm_pts *= ratio

  (top_left, top_right, bottom_right, bottom_left) = norm_pts

  width1 = np.sqrt(((bottom_right[0] - bottom_left[0]) ** 2) + ((bottom_right[1] - bottom_left[1]) ** 2))
  width2 = np.sqrt(((top_right[0] - top_left[0]) ** 2) + ((top_right[1] - top_left[1]) ** 2))
  height1 = np.sqrt(((top_right[0] - bottom_right[0]) ** 2) + ((top_right[1] - bottom_right[1]) ** 2))
  height2 = np.sqrt(((top_left[0] - bottom_left[0]) ** 2) + ((top_left[1] - bottom_left[1]) ** 2))

  max_width = max(int(width1), int(width2))
  max_height = max(int(height1), int(height2))

  dst = np.array([[0,0], [max_width -1, 0],[max_width -1, max_height -1],[0, max_height-1]], dtype="float32")
  persp_matrix = cv2.getPerspectiveTransform(norm_pts,dst)
  return cv2.warpPerspective(img,persp_matrix,(max_width,max_height))

def crop_display_image(orig_image_arr):
  ratio = orig_image_arr.shape[0] / 300.0

  display_image_arr = normalize_contrs(orig_image_arr,crop_display(orig_image_arr))
  #display image is now segmented.
  gry_disp_arr = cv2.cvtColor(display_image_arr, cv2.COLOR_BGR2GRAY)
  gry_disp_arr = exposure.rescale_intensity(gry_disp_arr, out_range= (0,255))

  #thresholding
  ret, thresh = cv2.threshold(gry_disp_arr,127,255,cv2.THRESH_BINARY) #may need to adjust the value
  cv2.imwrite('/home/pi/disp_only.jpg', thresh)
  return thresh

def ssocr_image():
  import subprocess
  ocr_value = subprocess.getoutput("/home/pi/ssocr/ssocr -T -d -1 /home/pi/disp_only.jpg")
  value = str(ocr_value)
  processed_data = process_ocr_data(value)
  return processed_data

def tesseract_image():
  disp_img = cv2.imread('/home/pi/disp_only.jpg')
  #value = image_to_string(disp_img, lang="7seg") #pretrained seven segment model
  #value = image_to_string(disp_img, lang="ssd")
  #value = image_to_string(disp_img, lang="letsgodigital")
  ocr_value = image_to_string(disp_img)
  value = str(ocr_value)
  processed_data = process_ocr_data(value)
  return processed_data

'''remove any unexpected character if has with the value'''
def process_ocr_data(ocr_output):
  try:
    value = re.findall("\d+\.\d+", ocr_output) #value is float
    if len(value) == 0:
      value = re.findall("\d+", ocr_output) #if value is integer
      return value[0]
    else:
      return value[0]
  except:
    print("Error on reading value:")
    return 0


def on_connect(client, userdata, flags, rc):
    print(f"Connected with result code {rc}")

    '''
    # Send a message to the raspberry/topic every 1 second, 5 times in a row
    for i in range(5):
        # The four parameters are topic, sending content, QoS and whether retaining the message respectively
        client.publish('raspberry/topic', payload=i, qos=0, retain=False)
        print(f"send {i} to raspberry/topic")
    '''
client = mqtt.Client()
client.on_connect = on_connect
client.connect("broker.emqx.io", 1883, 60)

client.loop_start()


while True:
  if button_ssocr.is_pressed:
    print("Ssocr button is pressed")
    img = take_picture()
    crop_display_image(img)
    ocr_value = ssocr_image()
    print('The Result: ', ocr_value)

    try:
        rc,_= client.publish("rpi/voltage", ocr_value, retain=False)
        print("Publish")
        if rc != 0:
            print("Publish error: {}".format(paho.error_string(rc)))

    except Exception as error:
        client.loop_stop()
        raise error

  elif button_tesseract.is_pressed:
    print("Tssseract button pressed")
    img = take_picture()
    crop_display_image(img)
    ocr_value = tesseract_image()
    print('The Result: ', ocr_value)

    try:
        rc,_= client.publish("rpi/voltage", ocr_value, retain=False)
        print("Publish")
        if rc != 0:
            print("Publish error: {}".format(paho.error_string(rc)))

    except Exception as error:
        client.loop_stop()
        raise error
After running the code you will get the following response from the terminal and the MQTTX. Both outputs have shown in a single image below.
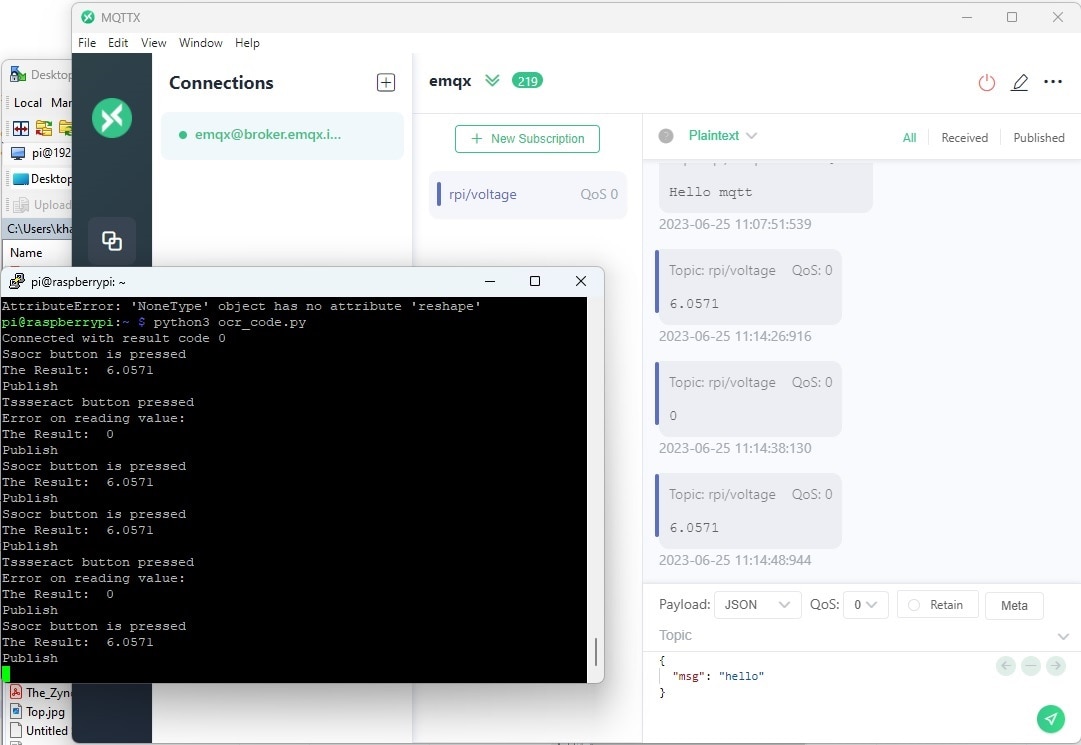
Ok, we was able to successfully upload the meter reading to cloud automatically with a single button press without any physical connection to the meter. In the next step I will show you how we can visualize that meter reading in a dashboard. Visualization is an important part of any IoT application. It is always advantageous to watch a data remotely and IoT made it easy fro us. In this blog I will explain how we can visualize the data using Node-RED.
A brief about Node-RED
Node-RED is a free and open source graphical programming tool primarily designed for the Internet of Things that allows programmers of any level to interconnect physical things, cloud-based systems, database, and APIs to build applications using a web interface and it requires very little, if any, programming knowledge.
With Node-RED we can easily design our own IoT system(s) through which sensors data flow. As the data flows through the system of connected nodes it triggers and performs actions defined by nodes. One can compare Node-RED to a typical water system. A water system may have various type of nodes such as valves, power generators, water heaters, pumps, fountains etc. so as the water flows it activates those nodes to change the water flow as well as water itself or to make some external actions out of the system.
So does Node-RED with the data. As the data flows through the system of connected nodes, it passes data in a sequence from one node to another. Each node acts on the data and performs some actions and passes it further. There are many types of nodes available which allow data to be: filtered; visualised on custom dashboards; stored in database/filesystem, sent as notifications such as email, Twitter etc. it literally gives us endless possibilities of what we can do to integrate the data flow with other software and internet services. Big advantage is we can set this system up in our local network without relying on the internet service providers.
Node-RED allows developer to connect predefined code blocks known as 'nodes' together to perform a task. The connected nodes usually a combination of input nodes, processing nodes and output nodes when wired together, make up an application program calls 'flow'. There are lots of nodes available to perform simple and complex tasks, including web access, Twitter, E-mail, HTTP, UDP, MQTT, controlling GPIO ports, making graphical dashboard, etc. With lots of built-in node you can also install third-party nodes, just like we install third-party libraries in Arduino. Beside visual capability Node-RED also allows you a lot of functional control (similar to custom functions in a text language) through JavaScript. JavaScript is the programming language that is underlying Node-RED.
Visualizing Meter Reading in a Dashboard
Before working with Node-RED first we need to install the Node-RED to our Raspberry Pi.
Installing Node-RED on Raspberry Pi
You can find the most up-to-date official instructions how to install Node-RED on RPi here: https://nodered.org/docs/getting-started/raspberrypi
You can install Node-RED by running the following command in the terminal. This command will download and run a script provided by Node-RED authority to install Node.js, npm and Node-RED onto a Raspberry Pi.
bash <(curl -sL https://raw.githubusercontent.com/node-red/linux-installers/master/deb/update-nodejs-and-nodered)
The npm stand for node package manager and is incredibly useful for the javascript programming language that Node-RED is built on. Using npm you will be able to install additional modules for use with Node-RED.
Before the script begins to run you will ask two questions. Just type 'y' and press ENTER for both to continue. After successful installation you will see following confirmation from the terminal:
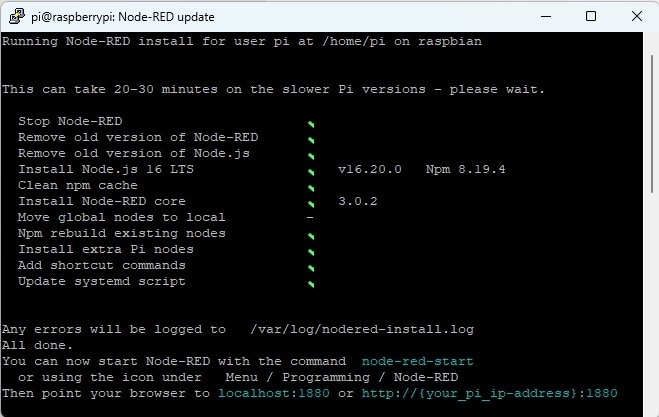
After installing the Node-RED you need to start it. There are different ways to start the Node-RED but the easiest is to run the following command:
node-red-start
Below is the terminal response after running the above command.

Now, you can open the Node-RED web editor by going to the following URL in your favorite web browser from any computer/phone connected to same network as the Pi.
http://{your_pi_ip-address}:1880
In order to get the ip of your RPi use this command:
hostname -I
If everything works correctly, you should now be greeted by the screen shown in below:
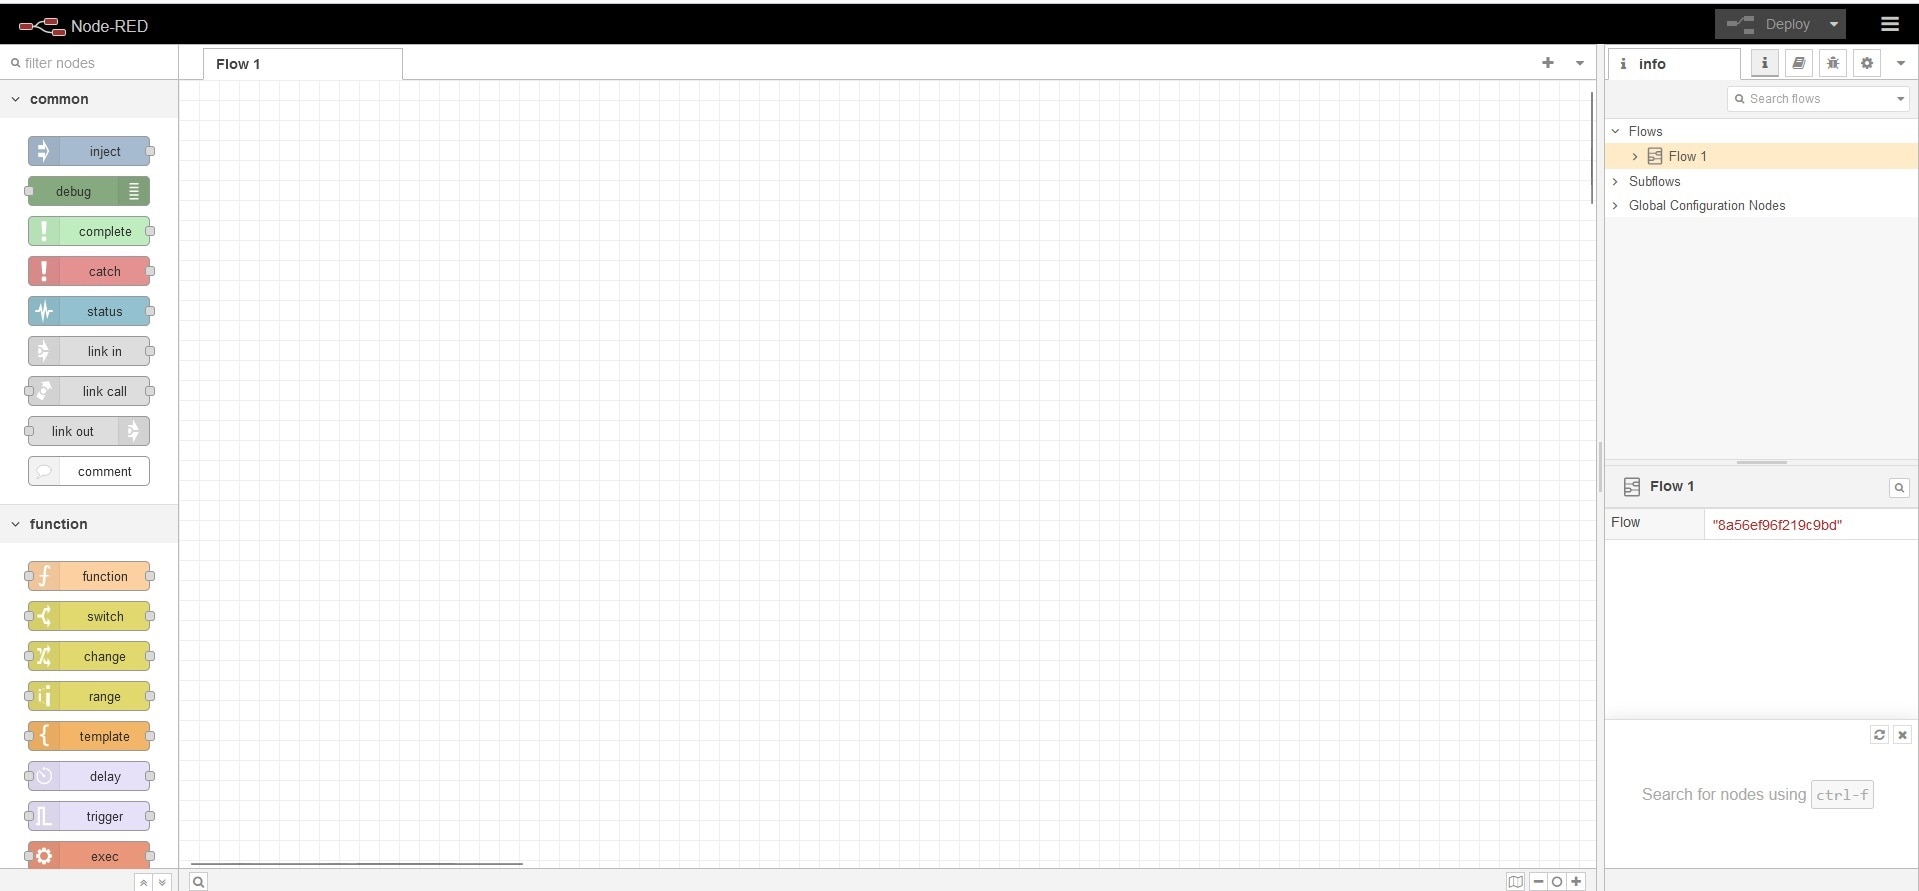
Getting started with Node-RED
Great we have got the Node-RED up and running. Now let's get start with a very simple example before going to our main project. As we already discussed, the program we create using Node-RED is called flow and we wire multiple nodes together to create a flow. There are three main types of nodes:
- Input Nodes (e.g. inject)
- Processing Nodes (e.g. function)
- Output Nodes (e.g. debug)
Three example nodes are shown below:
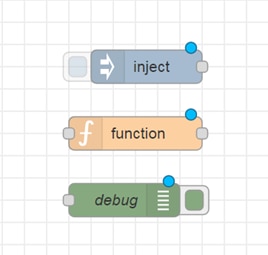
Input nodes allow you to input data into a Node-RED program or flow. They have at least one output endpoint represented by small grey square on their right side. Output nodes are used to send data outside and have a single endpoint on their right side. Processing nodes allow us to process data. They have an input endpoint and one or more output endpoints. In a Node-RED flow messages pass between nodes, moving from input nodes through processing nodes to output nodes.
Let's build a 'Hello World' flow and you will see how simple it is to use the Node-RED UI to build and deploy a flow. We will use an inject node to input some information into the flow, wired to a debug node to see the output from the flow as a debug message.
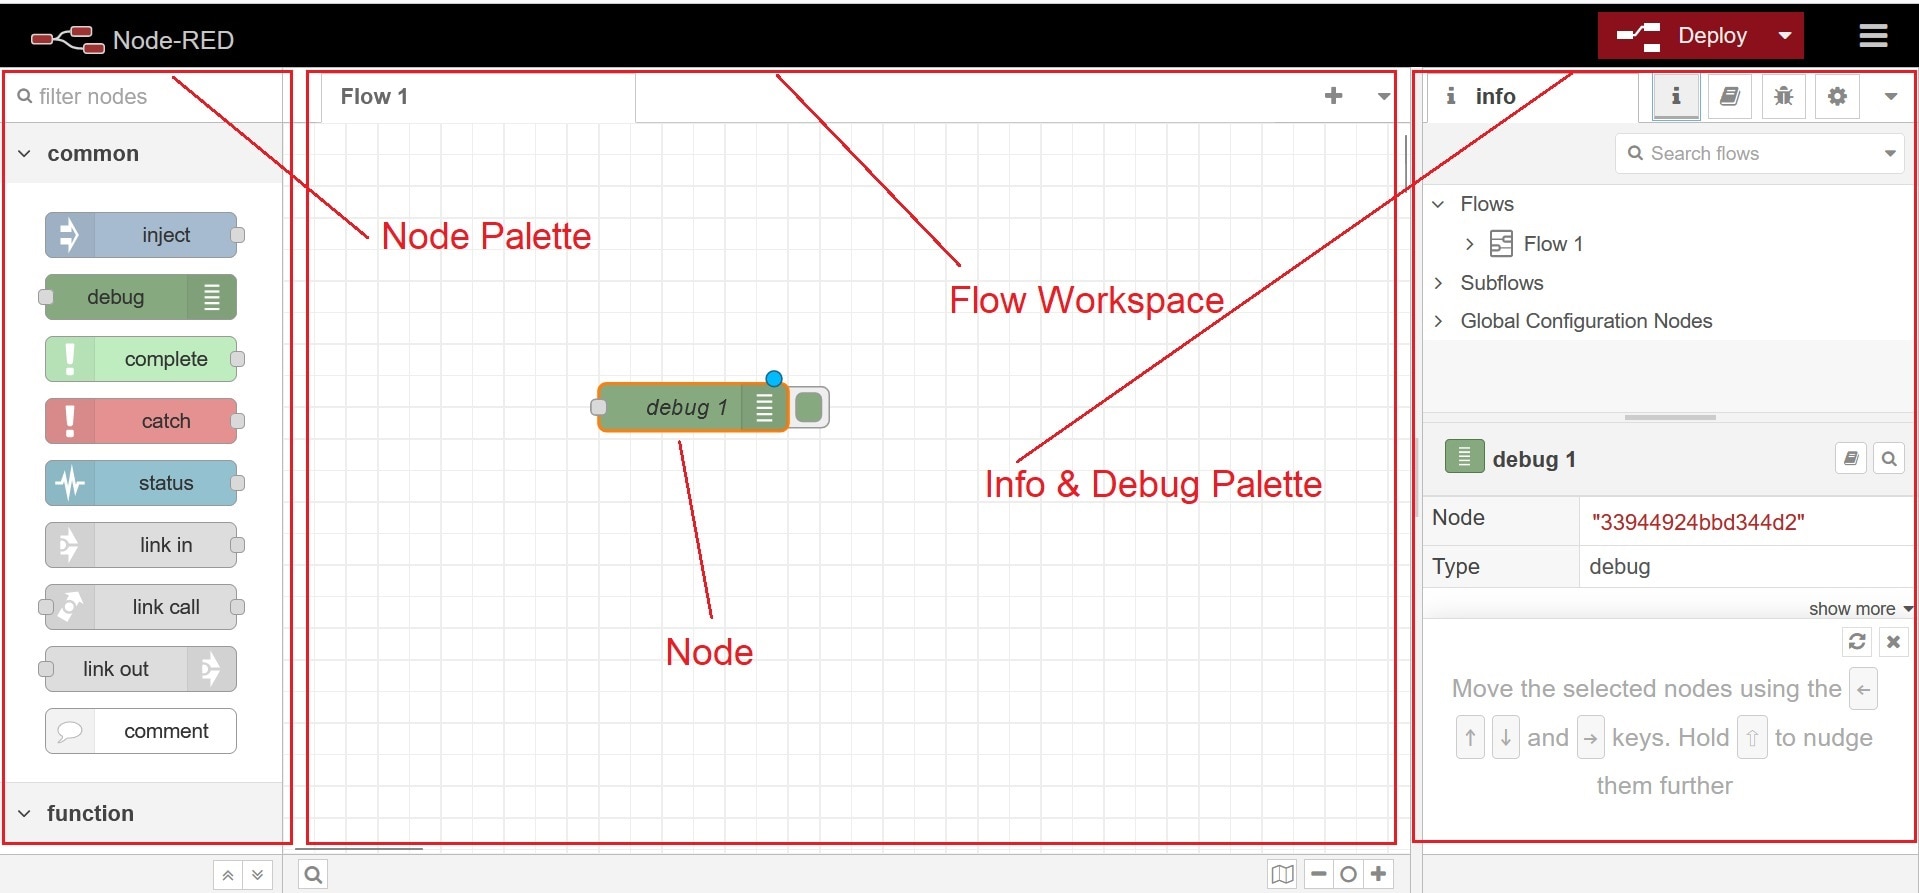
Since this is the first time we are going to build a flow, let's start slowly and explain each step with a screen-shot. Our first node will be the inject node. The inject node is used to generate input into a flow and is one of the first node in the node palette under input. Drag and drop an inject node into the flow workspace, and look at the info tab from the right, you will see the documentation for the node. Figure below shows the node palatte, workspace with added inject node and debug palatte. In the workspace inject node will be seen as timestamp as by default it inject a timestamp - the current time in milliseconds since January 1, 1970.
You will see a grey square right where we will attach wires that route output message to next node in the flow. To get sense the output from the inject node let's add a debug node by dragging from node palette to workspace. There are two nodes in the workspace and we need to wire these together. To do that, click on the grey output point for the inject node, holding the mouse button down, drag towards the debug node. An orange wire appears, which you can then attach to the grey input point on the debug node. The complete flow will look like figure below.

After completing the Hello World flow now we need to deploy the flow to see the output. Click the deploy button from the top right and you will see a pop-up saying the flow has been successfully deployed (see below).
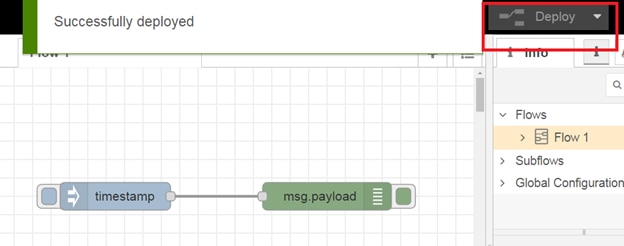
Now click on the left tab on the inject node and you will see the timestamp in the debug pane which is on the right side (see figure below).
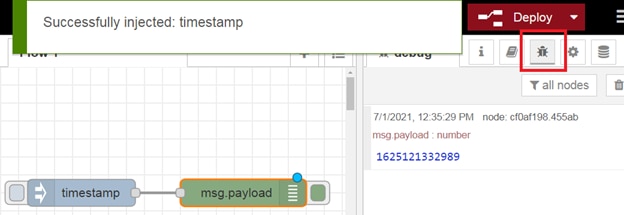
Congratulation, you created and deployed your first flow. We are ready to move on to the next step.
Our goal is to receive multimeter reading from Raspberry Pi using MQTT communication protocol and display the data to a graphical web dashboard. Node-RED will be used to receive MQTT data, make a graphical dashboard to display the result in real-time. So, let's start step by step.
Receiving MQTT message in Node-RED
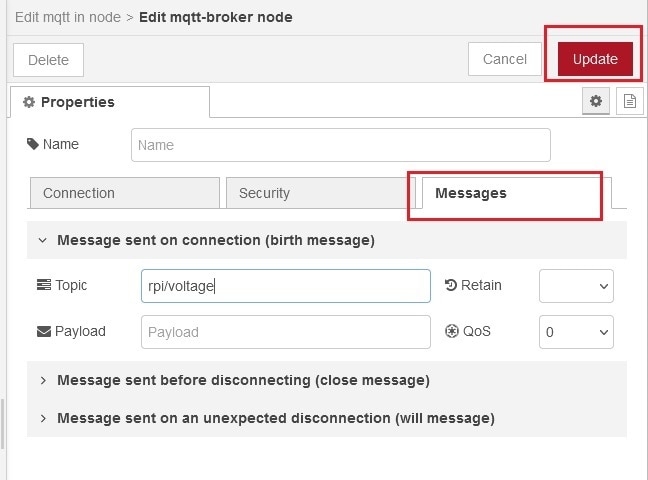
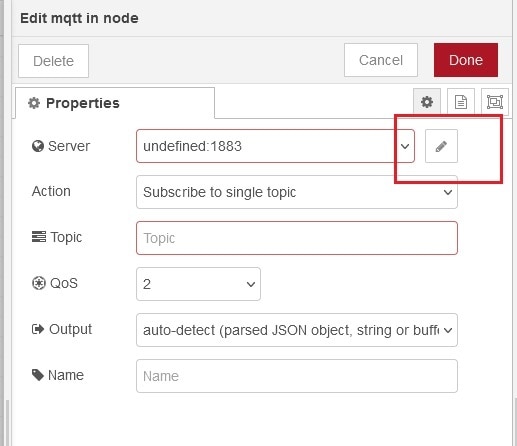
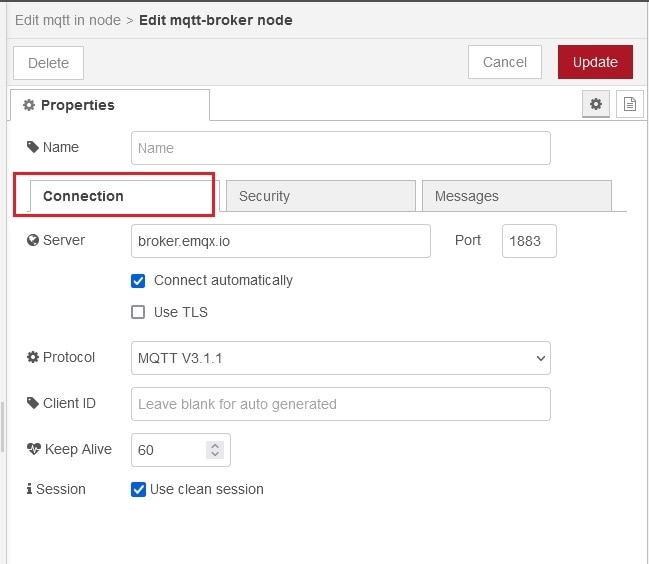
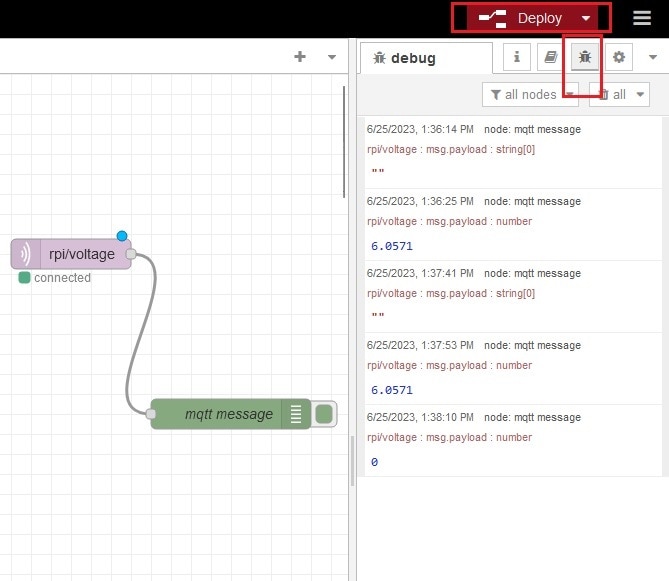
To receive mqtt message first, drag and drop an 'mqtt in' node and configure it for the mqtt broker. To configure double click on the node after dropping it into the workspace. Enter your topic in the topic field (e.g./# - for receiving all the messages, (pi/voltage- for voltage). I set the topic to receive the voltage here as shown in below to observe the MQTT data sent by Raspberry Pi.
 |
 |
|
To watch the received message from the mqtt broker we need a 'debug' node. So, add a debug node and wire it with the 'mqtt in node'. Deploy the flow. You will receive all the mqtt messages in every publish as shown in image below.
Creating a dashboard in Node-RED
It would be nice to have a nice UI instead of raw print out, wouldn't it? The good news is Node-RED allows to build a decent UI and we will use it to build a basic dashboard for our device to plot temperature data and show the battery status.
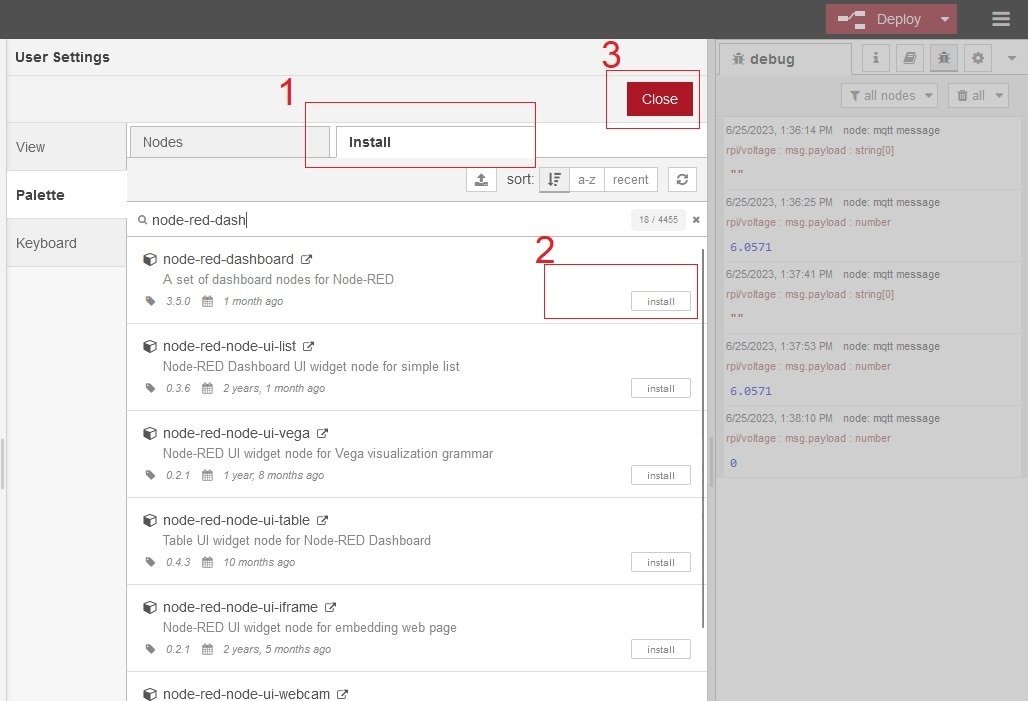
However there is one extra component called 'node-red-dashboard', which we have to install to Node-RED. In order to do that, click on the account icon from top right and select 'Manage palette' as shown in the figure below.

Go to the install tab, type for the 'node-red-dashboard' and click the install button as shown in figure below. Close the window when done.
Now we are ready to create a dashboard. We already know our device and exact topics it is sending out. We can precisely set topic for data we are interested in. We already added 'mqtt in' node and asign with the above topic.
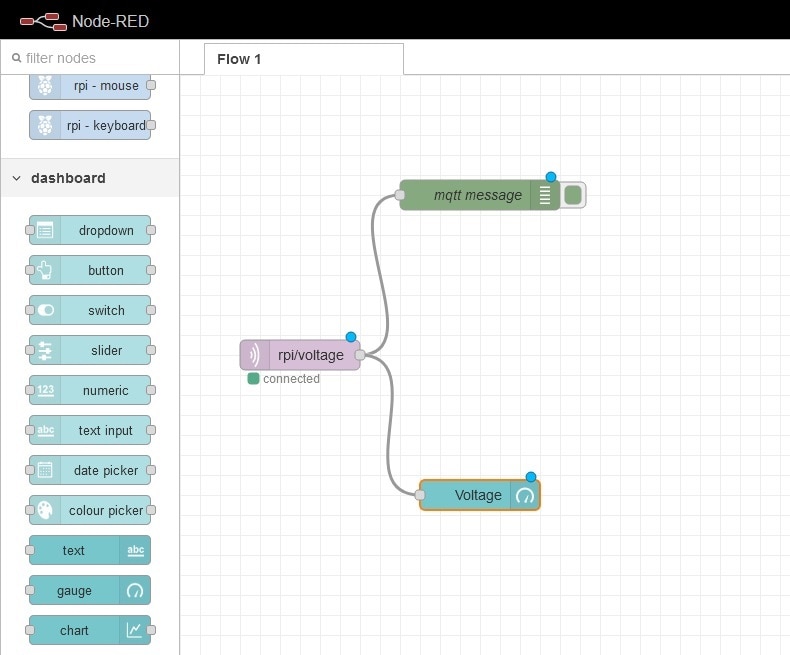
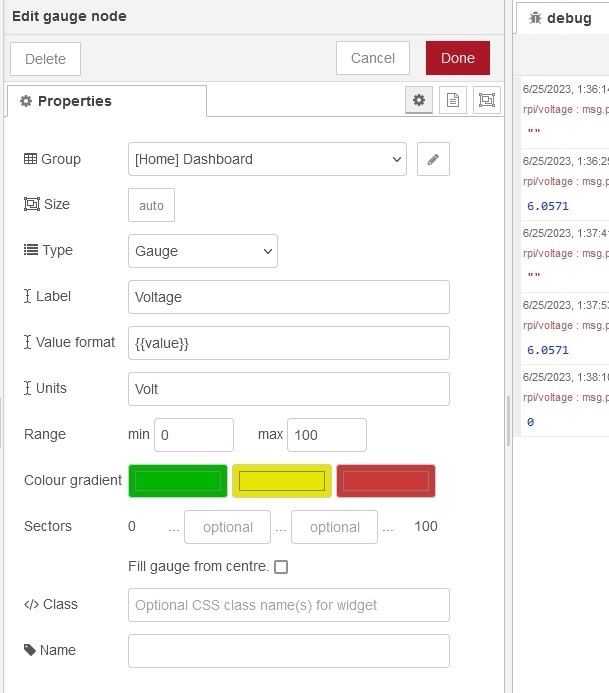
Now let add a 'gauge' node (for battery) from dashboard palette and connect it with the mqtt input. You need to assign a group for the gauge node. Double click on the nodes and assign 'Home' group with 'Dashboard' Tab for the node.
 |
 |
Now we are ready to deploy and open our dashboard by using the same link address as we used to open Node-RED editor. We only need to add '/ui' suffix at the end of the address. In our case the link looks as follows: http://192.168.1.103:1880/ui. After going to the address you will find the nice dashboard as shown in figure below.
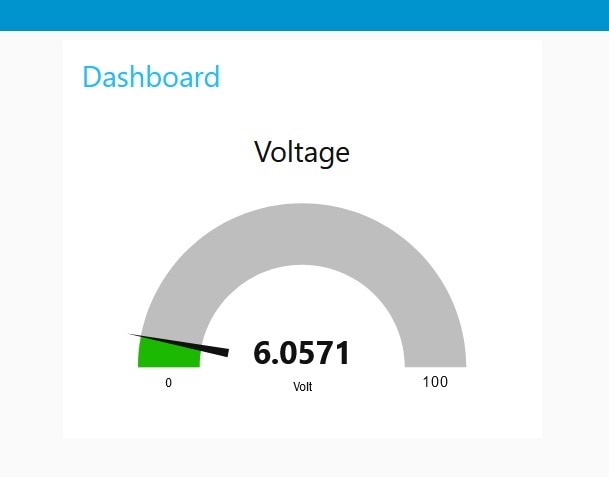
And this is the mobile view (see below):
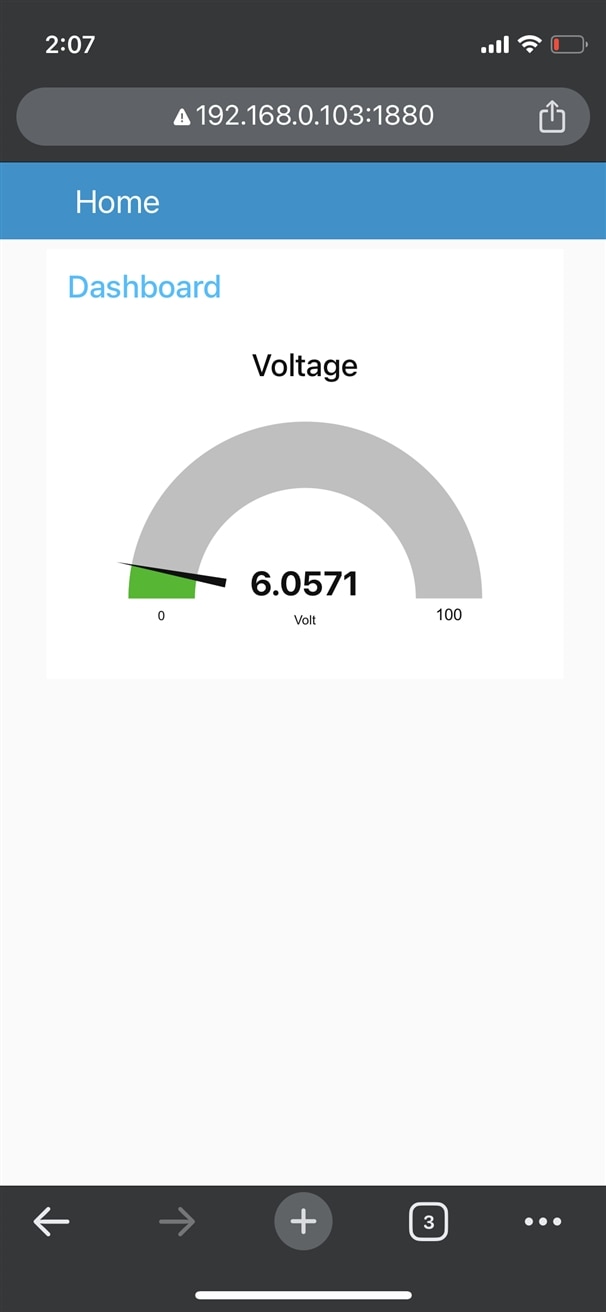
So, in this blog I successfully published the multimeter reading to MQTT broker and visualized it to a graphical dashboard. In my next and final blog I will summarize my works.


