


Web Interface
In this blog, I want to show you an improvement I added to my project, which is uploading sensor data to the web. I feel that having the data on the screen and the monitor connected to the Raspberry Pi is something simple, it could be done with an Arduino. That's why I set up a web server on the Raspberry Pi to create my own web API and receive and store the sensor data. I did this using the Flask framework.
Now, in addition to having the .py file, we also have an HTML file.
from flask import Flask, render_template, jsonify
import Adafruit_DHT
import random
from datetime import datetime

app = Flask(__name__)

sensor = Adafruit_DHT.DHT11
pin = 23

temperature_history = []
motion_sensor_state = False
flame_sensor_state = False
rain_sensor_state = False

@app.route('/data')
def get_sensor_data():
    humidity, temperature = Adafruit_DHT.read_retry(sensor, pin)
    data = {
        'temperature': temperature,
        'humidity': humidity
    }
    return jsonify(data)

def get_temperature():
    temperature = random.uniform(20, 30)
    return round(temperature, 2)

def get_humidity():
    humidity = random.uniform(40, 60)
    return round(humidity, 2)

def update_temperature_history(temperature):
    current_time = datetime.now().strftime("%H:%M:%S")
    temperature_history.append((temperature, current_time))

def get_motion_sensor_state():
    return random.choice([True, False])

def get_flame_sensor_state():
    return random.choice([True, False])

def get_rain_sensor_state():
    return random.choice([True, False])

@app.route('/')
def index():
    return render_template('index.html')

@app.route('/api/sensor-data')
def sensor_data():
    temperature = get_temperature()
    humidity = get_humidity()
    update_temperature_history(temperature)

    global motion_sensor_state, flame_sensor_state, rain_sensor_state
    motion_sensor_state = get_motion_sensor_state()
    flame_sensor_state = get_flame_sensor_state()
    rain_sensor_state = get_rain_sensor_state()

    return jsonify({
        'temperature': temperature,
        'humidity': humidity,
        'motion_sensor': motion_sensor_state,
        'flame_sensor': flame_sensor_state,
        'rain_sensor': rain_sensor_state
    })

@app.route('/api/temperature-history')
def temperature_history_data():
    return jsonify({'temperature_history': temperature_history})

@app.route('/graph')
def render_graph_page():
    return render_template('index.html')

if __name__ == '__main__':
    app.run(host='0.0.0.0', port=5000)
<!DOCTYPE html>
<html>
  <head>
    <title>Pi-Sense Web</title>
    <style>
      body {
        background-color: #001f3f;
        color: white;
        font-family: Arial, sans-serif;
      }
      .container {
        max-width: 600px;
        margin: 0 auto;
        padding: 20px;
      }
      .data-item {
        margin-bottom: 10px;
      }
      .data-item label {
        font-size: 16px;
        display: inline-block;
        width: 120px;
      }
      .data-item span {
        font-weight: bold;
        margin-left: 10px;
      }
      .graph-container {
        margin-top: 20px;
      }
    </style>
  </head>
  <body>
    <div class="container">
      <div class="data-item">
        <label>Temperature:</label>
        <span id="temperature"></span>
      </div>
      <div class="data-item">
        <label>Humidity:</label>
        <span id="humidity"></span>
      </div>
      <div class="data-item">
        <label>Motion:</label>
        <span id="motion"></span>
      </div>
      <div class="data-item">
        <label>Rain:</label>
        <span id="rain"></span>
      </div>
      <div class="data-item">
        <label>Flame:</label>
        <span id="flame"></span>
      </div>
      <div class="graph-container">
        <canvas id="temperatureGraph"></canvas>
      </div>
    </div>

    <script>
      function updateData() {
        fetch('/data')
          .then((response) => response.json())
          .then((data) => {
            document.getElementById('temperature').textContent = data.temperature;
            document.getElementById('humidity').textContent = data.humidity;
            document.getElementById('motion').textContent = data.motion;
            document.getElementById('rain').textContent = data.rain;
            document.getElementById('flame').textContent = data.flame;
          })
          .catch((error) => {
            console.error('Error:', error);
          });
      }

      function updateGraph() {
        fetch('/graph')
          .then((response) => response.json())
          .then((data) => {
            const ctx = document.getElementById('temperatureGraph').getContext('2d');
            new Chart(ctx, {
              type: 'line',
              data: {
                labels: data.times,
                datasets: [
                  {
                    label: 'Temperature (°C)',
                    data: data.values,
                    backgroundColor: 'rgba(0, 31, 63, 0.3)',
                    borderColor: 'rgba(0, 31, 63, 1)',
                    borderWidth: 1,
                  },
                ],
              },
              options: {
                scales: {
                  x: {
                    display: true,
                    title: {
                      display: true,
                      text: 'Time (s)',
                      font: {
                        size: 14,
                      },
                      color: '#001f3f',
                    },
                  },
                  y: {
                    display: true,
                    title: {
                      display: true,
                      text: 'Temperature (°C)',
                      font: {
                        size: 14,
                      },
                      color: '#001f3f',
                    },
                  },
                },
              },
            });
          })
          .catch((error) => {
            console.error('Error:', error);
          });
      }

      setInterval(() => {
        updateData();
        updateGraph();
      }, 1500);
    </script>
  </body>
</html>
The web interface looks as follows:
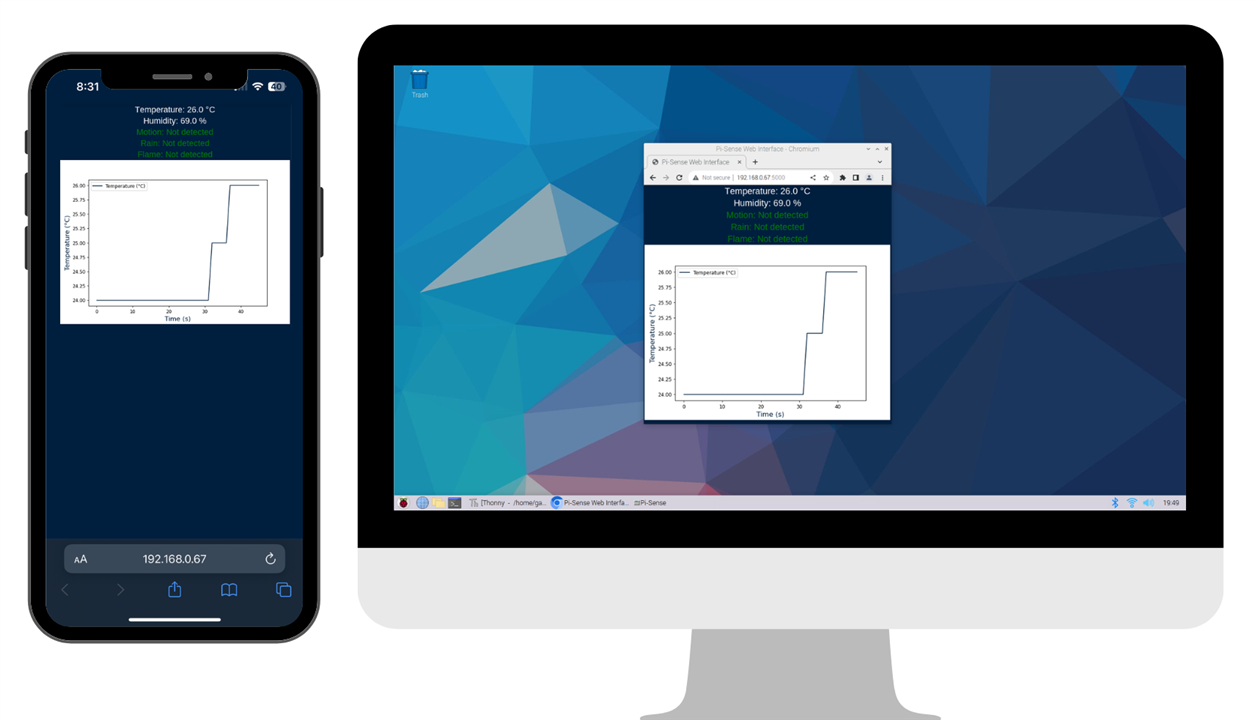
The interface has the same appearance, but now it can be viewed from any phone, tablet, or computer with internet access. This way, we are achieving the main objective: allowing scientists to know the conditions of their experiment or observed object without the need to be physically present.