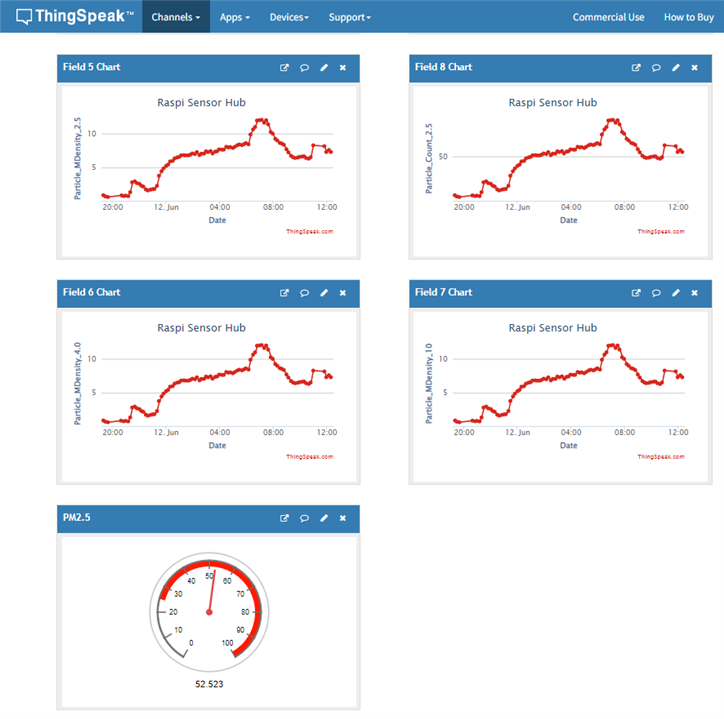
Over 16 hours the Raspberry PI together with the SPS30 fine dust sensor collected fine dust data from my apartment and garden and transferred it to my Thingspeak.com account. At Thingspeak the sensor data can be visualized on different graphs.
The sensor provides particle data (Mass Density and Particle Count) at different particle sizes (10µm, 4µm, 2.5µm and 1µm). I have visualized a selection of these data on a dashboard at Thingspeak.

Thingspeak - Dashboard
In the various graphs, we are particularly interested in the 2.5µm values. The WHO has recommended a mean annual fine dust PM2.5 concentration of no more than 5 µg/m³. And in our measurement, this value was reached very quickly.
The measurement took place on June 11 and 12, 2023. Here the wood stoves of the neighbours were not active. In terms of odour, no strong car exhaust or other combustion odours were noticeable. Therefore, I would assume that the WHO value will be exceeded many times over in the next heating period.
I have coloured the graph a bit to better see what happened during the recording.

2.5µm PM Measurements from the evening of the 11th of June till the 12th of June Noon in 2023
Pink marked area - apartment measurement:
The measurement took place in the apartment at the beginning, and my air purifier was also active. This gave us the lowest values of the measurement. The first small peak around 22:00 was a short ventilation with the air purifier switched on. Just before midnight, the air purifier was turned off and another ventilation started. Here gradually the fine dust concentration finally rises above the WHO limit.
Blue marked area - garden measurement:
This is followed by the measurement in the garden (from about 6:30), here the fine dust value rises to a maximum of about 13 µg/m³ and then drops slightly again. Shortly before the end of the measurement, there was a glitch in the measurement recording, here the Python script had hung up, because there was a problem with the data connection to Thingspeak.
Next:
Before I will sum up all results and provide the sources for the PCB and the Python code - I will post another article about further particulate matter measurements: multi-day measurements and household activities that release particulate matter. We will also have a look at how scattered the data is and what we can do about it in the Thingspeak web app. - Link

-

cstanton
-
Cancel
-
Vote Up
0
Vote Down
-
-
Sign in to reply
-
More
-
Cancel
Comment-

cstanton
-
Cancel
-
Vote Up
0
Vote Down
-
-
Sign in to reply
-
More
-
Cancel
Children