Introduction
As promised, I will give you updates on the making of hydrogel electrodes. I have already given an explanation on Post#2 why I want to use hydrogel electrodes. I followed the instructions on this paper to make the hydrogel.
https://pubs.acs.org/doi/10.1021/acsaelm.0c00653#
I decided to use their formula since I want to use electrodes that are sticky but at the same time you can use them multiple times. In this paper, they showed the performance of the electrodes changed slightly from one use to another and even after a 2 months period. Also, the performance of these electrodes is superior to the gold standards Ag/AgCl electrodes. The signal to noise ratio is way higher on the hydrogel electrodes. These soft electrodes perfectly fit into the design of my neuroergonomic portable non-invasive BCI.
Just a recommendation if you want to make these electrodes, make sure to take the right precautions while using the UV light. Not everybody can make these electrodes since you will need machines to degas and cure under an UV light but this is a competition for researcher so if you work in a research lab or in an university most likely you have these machines and somebody who can help you in making them. It is not hard, but you need the right precautions since the UV light can damage permanently your eyes just by looking at them (so you need to wear specific black glasses to protect you from UV) and it can damage your skin permanently as well. I was super caution so I didn't get any damage... hopefully.
I am not going to explain step by step what I did since it is explained in the paper but I am going to show you in general what I did. I used a laser cuter to cut the PDMS in 3 stamps: one with 5 rectangular 3x5cm shapes, one with 10 circles of 1.5 cm, and one with 10 circles of 5.9mm. The first two stamps are with the same dimensions of the paper so I can compare my hydrogel electrodes with the paper while performing tensile and signal tests. The last stamp is to test if I can make sensors as small at the g.PANGOLIN electrodes. They are the smallest electrodes on the market and can perform really accurate EEG analysis. Of course, this technology is really expensive (like tens of thousands of euros) and it is not portable at all. If I can replicate this technology, I can make a BCI that uses electrodeswith an higher signal to noise ratio for only a few hundreds of euros.
First Attempt - Mixing and UV Chamber
I mixed everything together as described in the paper, degassed the solution, and poured the hydrogel in the stamps with a syringe. Below you can find the images I took.
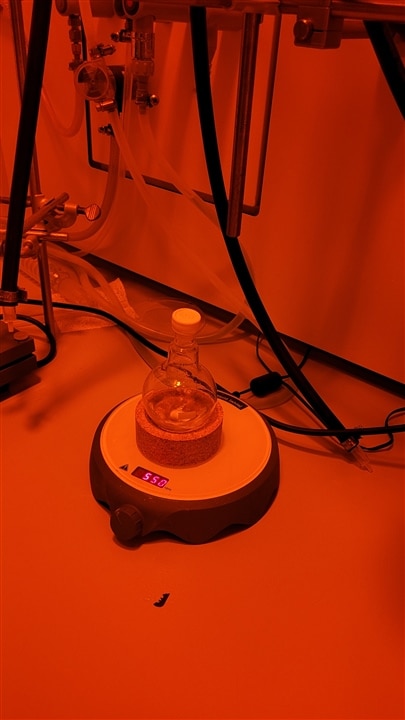
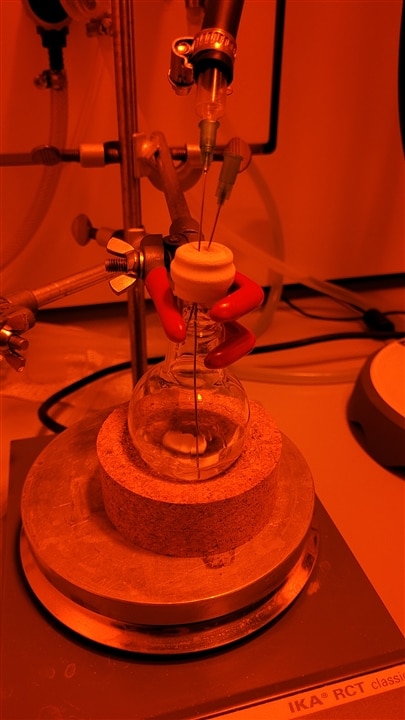
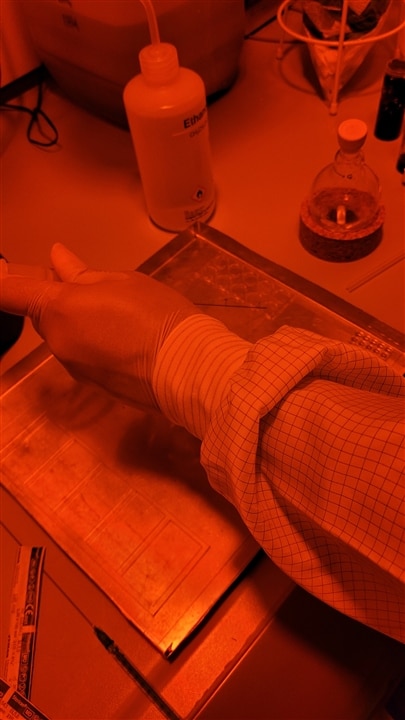
The light is red since we had to work with the windows closed and special light. A coworker decided to work with me since he is interested to use this hydrogel as well. This was nice since I don't have experience in the chemical lab and using the materials and devices there.
I set up the UV chamber. We had to get a special one since it needs to stay up for 3 to 4 hours. There were already some in the lab but they works only for few minutes. Below you can see the UV chamber (the machine in the middle). I forgot to take a picture when I put aluminum foil around the UV chamber to block further UV light.
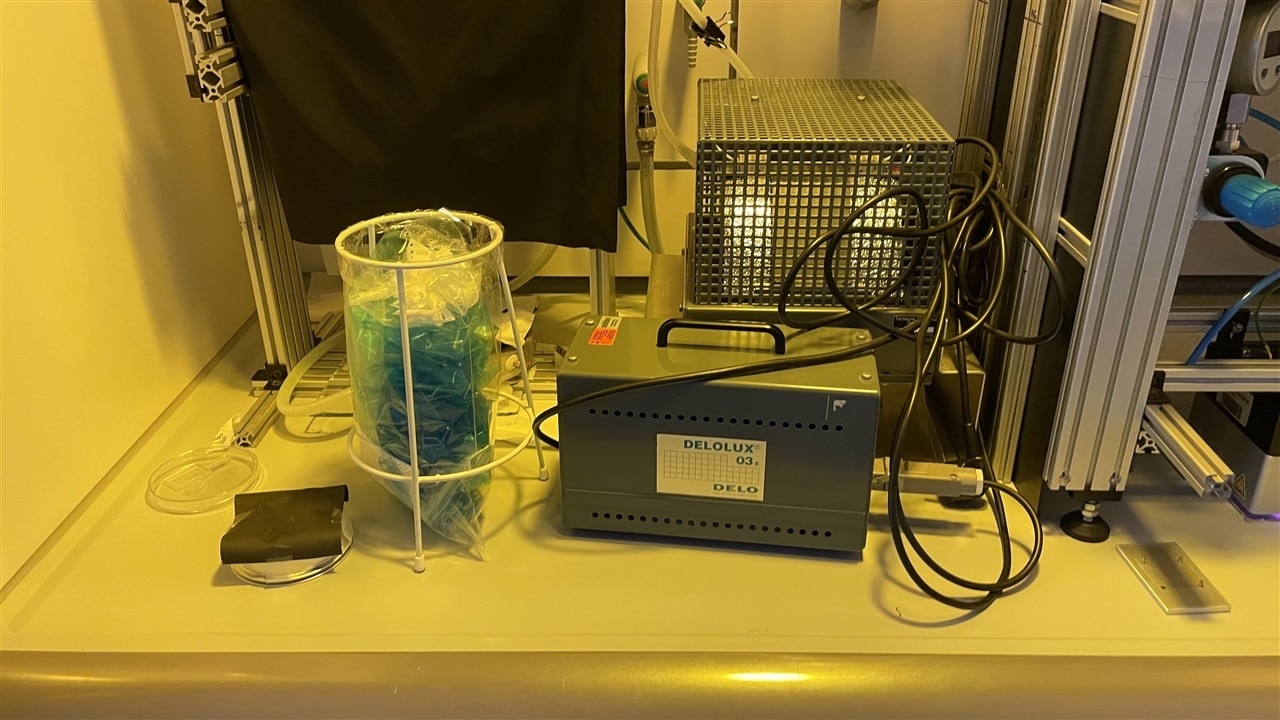
The problem that came here was that in the paper they used glass to cover the PDMS. We didn't have glass sheets so my coworker had the idea to use plastic sheets and told me that it was fine... this is the result of 1.5 hours of UV light on the plastic....
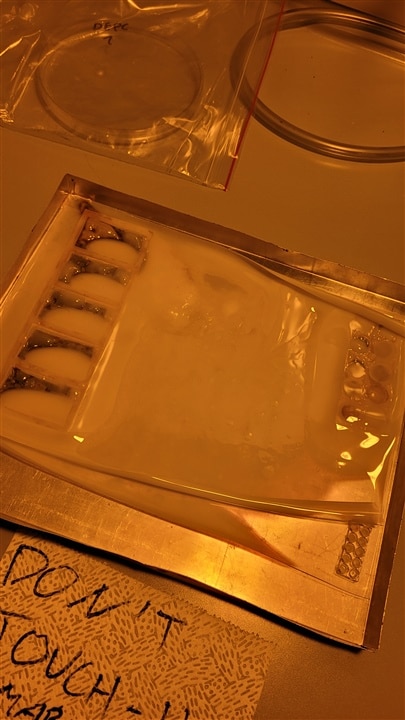
Second attempt - New Strategy
Not a very good idea... luckily nothing went on fire but we have to improvise now. Either we order some glass sheets and wait for the order to be made through the University. Honestly, I don't like to wait so I got creative and used sheets of glasses from the microscope. This means I had to cut again the PDMS stamps to fit into the small sheets of glasses. I can't have the 5x3cm rectangles since the sheets of glasses are 7.6x2.6 cm so I had to resize them. Below you can find the new PDMSs and how the layer works.
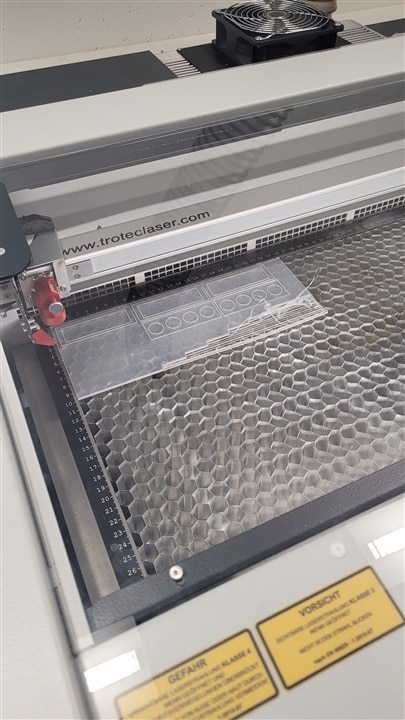
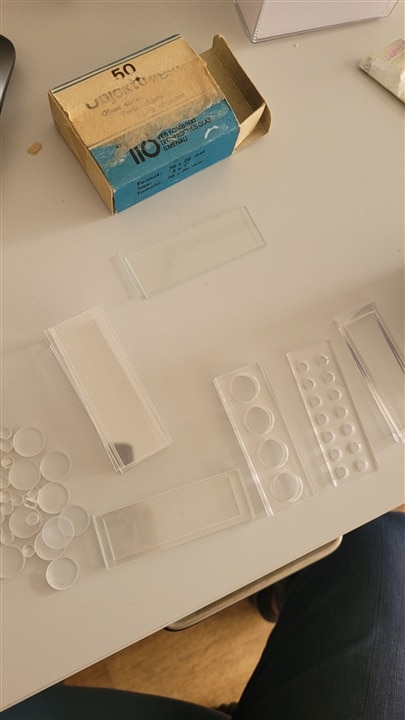
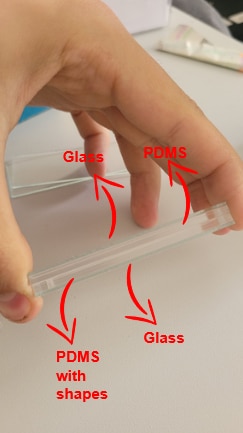
The paper mentions they put another layer of PDMS but never mentions why. It might be to block some of the UV light. Unfortunately, the paper never mentions also at what wavelength they used. So I used the standard 355nm wavelength for these experiments. I can't make hydrogel electrodes since I will be outside for a conference so I will try again the following week. We are exploring solutions to clamp the stamps so no air gets inside. Of course we will need something that doesn't melt under UV light and preferably doesn't reflect them.
Graphic User Interface (GUI)
The next topic is the GUI I want to create for this project. There are already GUIs to conduct neuroscience experiments. A really popular one, that I am familiar with, is OpenVibe. It is a really powerful tool but there are no drivers for an ESP32 and I don't know how to write them. Maybe I could do something with LSL connection but still I am not familiar with actually writing these protocols.
Something I want to start is doing some basic motor imagery tasks. Mostly, with EEG we can detect when we are thinking of a physical movement without actually performing the movement. The same brain areas are activated when we perform the motor movement or when we think of it. This can be really useful for people who suffer of any kind of movement impairment since they don't need to perform the movement to operate a machine but they can think of it. OpenVibe has a tutorial to use their motor imagery example and I want to replicate it. I am attaching below the link.
http://openvibe.inria.fr/motor-imagery-bci/
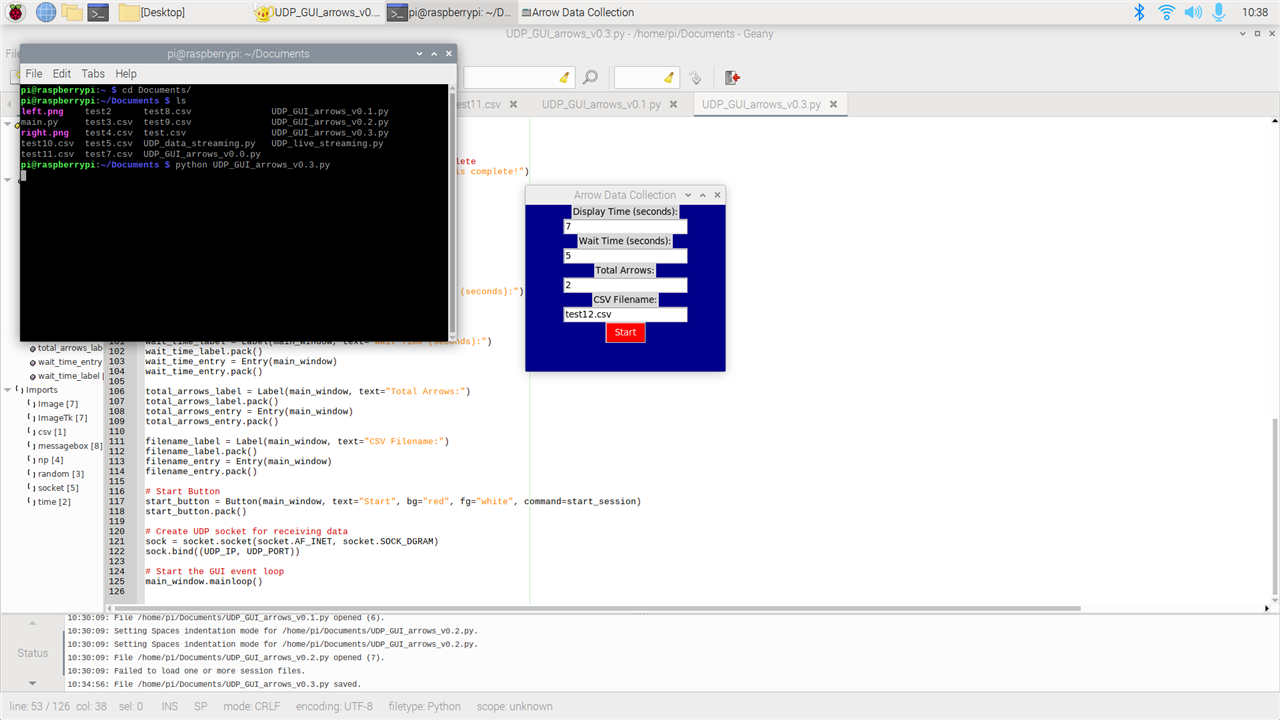
It is very simple, two arrows are showed one at a time randomly. When the left arrow is showed, the user think of a movement (like opening and closing the left hand). When the right arrow is showed, the user think of a movement (like opening and closing the right hand). Each arrow is showed after a period of rest so the brain activity starts from a rest state. The arrows are showed randomly since we don't want the user to see a pattern otherwise there will a bias in the EEG data. Finally, an equal amount of each arrow should be performed. So if a total of 40 arrows are showed, there should be 20 left and 20 right. If thy are not the same, there might be bias while using machine learning. I attached below what the BCI looks for now.
GUI Python Code
import csv
import time
import random
import numpy as np
import socket
from tkinter import *
from PIL import Image, ImageTk
from tkinter import messagebox

UDP_IP = "0.0.0.0"  # Bind to all available network interfaces
UDP_PORT = 12345    # Port number for data reception
numPins = 8         # Number of GPIO pins being used on the Huzzah32 board

# Create the main GUI window
main_window = Tk()
main_window.configure(bg="dark blue")
main_window.title("Arrow Data Collection")
main_window.geometry("300x250")

# Input variables
display_time_label = Label(main_window, text="Display Time (seconds):")
display_time_label.pack()
display_time_entry = Entry(main_window)
display_time_entry.pack()

wait_time_label = Label(main_window, text="Wait Time (seconds):")
wait_time_label.pack()
wait_time_entry = Entry(main_window)
wait_time_entry.pack()

total_arrows_label = Label(main_window, text="Total Arrows:")
total_arrows_label.pack()
total_arrows_entry = Entry(main_window)
total_arrows_entry.pack()

filename_label = Label(main_window, text="CSV Filename:")
filename_label.pack()
filename_entry = Entry(main_window)
filename_entry.pack()

# Create UDP socket for receiving data
sock = socket.socket(socket.AF_INET, socket.SOCK_DGRAM)
sock.bind((UDP_IP, UDP_PORT))

# Initialize the image label
image_label = None

# Function to display a random image (left.png or right.png)
def display_image():
    global image_label
    images = ["left.png", "right.png"]
    image_file = random.choice(images)
    image = Image.open(image_file)
    image = image.resize((600, 400), Image.ANTIALIAS)
    photo = ImageTk.PhotoImage(image)
    if image_label is None:
        image_label = Label(main_window, bg="black", image=photo)
        image_label.pack()
    else:
        image_label.configure(image=photo)
        image_label.image = photo

# Function to save recorded data to a CSV file
def save_data_to_csv(data_list, filename):
    with open(filename, mode='w', newline='') as file:
        writer = csv.writer(file)
        writer.writerow(['GPIO_1', 'GPIO_2', 'GPIO_3', 'GPIO_4', 'GPIO_5', 'GPIO_6', 'GPIO_7', 'GPIO_8', 'Class'])
        writer.writerows(data_list)

# Function to start the data recording session
def start_session():
    # Get input values from the GUI
    display_time = int(display_time_entry.get())
    wait_time = int(wait_time_entry.get())
    total_arrows = int(total_arrows_entry.get())
    csv_filename = filename_entry.get()

    # Calculate the number of left and right arrows
    left_arrows = total_arrows // 2
    right_arrows = total_arrows - left_arrows

    # Create the arrow list
    arrow_list = ['Left'] * left_arrows + ['Right'] * right_arrows
    random.shuffle(arrow_list)

    # Hide the main GUI window
    main_window.withdraw()

    # Create a new window for the session
    session_window = Tk()
    session_window.configure(bg="black")
    session_window.title("Data Collection")
    session_window.geometry("600x400")

    # Initialize the data list
    data_list = []

    # Loop for displaying images and recording data
    for arrow in arrow_list:
        display_image()
        session_window.update()
        time.sleep(display_time)
        image_label.configure(image=None)
        session_window.update()
        time.sleep(wait_time)

        # Receive data from Huzzah32 board
        received_data, _ = sock.recvfrom(2 * numPins)
        received_data = received_data.decode('utf-8')  # Convert bytes to string
        data = list(map(int, received_data.split(',')))
        data_list.append(data + [arrow])

    # Save data to CSV file
    save_data_to_csv(data_list, csv_filename)

    # Show a message box when the session is completed
    messagebox.showinfo("Session Completed", "Data collection session is completed!")

    # Close the session window
    session_window.destroy()

    # Close the socket
    sock.close()

    # Exit the program
    main_window.quit()

# Start Button
start_button = Button(main_window, text="Start", bg="red", fg="white", command=start_session)
start_button.pack()

# Start the GUI event loop
main_window.mainloop()
I am having issues with showing the left and right arrow in a different window. For now, I can just print it in the terminal but I want the arrows to be showed in a window of the GUI. The GUI asks for few general inputs, such as the display time (how long each session should be in seconds), wait time (how long the rest time should be), the total amount of arrows (which will be divided into 2), and the name of the file. For now, I didn't put any checking. I am not sure what would happen if somebody puts an odd number of total arrows (probably an error). Also, I want the GUI to automatically add the extension .csv and to check if there is already another file called like that.
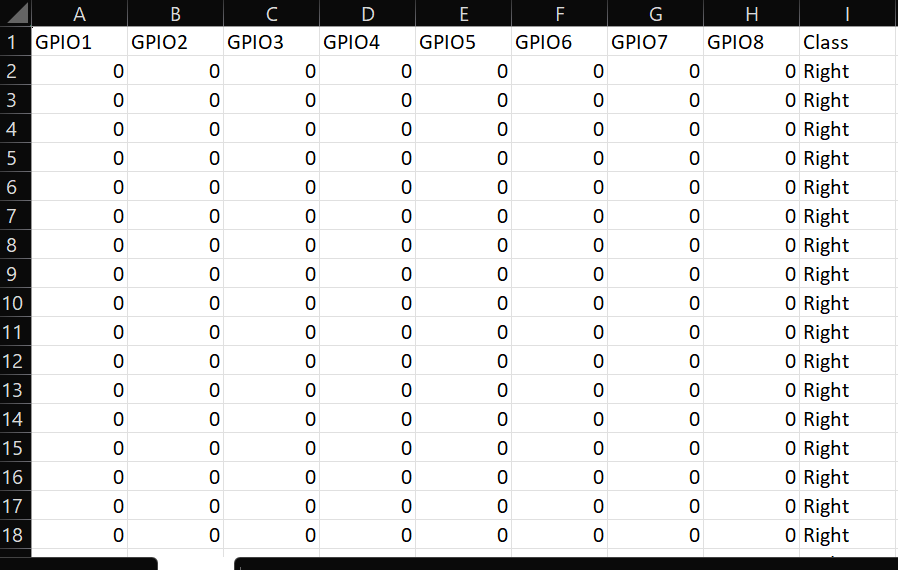
The GUI reads the data sent from the Huzzah32 and record it while the session is on. When the wait time period is on, no data is recorded. The data is saved as a csv file with labels for left and right arrow for 8 GPIO pins. I am attaching below a screenshot of an example of .csv file. I need to fix how it is saving the data. I want each session on one raw of the csv file and each cell should have an array of dimension 16000 x display_time for each electrode. So if there are 40 total arrows, there should be 40 rows for 8 columns (plus the label column). For now, it is printing on a new row each data and it is not 16000 x display_time.
I think I will fix this issue by working first without the UDP connection. I will just use the GPIO pins from the Raspberry Pi4 to collect data and once I am happy with the results of the GUI I will add the UDP connection with the Huzzah32 board. By the way, I found a good tutorial to connect the an ESP32 board with a Raspberry Pi4 via Bluetooth. I might try it next week or the following week. Something that I don't like about the UDP connection is that I have to check the Raspberry Pi4's IP address every time and if it is changed I have to update it on the Arduino code of the Huzzah32.
Conclusion and next step
For the next week, I will be working on the GUI on the Raspberry Pi4 and use the digital pins. Since I am going to use digital pins, values will be either 0 or 1 so it is just a test but I can see if I can buy an external ADC for the Raspberry Pi4. As I mentioned on Post #3, I can't use my original design since the ADS1299 will take 26 weeks to be shipped so I need to rely on a smaller bit resolution for this prototype of a prototype. For the GUI, I want to add the option to perform Machine Learning on the csv file. I have already the code to perform simple Machine Learning (like linear regression, SVM, gaussian, etc. that are popular for motor imagery) and pre-processing of EEG. For this option, the GUI should come with one input for the Machine Learning algorithm of choice (I will first write it for one and then add others if it works) and another input for the csv file to be used. The output should be the accuracy of the Machine Learning algorithm (if I put multiple Machine Learning algorithm, I should put a choice to select multiple algorithms and then print the accuracy of the best algorithm and the name of it) and the model. If I have time during the competition, I will see to add Deep Neural Networks as well.

