


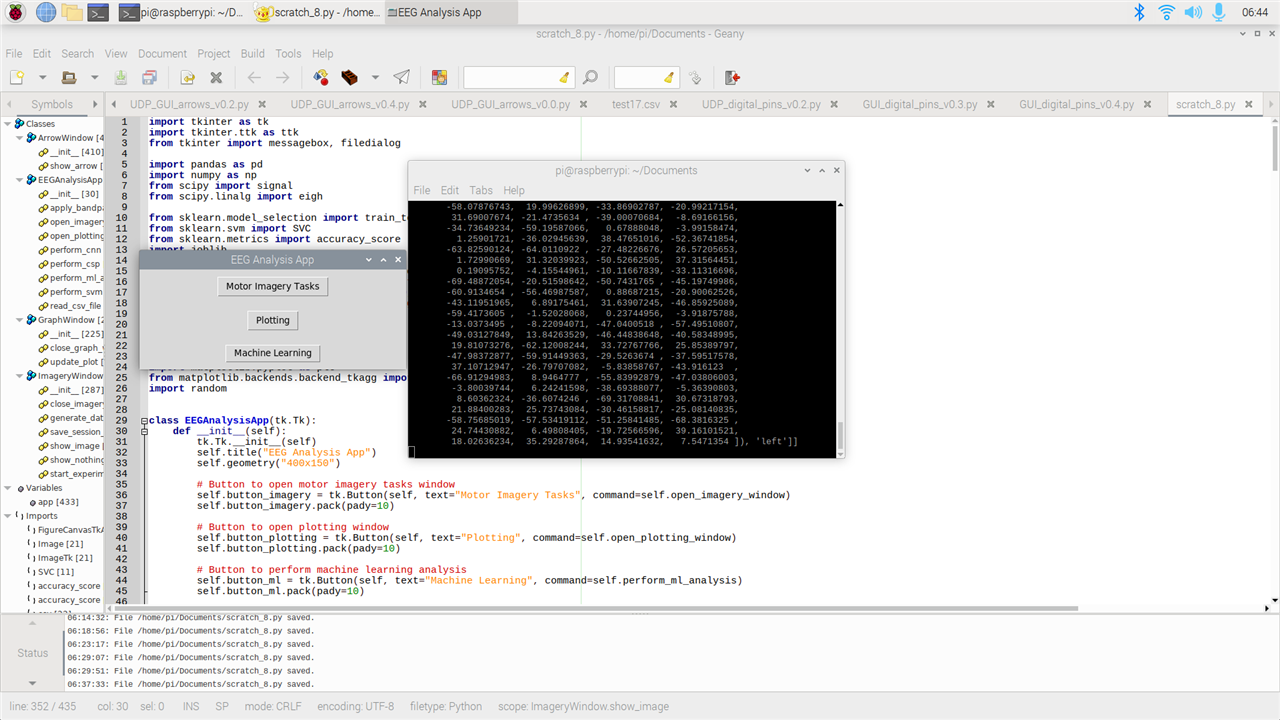
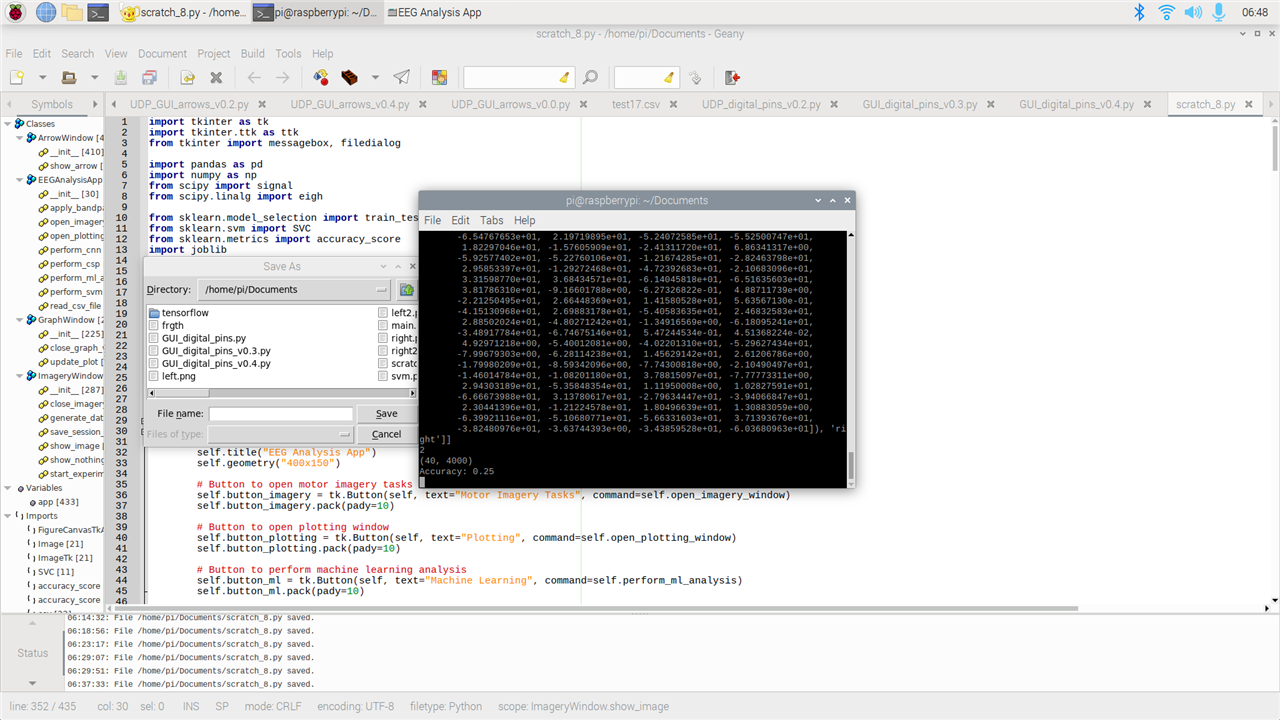
The Finished Graphic User Interface
After working for so long, I finally finished the GUI. The GUI has three main functions:
- Plotting: it plots in real time from 8 channels
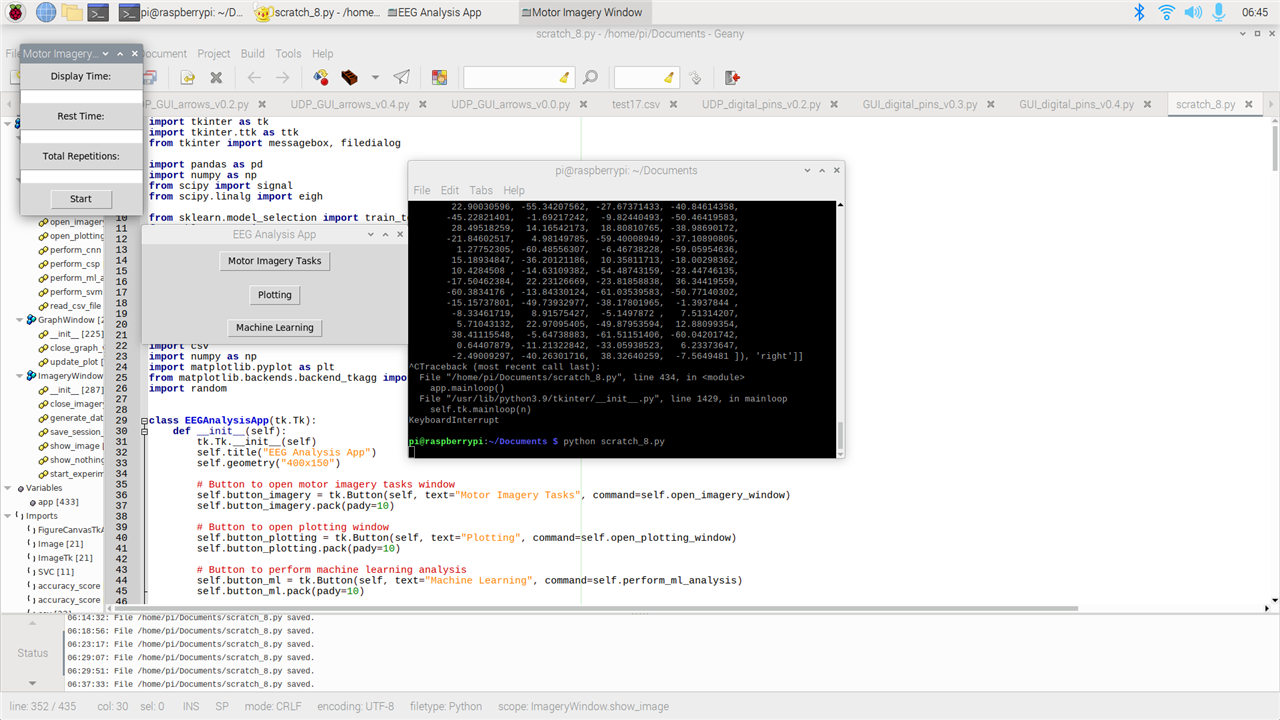
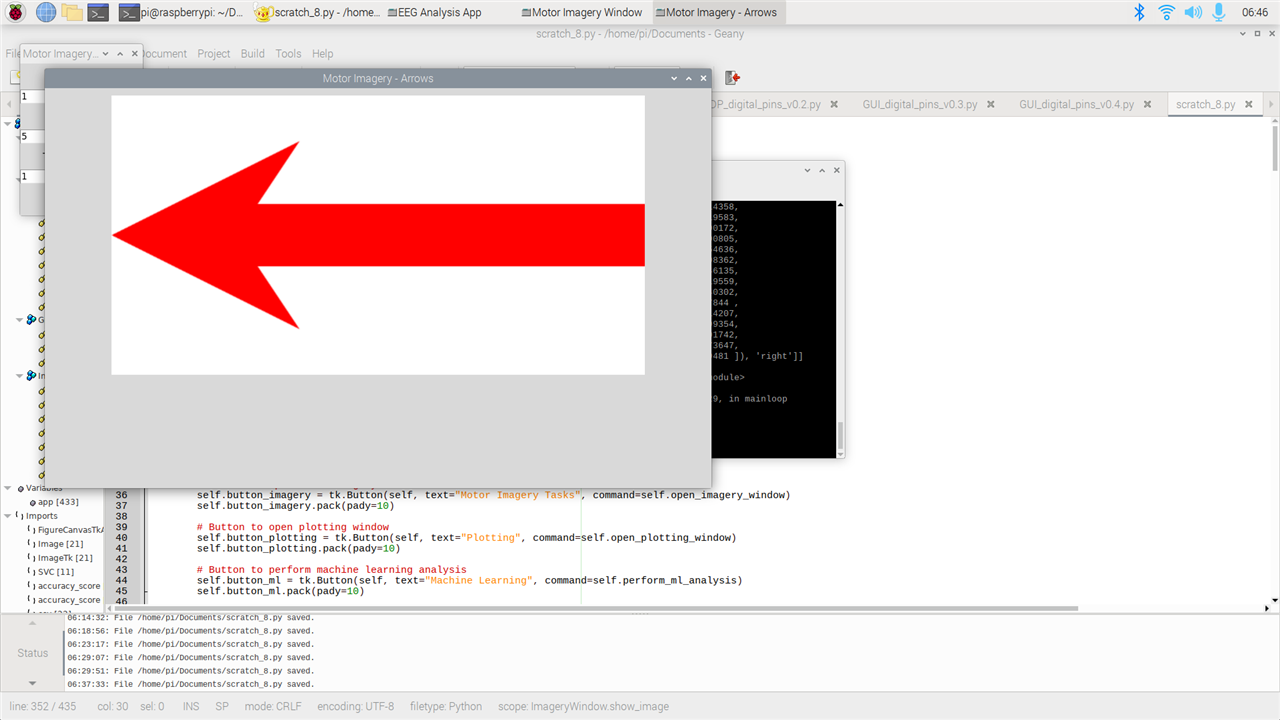
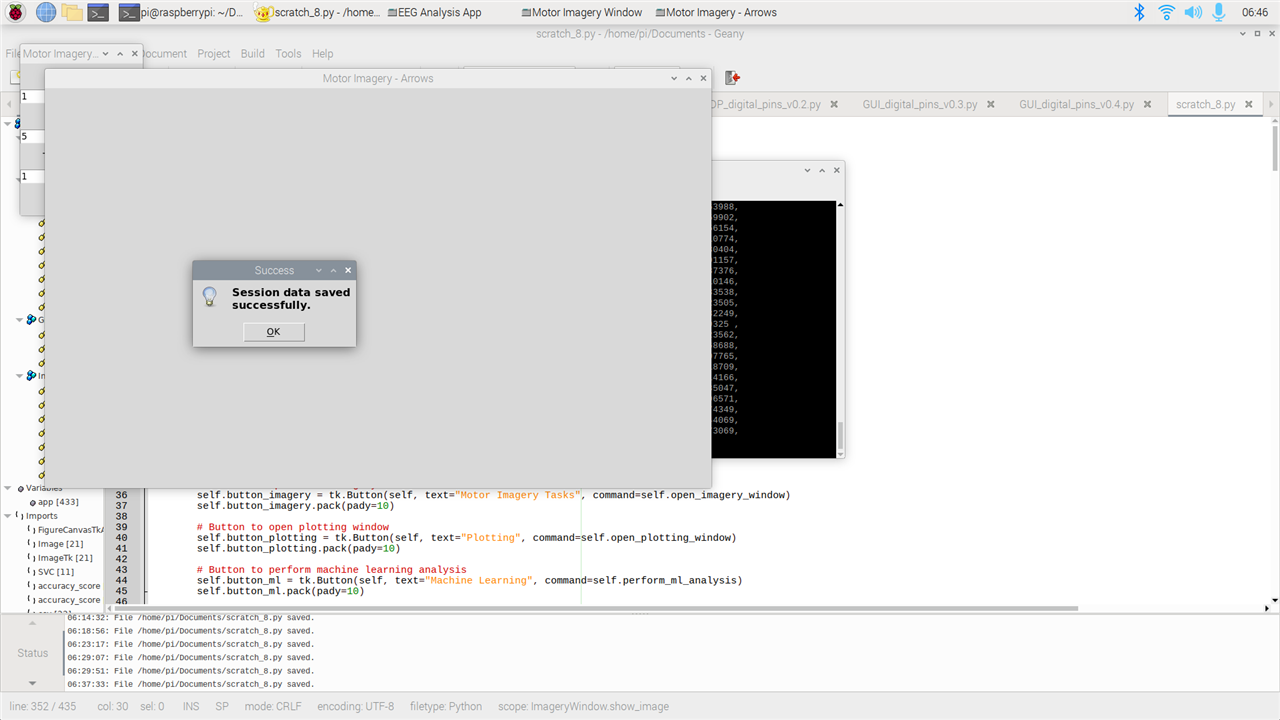
- Motor Imagery Tasks: with this function, everybody can do a simple motor imagery experiment. Just as I explained last post, the function will show you a left and a right arrow one at a time. During that time, the subject will think of a movement (like opening and closing right or left hand) so to get data of motor imagery tasks from each individual. The experiment is completely customizable. You can input the display time, resting time, how many sessions, and where you want to save the data. At the end of the experiment, the GUI will save a csv file with 8 channels plus labels for each session. In future, I might add the function the user can choose his/her own pictures and also to add more than two classes.
- Machine Learning: you can read the csv file that it was generated and perform basic feature extraction (filtering data from 8 to 30Hz) and some signal processing (I used common spatial pattern since it is a common filtering algorithm for this task). Finally, it uses linear SVM to classify the data, print the accuracy and save the model. On windows, I managed to run also CNN layers but I am having troubles installing tensorflow on the Raspberry Pi4. If somebody knows some easy solution, please let me know. I managed to install everything else like pandas, sklearn, numpy, etc.
This is getting exciting because now I am building a full GUI on Python that everybody can easily use and learn. I am attaching below code and pictures of the GUI. I will later upload the code on my github so that everybody can contribute on this GUI. The goal of this GUI is that so everybody can use a Python GUI that runs on everything without problems and can do neuroscience projects/experiments. This will open the doors of neuroscience to literally everybody.

import tkinter as tk
import tkinter.ttk as ttk
from tkinter import messagebox, filedialog

import pandas as pd
import numpy as np
from scipy import signal
from scipy.linalg import eigh

from sklearn.model_selection import train_test_split
from sklearn.svm import SVC
from sklearn.metrics import accuracy_score
import joblib

from sklearn.model_selection import train_test_split
#from tensorflow.keras.models import Sequential
#from tensorflow.keras.layers import Conv2D, MaxPooling2D, Flatten, Dense
#from tensorflow.keras.utils import to_categorical
from sklearn.metrics import accuracy_score

from PIL import Image, ImageTk
import csv
import numpy as np
import matplotlib.pyplot as plt
from matplotlib.backends.backend_tkagg import FigureCanvasTkAgg
import random


class EEGAnalysisApp(tk.Tk):
    def __init__(self):
        tk.Tk.__init__(self)
        self.title("EEG Analysis App")
        self.geometry("400x150")

        # Button to open motor imagery tasks window
        self.button_imagery = tk.Button(self, text="Motor Imagery Tasks", command=self.open_imagery_window)
        self.button_imagery.pack(pady=10)

        # Button to open plotting window
        self.button_plotting = tk.Button(self, text="Plotting", command=self.open_plotting_window)
        self.button_plotting.pack(pady=10)

        # Button to perform machine learning analysis
        self.button_ml = tk.Button(self, text="Machine Learning", command=self.perform_ml_analysis)
        self.button_ml.pack(pady=10)

    def open_imagery_window(self):
        imagery_window = ImageryWindow(self)  # Create the imagery window

    def open_plotting_window(self):
        graph_window = GraphWindow(self)  # Create the graph window

    def read_csv_file(self):
        # Prompt user to select a CSV file
        csv_file_path = filedialog.askopenfilename(filetypes=[("CSV files", "*.csv")])

        data = pd.read_csv(csv_file_path)

        # Remove newline characters (\n) from the data
        data = data.replace('\n', '', regex=True)

        columns = data.columns[:8]  # Select the first 8 columns
        labels = data['Label'].tolist()
        labels = [0 if label == 'left' else 1 for label in labels]  # Update labels to 0 for "left" and 1 for "right"
        # Convert each column to a numpy array
        arrays = []
        for col in columns:
            # Split the values by comma and convert to float
            values = data[col].str.strip('[]').str.split(',').apply(lambda x: [float(val) for val in x])
            arrays.append(np.array(values))

        # Combine the arrays into a single numpy array
        data_array = np.column_stack(arrays)

        return data_array, labels

    def apply_bandpass_filter(self, data_array, low_freq=8, high_freq=30, sampling_rate=250):

        filtered_data = []
        for row in data_array:
            filtered_row = []
            for data_list in row:
                # Convert the data_list to a NumPy array
                data_array = np.array(data_list)

                # Apply the bandpass filter using NumPy functions
                nyquist_freq = 0.5 * sampling_rate
                normalized_low_freq = low_freq / nyquist_freq
                normalized_high_freq = high_freq / nyquist_freq
                b, a = signal.butter(5, [normalized_low_freq, normalized_high_freq], btype='band')
                filtered_array = signal.lfilter(b, a, data_array)

                # Convert the filtered_array back to a list and append to filtered_row
                filtered_row.append(filtered_array.tolist())

            # Append the filtered_row to the filtered_data
            filtered_data.append(filtered_row)

        return filtered_data

    def perform_csp(self, filtered_data):
        # Convert the filtered_data to a NumPy array
        filtered_array = np.array(filtered_data)

        # Get the number of trials, channels, and samples
        num_trials, num_channels, num_samples = filtered_array.shape

        # Compute the class-wise covariance matrices
        class_cov_matrices = []
        for trial in filtered_array:
            class_cov_matrices.append(np.cov(trial))

        # Compute the average covariance matrix
        avg_cov_matrix = sum(class_cov_matrices) / num_trials

        # Compute the eigenvalues and eigenvectors of the average covariance matrix
        eigenvalues, eigenvectors = eigh(avg_cov_matrix)

        # Sort the eigenvalues in descending order
        sorted_indices = np.argsort(eigenvalues)[::-1]
        sorted_eigenvalues = eigenvalues[sorted_indices]
        sorted_eigenvectors = eigenvectors[:, sorted_indices]

        # Compute the spatial filters
        spatial_filters = np.dot(np.diag(np.sqrt(1 / sorted_eigenvalues)), sorted_eigenvectors.T)

        # Apply the spatial filters to the filtered data
        csp_data = np.dot(spatial_filters, filtered_array.T).T

        return csp_data.tolist()

    def perform_svm(self, csp_data, labels):

        csp_data = np.array(csp_data)
        csp_data = np.reshape(csp_data, (csp_data.shape[0], csp_data.shape[1] * csp_data.shape[2]))
        # Reshape data_array if it has 3 dimensions
        print(csp_data.ndim)
        print(csp_data.shape)
        if csp_data.ndim == 3:
            csp_data = csp_data.reshape(csp_data.shape[0], -1)
            print(csp_data.ndim)
        # Split the data into training and testing sets
        X_train, X_test, y_train, y_test = train_test_split(csp_data, labels, test_size=0.2, random_state=42)

        # Create and fit the SVM model
        svm_model = SVC()
        svm_model.fit(X_train, y_train)

        # Make predictions on the test set
        y_pred = svm_model.predict(X_test)

        # Calculate and print the accuracy
        accuracy = accuracy_score(y_test, y_pred)
        print("Accuracy:", accuracy)

        root = tk.Tk()
        root.withdraw()
        file_path = filedialog.asksaveasfilename(defaultextension=".pkl")

        if file_path:
            joblib.dump(svm_model, file_path)
            print("Model saved successfully.")
        else:
            print("Model not saved.")

    def perform_cnn(self, csp_data, labels):

        # Convert the data and labels to numpy arrays
        csp_data = np.array(csp_data)
        labels = np.array(labels)

        # Split the data into training and testing sets
        X_train, X_test, y_train, y_test = train_test_split(csp_data, labels, test_size=0.2, random_state=42)

        # Reshape the data for CNN (assuming 2D CSP data)
        X_train = X_train.reshape(X_train.shape[0], X_train.shape[1], X_train.shape[2], 1)
        X_test = X_test.reshape(X_test.shape[0], X_test.shape[1], X_test.shape[2], 1)

        # Convert the labels to one-hot encoding
        y_train = to_categorical(y_train)
        y_test = to_categorical(y_test)

        # Create the CNN model
        model = Sequential()
        model.add(
            Conv2D(32, kernel_size=(3, 3), activation='relu', input_shape=(X_train.shape[1], X_train.shape[2], 1)))
        model.add(MaxPooling2D(pool_size=(2, 2)))
        model.add(Flatten())
        model.add(Dense(64, activation='relu'))
        model.add(Dense(len(np.unique(labels)), activation='softmax'))

        # Compile the model
        model.compile(loss='categorical_crossentropy', optimizer='adam', metrics=['accuracy'])

        # Train the model
        model.fit(X_train, y_train, batch_size=32, epochs=10, verbose=1)

        # Evaluate the model on the test data
        _, accuracy = model.evaluate(X_test, y_test)
        print("Accuracy: {:.2f}%".format(accuracy * 100))

        # Open file explorer to choose the location to save the model
        root = tk.Tk()
        root.withdraw()
        file_path = filedialog.asksaveasfilename(defaultextension=".h5")

        if file_path:
            model.save(file_path)
            print("Model saved successfully.")
        else:
            print("Model not saved.")

    def perform_ml_analysis(self):

        data_array, labels = self.read_csv_file()
        filtered_data = self.apply_bandpass_filter(data_array)
        csp_data = self.perform_csp(filtered_data)

        self.perform_svm(csp_data, labels)
        #self.perform_cnn(csp_data, labels)


class GraphWindow(tk.Toplevel):
    def __init__(self, main_window):
        super().__init__(main_window)
        self.title("Graph Window")
        self.protocol("WM_DELETE_WINDOW", self.close_graph_window)

        # Generate random initial data for 8 channels
        self.data = np.random.uniform(-70, 40, (8, 160))

        # Set the figure size and subplots dimensions
        fig_width = 8
        fig_height = 16
        subplot_height = fig_height / 8

        # Create subplots for each channel
        self.fig, self.axes = plt.subplots(nrows=8, ncols=1, sharex=True, figsize=(fig_width, fig_height))

        # Create lines and titles for each channel
        self.lines = []
        self.titles = []
        for i, ax in enumerate(self.axes):
            line, = ax.plot(self.data[i])
            self.lines.append(line)
            title = ax.set_title(f"Channel {i+1}")
            self.titles.append(title)

        # Set the axis limits and labels
        self.axes[-1].set_xlabel("Time (s)")
        self.fig.tight_layout()

        # Create the canvas to display the figure
        self.canvas = FigureCanvasTkAgg(self.fig, master=self)
        self.canvas.draw()
        self.canvas.get_tk_widget().pack()

        # Create a timer to update the plot every 62.5 milliseconds (16Hz)
        self.timer = self.after(62, self.update_plot)

    def update_plot(self):
        # Generate new random data for the next time step
        new_data = np.random.uniform(-70, 40, (8, 1))
        self.data = np.hstack((self.data[:, 1:], new_data))

        # Update the lines with the new data and set titles
        for i, line, new_values, title in zip(range(8), self.lines, self.data, self.titles):
            line.set_ydata(new_values)
            title.set_text(f"Channel {i+1}")

        # Move the x-axis limits to show the last 10 seconds of data
        self.axes[-1].set_xlim(self.data.shape[1] - 160, self.data.shape[1])

        # Redraw the canvas
        self.canvas.draw()

        # Schedule the next update
        self.timer = self.after(62, self.update_plot)

    def close_graph_window(self):
        self.after_cancel(self.timer)  # Cancel the update timer
        self.destroy()  # Destroy the graph window
        self.master.deiconify()  # Show the main window

class ImageryWindow(tk.Toplevel):
    def __init__(self, main_window):
        super().__init__(main_window)
        self.title("Motor Imagery Window")
        self.protocol("WM_DELETE_WINDOW", self.close_imagery_window)

        self.display_time = 0
        self.rest_time = 0
        self.total_repetitions = 0
        self.session_data = []

        self.display_time_label = ttk.Label(self, text="Display Time:")
        self.display_time_entry = ttk.Entry(self)
        self.display_time_label.pack(pady=10)
        self.display_time_entry.pack()

        self.rest_time_label = ttk.Label(self, text="Rest Time:")
        self.rest_time_entry = ttk.Entry(self)
        self.rest_time_label.pack(pady=10)
        self.rest_time_entry.pack()

        self.total_repetitions_label = ttk.Label(self, text="Total Repetitions:")
        self.total_repetitions_entry = ttk.Entry(self)
        self.total_repetitions_label.pack(pady=10)
        self.total_repetitions_entry.pack()

        self.start_button = ttk.Button(self, text="Start", command=self.start_experiment)
        self.start_button.pack(pady=10)

        self.c_left = 0
        self.c_right = 0

    def start_experiment(self):
        self.display_time = int(self.display_time_entry.get())
        self.rest_time = int(self.rest_time_entry.get())
        self.total_repetitions = int(self.total_repetitions_entry.get()) * 2
        self.total_repetitions_unch = self.total_repetitions

        if self.display_time <= 0 or self.rest_time <= 0 or self.total_repetitions <= 0:
            messagebox.showerror("Error", "Invalid input values. Please enter positive non-zero values.")
            return

        self.arrow_window = ArrowWindow(self)
        self.arrow_window.show_arrow()

        self.session_data = []

        self.after(self.rest_time * 1000, self.show_image)

    def show_image(self):

        if self.total_repetitions > 0:

            if self.c_left >= self.total_repetitions_unch / 2:
                image = 'right2.png'

            elif self.c_right >= self.total_repetitions_unch / 2:
                image = 'left2.png'

            else:
                image = random.choice(["left2.png", "right2.png"])

            self.arrow_window.show_arrow(image)

            label = "left" if image == "left2.png" else "right"

            if image == "left2.png":
                self.c_left += 1
            else:
                self.c_right += 1

            self.session_data.append([self.generate_data() for _ in range(8)] + [label])

            self.total_repetitions -= 1
            self.after(self.display_time * 1000, self.show_nothing)
        else:
            print(self.session_data)
            self.save_session_data()

    def show_nothing(self):
        self.arrow_window.destroy()  # Destroy the arrow window
        self.arrow_window = ArrowWindow(self)
        self.arrow_window.show_arrow()
        self.after(self.rest_time * 1000, self.show_image)

    def generate_data(self):
        # Placeholder function to generate random data for each channel
        return np.random.uniform(-70, 40, self.display_time * 250)

    def save_session_data(self):
        save_file = filedialog.asksaveasfilename(defaultextension=".csv", filetypes=[("CSV Files", "*.csv")])
        if save_file:
            header = ["Channel 1", "Channel 2", "Channel 3", "Channel 4", "Channel 5", "Channel 6", "Channel 7",
                      "Channel 8", "Label"]
            with open(save_file, "w", newline="") as csvfile:

                writer = csv.writer(csvfile)
                writer.writerow(header)

                for sublist in self.session_data:
                    row = []
                    for item in sublist:
                        if isinstance(item, list):
                            row.extend(item)
                        elif isinstance(item, np.ndarray):
                            row.append(np.array2string(item, separator=','))
                        elif isinstance(item, str):
                            row.append(item)
                    writer.writerow(row)


            messagebox.showinfo("Success", "Session data saved successfully.")
        else:
            messagebox.showinfo("Information", "Session data was not saved.")

        self.close_imagery_window()

    def close_imagery_window(self):
        self.arrow_window.destroy()  # Destroy the arrow window
        self.destroy()  # Destroy the imagery window
        self.master.deiconify()  # Show the main window


class ArrowWindow(tk.Toplevel):
    def __init__(self, main_window):
        super().__init__(main_window)
        self.title("Motor Imagery - Arrows")
        self.geometry("1000x600")

        self.left_image = ImageTk.PhotoImage(Image.open("left2.png"))
        self.right_image = ImageTk.PhotoImage(Image.open("right2.png"))

        self.arrow_label = tk.Label(self)
        self.arrow_label.pack(padx=10, pady=10)

    def show_arrow(self, image=None):
        if image == "left2.png":
            self.arrow_label.configure(image=self.left_image)
        elif image == "right2.png":
            self.arrow_label.configure(image=self.right_image)
        else:
            self.arrow_label.configure(image=None)

        self.update_idletasks()


if __name__ == "__main__":
    app = EEGAnalysisApp()
    app.mainloop()
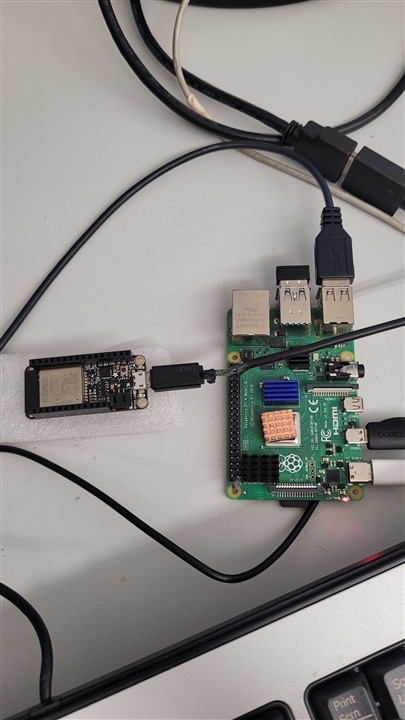
As for now, I am only generating random values to simulate a neuron activity. I will try to connect again via Bluetooth the Huzzah32 board with the Raspberry Pi4 to stream data while using the GUI. One problem that I had was that on the raspberry pi4 the images were too big. On windows, it would just resize them fit but not on the raspberry pi. A solution I did was just changing the size of the images manually so they would fit on the screen.
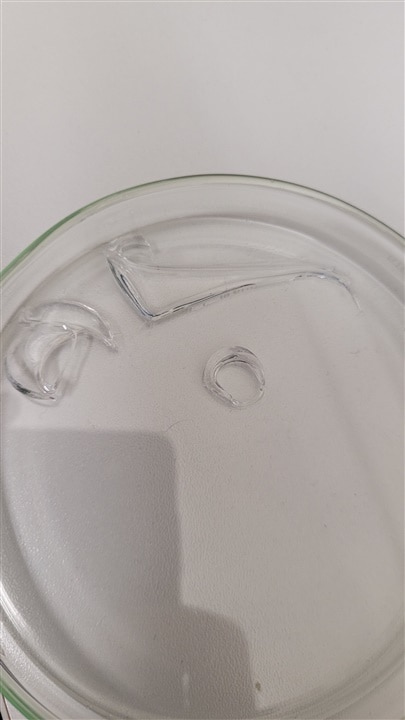
Progress with Hydrogel electrodes
I managed to do some more electrodes with hydrogel but I had a problem. The hydrogel was spilling all over. I need to find a way clamp the glass and PDMS so that the hydrogel doesn't spill away from the stamps. A colleague told me we can make custom PDMS with magnets so that each layer doesn't move. This seems like a good choice. I am not sure if I can just glue them since the glue might melt or evaporate under UV light. I will try to make some more so that I have good shapes. For now I managed to get some broken pieces that are elastic and sticky. I conducted some preliminary results and they seems to be conductive. So I just need a way to avoid spilling. The hydrogel electrodes are hard to see since they are clear but you should be able to see the edges.
Incoming
For next week I will try to do two posts. One where I stream the data from the Huzzah32 board to the GUI on the Raspberry Pi4 so I can visualize the data from the electrodes in real-time. For the second post, I will do a summary of everything I did and learned during this project. If you have suggestions on how to install tensorflow on the raspberry pi4 let me know so that I can run CNN layers as well. I will post also my github later so that anybody interested can follow or contribute to the project. Again, this project will help making neuroscience project open to everybody (any age, any budget, an experience). Furthermore, I will try to do a logo for the PiBCI!