


Introduction
As mentioned on Post #1 and #2, I wanted to develop a device easy to use and powerful. The most common portable BCIs on the market connect to PC via Bluetooth using a Bluetooth dongle. I wanted to remove a dongle because I see it really annoying and can be an expensive component for the manufacturer to produce and for the user to lose. Also, I wanted to test Bluetooth capability of the ESP32. I had at home an Huzzah32 board. Previously, I transmitted data via UDP to the Raspberry Pi4 but I didn't like this method because I need to check for the Huzzah32's IP address every time it connects. I want to do something more automatic. This device should be used for every day's purposes so once it is set up the device should just be plug-in and play.
Connecting via Bluetooth
This project is my first time working on a board with Bluetooth and WiFi. I enjoyed this new challenge even though I might have done some stupid mistakes. It was a little bit tricky connecting via Bluetooth because when I use to connect the Huzzah32 with the Raspberry Pi4 from the Bluetooth panel, it would connect but saying there is no connection because there is no service. That is actually fine. I just need to connect once via Bluetooth the Raspberry Pi4 and the Huzzah32. Then, on the Raspberry Pi4 I need to run the following line on a terminal to get the MAC address of the Huzzah32.
hcitool scan
The Huzzah32 needs to be on and run the code below. I don't like the fact that it is not automated the detection of the MAC address. I would like to hear some suggestions from the community if you have a better way. At least, I just need to get the MAC address once and then it is just plug-in and play. Below you can find the code for the Huzzah32 and the Raspberry Pi4.
#include <BluetoothSerial.h>

BluetoothSerial SerialBT;

const int numPins = 8;
const int adcPins[numPins] = {26, 25, 34, 39, 36, 4, 13, 12};  // Example ADC pins

int pinValues[numPins];

void setup() {
  Serial.begin(115200);
  SerialBT.begin("ESP32"); // Bluetooth device name

  for (int i = 0; i < numPins; i++) {
    pinMode(adcPins[i], INPUT);
  }
}

void loop() {
  for (int i = 0; i < numPins; i++) {
    pinValues[i] = analogRead(adcPins[i]);
    Serial.print("Pin ");
    Serial.print(adcPins[i]);
    Serial.print(": ");
    Serial.println(pinValues[i]);
  }

  SerialBT.write((uint8_t*)pinValues, sizeof(pinValues));

  delay(1000); // Delay between transmissions
}
import tkinter as tk
import tkinter.ttk as ttk
from tkinter import messagebox, filedialog

import pandas as pd
import numpy as np
from scipy import signal
from scipy.linalg import eigh

from sklearn.model_selection import train_test_split
from sklearn.svm import SVC
from sklearn.metrics import accuracy_score
import joblib

from sklearn.model_selection import train_test_split
#from tensorflow.keras.models import Sequential
#from tensorflow.keras.layers import Conv2D, MaxPooling2D, Flatten, Dense
#from tensorflow.keras.utils import to_categorical
from sklearn.metrics import accuracy_score

from PIL import Image, ImageTk
import csv
import numpy as np
import matplotlib.pyplot as plt
from matplotlib.backends.backend_tkagg import FigureCanvasTkAgg
import random

import bluetooth
import time

target_address = "A8:03:2A:EB:03:16"

port = 1

class EEGAnalysisApp(tk.Tk):
    def __init__(self):
        tk.Tk.__init__(self)
        self.title("EEG Analysis App")
        self.geometry("400x150")

        # Button to open motor imagery tasks window
        self.button_imagery = tk.Button(self, text="Motor Imagery Tasks", command=self.open_imagery_window)
        self.button_imagery.pack(pady=10)

        # Button to open plotting window
        self.button_plotting = tk.Button(self, text="Plotting", command=self.open_plotting_window)
        self.button_plotting.pack(pady=10)

        # Button to perform machine learning analysis
        self.button_ml = tk.Button(self, text="Machine Learning", command=self.perform_ml_analysis)
        self.button_ml.pack(pady=10)

    def open_imagery_window(self):
        imagery_window = ImageryWindow(self)  # Create the imagery window

    def open_plotting_window(self):
        graph_window = GraphWindow(self)  # Create the graph window

    def read_csv_file(self):
        # Prompt user to select a CSV file
        csv_file_path = filedialog.askopenfilename(filetypes=[("CSV files", "*.csv")])

        data = pd.read_csv(csv_file_path)

        # Remove newline characters (\n) from the data
        data = data.replace('\n', '', regex=True)

        columns = data.columns[:8]  # Select the first 8 columns
        labels = data['Label'].tolist()
        labels = [0 if label == 'left' else 1 for label in labels]  # Update labels to 0 for "left" and 1 for "right"
        # Convert each column to a numpy array
        arrays = []
        for col in columns:
            # Split the values by comma and convert to float
            values = data[col].str.strip('[]').str.split(',').apply(lambda x: [float(val) for val in x])
            arrays.append(np.array(values))

        # Combine the arrays into a single numpy array
        data_array = np.column_stack(arrays)

        return data_array, labels

    def apply_bandpass_filter(self, data_array, low_freq=8, high_freq=30, sampling_rate=250):

        filtered_data = []
        for row in data_array:
            filtered_row = []
            for data_list in row:
                # Convert the data_list to a NumPy array
                data_array = np.array(data_list)

                # Apply the bandpass filter using NumPy functions
                nyquist_freq = 0.5 * sampling_rate
                normalized_low_freq = low_freq / nyquist_freq
                normalized_high_freq = high_freq / nyquist_freq
                b, a = signal.butter(5, [normalized_low_freq, normalized_high_freq], btype='band')
                filtered_array = signal.lfilter(b, a, data_array)

                # Convert the filtered_array back to a list and append to filtered_row
                filtered_row.append(filtered_array.tolist())

            # Append the filtered_row to the filtered_data
            filtered_data.append(filtered_row)

        return filtered_data

    def perform_csp(self, filtered_data):
        # Convert the filtered_data to a NumPy array
        filtered_array = np.array(filtered_data)

        # Get the number of trials, channels, and samples
        num_trials, num_channels, num_samples = filtered_array.shape

        # Compute the class-wise covariance matrices
        class_cov_matrices = []
        for trial in filtered_array:
            class_cov_matrices.append(np.cov(trial))

        # Compute the average covariance matrix
        avg_cov_matrix = sum(class_cov_matrices) / num_trials

        # Compute the eigenvalues and eigenvectors of the average covariance matrix
        eigenvalues, eigenvectors = eigh(avg_cov_matrix)

        # Sort the eigenvalues in descending order
        sorted_indices = np.argsort(eigenvalues)[::-1]
        sorted_eigenvalues = eigenvalues[sorted_indices]
        sorted_eigenvectors = eigenvectors[:, sorted_indices]

        # Compute the spatial filters
        spatial_filters = np.dot(np.diag(np.sqrt(1 / sorted_eigenvalues)), sorted_eigenvectors.T)

        # Apply the spatial filters to the filtered data
        csp_data = np.dot(spatial_filters, filtered_array.T).T

        return csp_data.tolist()

    def perform_svm(self, csp_data, labels):

        csp_data = np.array(csp_data)
        csp_data = np.reshape(csp_data, (csp_data.shape[0], csp_data.shape[1] * csp_data.shape[2]))
        # Reshape data_array if it has 3 dimensions
        print(csp_data.ndim)
        print(csp_data.shape)
        if csp_data.ndim == 3:
            csp_data = csp_data.reshape(csp_data.shape[0], -1)
            print(csp_data.ndim)
        # Split the data into training and testing sets
        X_train, X_test, y_train, y_test = train_test_split(csp_data, labels, test_size=0.2, random_state=42)

        # Create and fit the SVM model
        svm_model = SVC()
        svm_model.fit(X_train, y_train)

        # Make predictions on the test set
        y_pred = svm_model.predict(X_test)

        # Calculate and print the accuracy
        accuracy = accuracy_score(y_test, y_pred)
        print("Accuracy:", accuracy)

        root = tk.Tk()
        root.withdraw()
        file_path = filedialog.asksaveasfilename(defaultextension=".pkl")

        if file_path:
            joblib.dump(svm_model, file_path)
            print("Model saved successfully.")
        else:
            print("Model not saved.")

    def perform_cnn(self, csp_data, labels):

        # Convert the data and labels to numpy arrays
        csp_data = np.array(csp_data)
        labels = np.array(labels)

        # Split the data into training and testing sets
        X_train, X_test, y_train, y_test = train_test_split(csp_data, labels, test_size=0.2, random_state=42)

        # Reshape the data for CNN (assuming 2D CSP data)
        X_train = X_train.reshape(X_train.shape[0], X_train.shape[1], X_train.shape[2], 1)
        X_test = X_test.reshape(X_test.shape[0], X_test.shape[1], X_test.shape[2], 1)

        # Convert the labels to one-hot encoding
        y_train = to_categorical(y_train)
        y_test = to_categorical(y_test)

        # Create the CNN model
        model = Sequential()
        model.add(
            Conv2D(32, kernel_size=(3, 3), activation='relu', input_shape=(X_train.shape[1], X_train.shape[2], 1)))
        model.add(MaxPooling2D(pool_size=(2, 2)))
        model.add(Flatten())
        model.add(Dense(64, activation='relu'))
        model.add(Dense(len(np.unique(labels)), activation='softmax'))

        # Compile the model
        model.compile(loss='categorical_crossentropy', optimizer='adam', metrics=['accuracy'])

        # Train the model
        model.fit(X_train, y_train, batch_size=32, epochs=10, verbose=1)

        # Evaluate the model on the test data
        _, accuracy = model.evaluate(X_test, y_test)
        print("Accuracy: {:.2f}%".format(accuracy * 100))

        # Open file explorer to choose the location to save the model
        root = tk.Tk()
        root.withdraw()
        file_path = filedialog.asksaveasfilename(defaultextension=".h5")

        if file_path:
            model.save(file_path)
            print("Model saved successfully.")
        else:
            print("Model not saved.")

    def perform_ml_analysis(self):

        data_array, labels = self.read_csv_file()
        filtered_data = self.apply_bandpass_filter(data_array)
        csp_data = self.perform_csp(filtered_data)

        self.perform_svm(csp_data, labels)
        #self.perform_cnn(csp_data, labels)


class GraphWindow(tk.Toplevel):
    def __init__(self, main_window):
        super().__init__(main_window)
        self.title("Graph Window")
        self.protocol("WM_DELETE_WINDOW", self.close_graph_window)

        # Generate random initial data for 8 channels
        self.data = np.random.uniform(0, 0, (8, 160))

        self.sock = bluetooth.BluetoothSocket(bluetooth.RFCOMM)
        self.sock.connect((target_address, port))

        self.num_pins = 8;

        self.matrix = [[0] * self.num_pins]
        self.values = []

        # Set the figure size and subplots dimensions
        fig_width = 8
        fig_height = 16
        subplot_height = fig_height / 8

        # Create subplots for each channel
        self.fig, self.axes = plt.subplots(nrows=8, ncols=1, sharex=True, figsize=(fig_width, fig_height))

        for ax in self.axes:
                ax.set_ylim(-75, 40)

        # Create lines and titles for each channel
        self.lines = []
        self.titles = []
        for i, ax in enumerate(self.axes):
            line, = ax.plot(self.data[i])
            self.lines.append(line)
            title = ax.set_title(f"Channel {i+1}")
            self.titles.append(title)

        # Set the axis limits and labels
        self.axes[-1].set_xlabel("Time (s)")
        self.fig.tight_layout()

        # Create the canvas to display the figure
        self.canvas = FigureCanvasTkAgg(self.fig, master=self)
        self.canvas.draw()
        self.canvas.get_tk_widget().pack()

        # Create a timer to update the plot every 62.5 milliseconds (16Hz)
        self.timer = self.after(62, self.update_plot)

    def update_plot(self):

        data = self.sock.recv(1024)
        #print(data)
        if len(data) == self.num_pins * 4:
                for i in range(0, len(data), 4):
                        byte_chunk = data[i:i+4]
                        value = [0.028083 * int.from_bytes(byte_chunk, byteorder='little', signed=False) - 75]
                        print(value)
                        self.values.append( value )
                new_data = self.values
                print(new_data)
        else:
        # Generate new random data for the next time step
                new_data = np.random.uniform(-70, 40, (8, 1))
                print("Random Generating")
                print(len(data))
                #print(new_data)
        self.data = np.hstack((self.data[:, 1:], new_data))
        self.values = []
        # Update the lines with the new data and set titles
        for i, line, new_values, title in zip(range(8), self.lines, self.data, self.titles):
            line.set_ydata(new_values)
            title.set_text(f"Channel {i+1}")

        # Move the x-axis limits to show the last 10 seconds of data
        self.axes[-1].set_xlim(self.data.shape[1] - 160, self.data.shape[1])

        # Redraw the canvas
        self.canvas.draw()

        # Schedule the next update
        self.timer = self.after(62, self.update_plot)

    def close_graph_window(self):
        self.after_cancel(self.timer)  # Cancel the update timer
        self.destroy()  # Destroy the graph window
        self.master.deiconify()  # Show the main window
        self.sock.close()

class ImageryWindow(tk.Toplevel):
    def __init__(self, main_window):
        super().__init__(main_window)
        self.title("Motor Imagery Window")
        self.protocol("WM_DELETE_WINDOW", self.close_imagery_window)

        self.display_time = 0
        self.rest_time = 0
        self.total_repetitions = 0
        self.session_data = []

        self.display_time_label = ttk.Label(self, text="Display Time:")
        self.display_time_entry = ttk.Entry(self)
        self.display_time_label.pack(pady=10)
        self.display_time_entry.pack()

        self.rest_time_label = ttk.Label(self, text="Rest Time:")
        self.rest_time_entry = ttk.Entry(self)
        self.rest_time_label.pack(pady=10)
        self.rest_time_entry.pack()

        self.total_repetitions_label = ttk.Label(self, text="Total Repetitions:")
        self.total_repetitions_entry = ttk.Entry(self)
        self.total_repetitions_label.pack(pady=10)
        self.total_repetitions_entry.pack()

        self.start_button = ttk.Button(self, text="Start", command=self.start_experiment)
        self.start_button.pack(pady=10)

        self.c_left = 0
        self.c_right = 0

    def start_experiment(self):
        self.display_time = int(self.display_time_entry.get())
        self.rest_time = int(self.rest_time_entry.get())
        self.total_repetitions = int(self.total_repetitions_entry.get()) * 2
        self.total_repetitions_unch = self.total_repetitions

        if self.display_time <= 0 or self.rest_time <= 0 or self.total_repetitions <= 0:
            messagebox.showerror("Error", "Invalid input values. Please enter positive non-zero values.")
            return

        self.arrow_window = ArrowWindow(self)
        self.arrow_window.show_arrow()

        self.session_data = []

        self.after(self.rest_time * 1000, self.show_image)

    def show_image(self):

        if self.total_repetitions > 0:

            if self.c_left >= self.total_repetitions_unch / 2:
                image = 'right2.png'

            elif self.c_right >= self.total_repetitions_unch / 2:
                image = 'left2.png'

            else:
                image = random.choice(["left2.png", "right2.png"])

            self.label = "left" if image == "left2.png" else "right"
            self.arrow_window.show_arrow(image)
            self.get_data()


            if image == "left2.png":
                self.c_left += 1
            else:
                self.c_right += 1

            #self.session_data.append([self.How can_data() for _ in range(8)] + [label])

            self.total_repetitions -= 1

            self.show_nothing()
            #self.after(self.get_data, self.show_nothing)
        else:
            print(self.session_data)
            self.save_session_data()

    def show_nothing(self):
        self.arrow_window.destroy()  # Destroy the arrow window
        self.arrow_window = ArrowWindow(self)
        self.arrow_window.show_arrow()
        self.after(self.rest_time * 1000, self.show_image)

    def get_data(self):

        self.sock = bluetooth.BluetoothSocket(bluetooth.RFCOMM)
        self.sock.connect((target_address, port))

        self.num_pins = 8;

        self.matrix = [[0] * self.num_pins]
        self.values = []

        start_time = time.time()

        new_data = [[] for _ in range(8)]
        print(new_data)

        while time.time() - start_time < self.display_time:

                data = self.sock.recv(1024)
                print(data)
                if len(data) == self.num_pins * 4:
                        for i in range(0, len(data), 4):
                                byte_chunk = data[i:i+4]
                                value = int.from_bytes(byte_chunk, byteorder='little', signed=False)
                                new_data[i // 4].append(value)
                        print("Inside")
                        print(new_data)

        self.session_data.append(new_data + [self.label])
        self.sock.close()

    def save_session_data(self):
        save_file = filedialog.asksaveasfilename(defaultextension=".csv", filetypes=[("CSV Files", "*.csv")])
        if save_file:
            header = ["Channel 1", "Channel 2", "Channel 3", "Channel 4", "Channel 5", "Channel 6", "Channel 7",
                      "Channel 8", "Label"]
            with open(save_file, "w", newline="") as csvfile:

                writer = csv.writer(csvfile)
                writer.writerow(header)

                for sublist in self.session_data:
                    row = sublist[:-1]
                    string_value = sublist[-1]

                    writer.writerow(row + [string_value])


            messagebox.showinfo("Success", "Session data saved successfully.")
        else:
            messagebox.showinfo("Information", "Session data was not saved.")

        self.close_imagery_window()

    def close_imagery_window(self):
        self.arrow_window.destroy()  # Destroy the arrow window
        self.destroy()  # Destroy the imagery window
        self.master.deiconify()  # Show the main window


class ArrowWindow(tk.Toplevel):
    def __init__(self, main_window):
        super().__init__(main_window)
        self.title("Motor Imagery - Arrows")
        self.geometry("1000x600")

        self.left_image = ImageTk.PhotoImage(Image.open("left2.png"))
        self.right_image = ImageTk.PhotoImage(Image.open("right2.png"))

        self.arrow_label = tk.Label(self)
        self.arrow_label.pack(padx=10, pady=10)

    def show_arrow(self, image=None):
        if image == "left2.png":
            self.arrow_label.configure(image=self.left_image)
        elif image == "right2.png":
            self.arrow_label.configure(image=self.right_image)
        else:
            self.arrow_label.configure(image=None)

        self.update_idletasks()


if __name__ == "__main__":
    app = EEGAnalysisApp()
    app.mainloop()
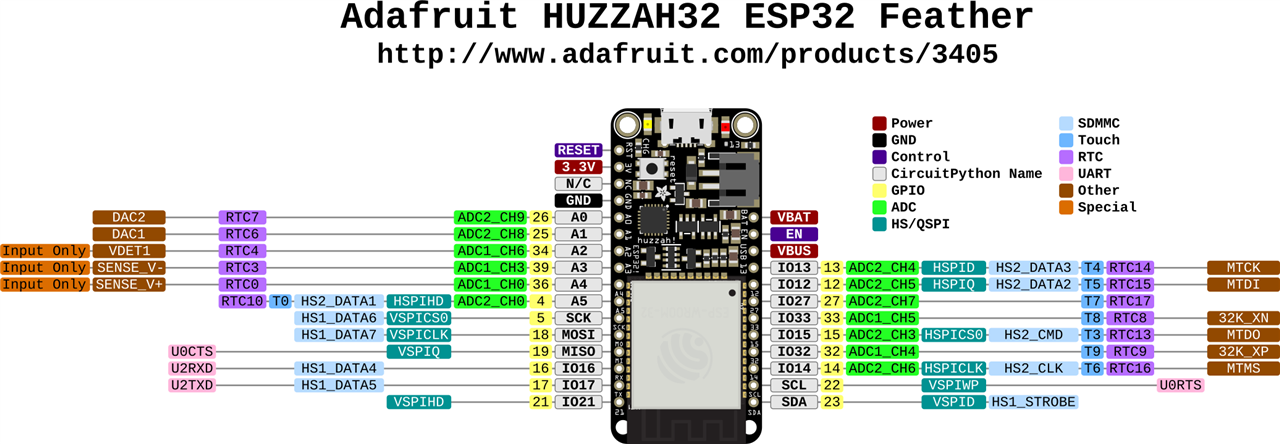
I made sure to use only pins connected to the 12bit ADC on the Huzzah32 as described in the pinouts below.
Plotting data on the GUI
As I mentioned on Post #5, I finished the GUI but I was generating random values. This time I was streaming the values to the GUI. The real time plotting was pretty straightforward. It was tricky on the motor imagery tasks since I had to rewrite some functions completely including the function to save the data into csv files. Now, all the GUI functions work and it is possible to start doing neuroscience projects with the GUI and the boards. You can see below the real time plotting of the data.
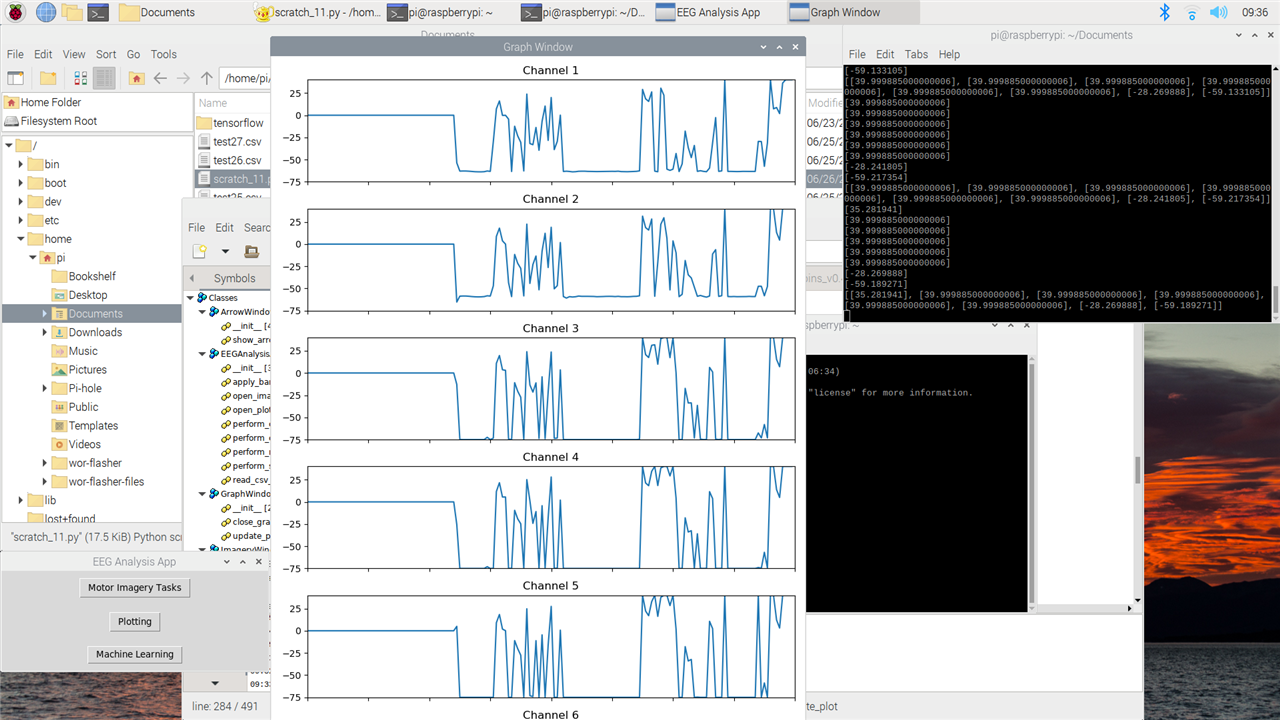
For now, I initialized the data with zeros. The analog value from the 12 bit ADC of the Huzzah32 gets converted from 0-4095 to (-75)-40 similar to the potential of a neuron. This explains why you see data going from 0 to -75 immediately. I initialized data at 0 and then when data is transmitted (so a value of 0 is transmitted) the plot goes to -75. The spikes are me touching the pins.
The data gets appended from the far right of the plot and moves to left. I want to change the plotting. So the plots start with zero data and it gets appended to the left and then moves to the right. When it reaches the far right of the plot, the entire plot should move to the right to include the new data (so the far left side should disappear when the plot is full and gets new data.
As for now I am plotting data that is being sent every second. I tried sending data at 16kHz and I can read it on the Raspberry Pi4 but I am getting some errors. I need to adjust the code so it automatically fits the transmission of data otherwise I will have packets too big with a higher frequency. End of the line, sending 16kHz of data is possible and this feature can unlock novel BCI experiments for portable devices since nowadays most of the devices limited themselves to only 250Hz.
Conclusion
This is the end of this project. I successfully managed to stream data from an ESP32 to a Raspberry Pi4 and created a GUI to conduct neuroscience projects. For now, the GUI has everything you need for basic neuroscience projects like plotting data in real time, save data in a csv file, and perform data cleaning, feature extraction and Machine Learning. The GUI needs a better looking design, different neuroscience experiments like P300 or SSVEP (they are paradigms commonly used for portable BCIs), and live testing of the Machine Learning model (so the GUI should read the data in real time and try to understand if the user is thinking left or right arrow). Maybe I will try to do it with the time remaining.This new GUI is built in Python in comparison to other popular GUI like OpenVibe so it can easily run on any device and it is easy to read and edit. On my summary post, I will share the link for the Github repository.
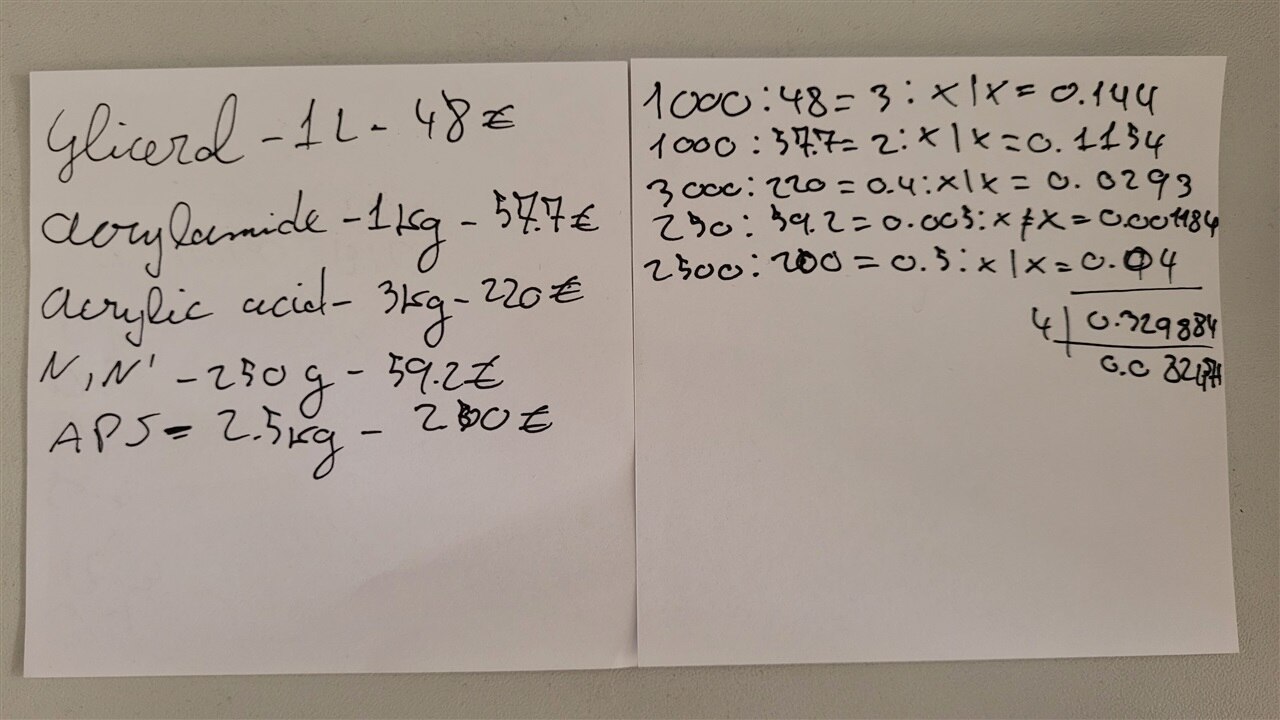
On the other end, I fabricated and tested hydrogel electrodes. On Post #4, I showed making hydrogel and on Post #5 I showed me testing them. The resistance is constant in all the hydrogel electrodes so it is a very stable formula. I am still having some issues with spilling so I didn't get the shapes I was looking for. I ordered magnets so that each layer of the stamps don't move and stay connected but this will be next week. These electrodes are really promising since they have a better signal to noise ratio than the golden standard silver electrodes, they don't require the application of gel for conductivity, they don't require to wear a cap to place them, they can be used multiple times with very small changes in signal to noise ration, and they are fairly cheap to produce (I have estimated the cost of materials to be 0.08 euros per electrode of size 15mm of diameter compared to the 33 euros for 1 silver electrode). I have attached below the cost of the material in bulk (left paper) and then calculated in ratio how much I need roughly for 4 electrodes (right paper).
The available portable BCI devices can be expensive and hard to use especially for people with no experience and training. More advanced electroencephalography can even cost tens or hundreds of thousands of dollars. This project shows it is possible to conduct neuroscience experiments and to build modern portable BCI devices while still having high performances and make it accessible to everybody.