Pollinator Pollster (Powered by Pi)
In this post we'll discuss the audio classification element of this project in much more detail. You'll recall from my last post that I had been forced to make a direction change following withdrawal of support for TensorFlow Lite Model Maker, and so since then I have been exploring an alternative audio classification approach using a 'Fast Fourier Transform' and frequency analysis.
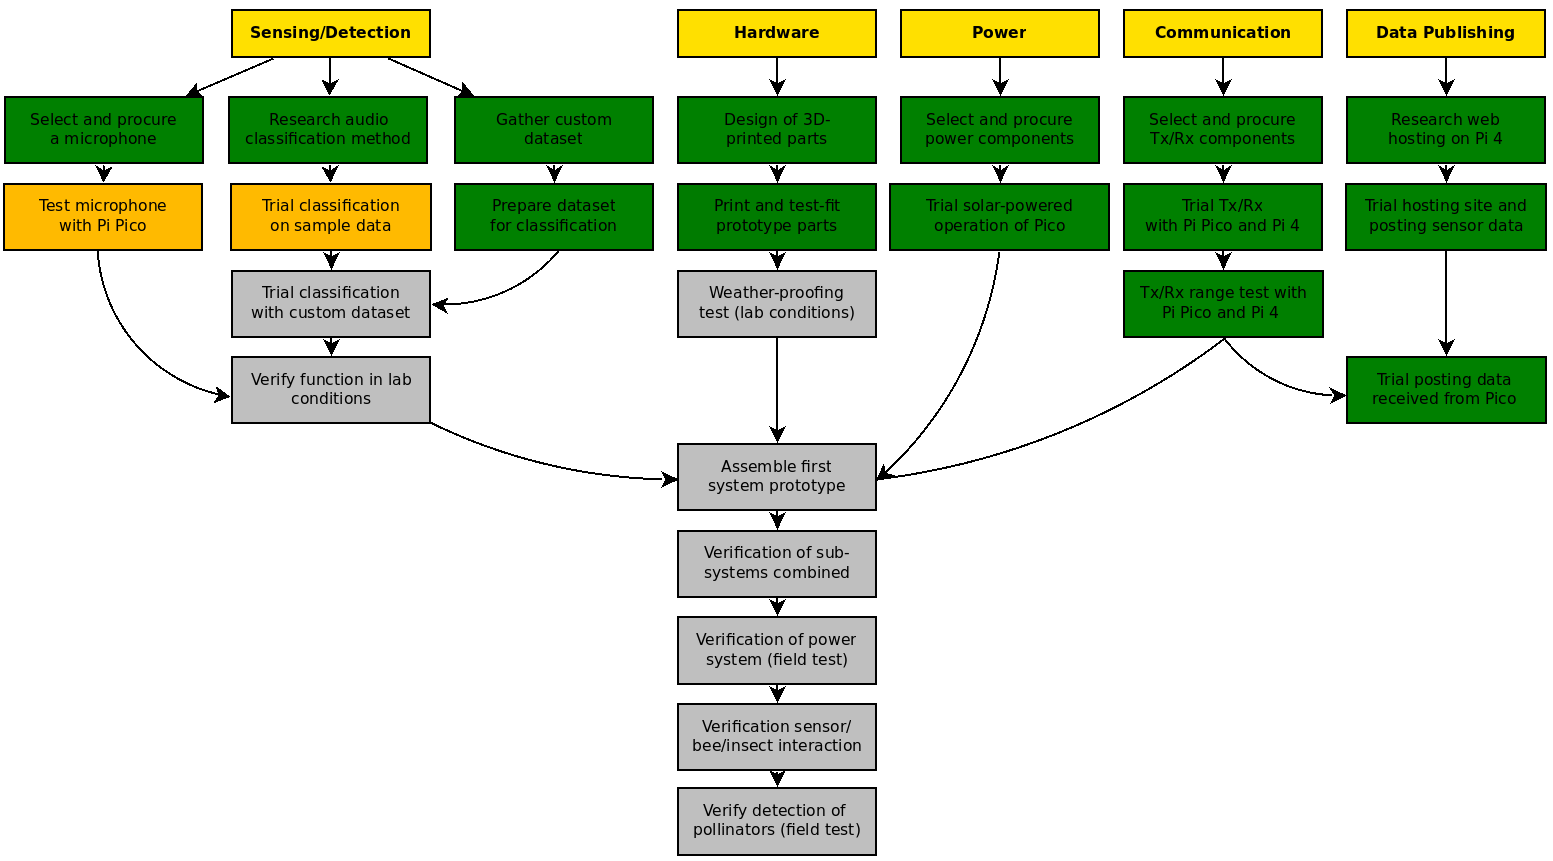
Project Plan
A few more green boxes this time! Firstly, I have now finished 3D-printing all parts of the prototype which I will now be assembling (and will do a dedicated blog post on). I've slightly altered the wording of the Sensing/Detection steps to reflect the new methodology (not using machine learning). Testing the microphone scores amber (as while I do have a working microphone with the Pi Pico now, the Adafruit PDM MEMS microphone, I may decide to change this to another model), as does trialing the classification process on sample data (as this is a WIP). Two new green boxes are scored however for gathering a custom dataset and preparing this for classification testing - since the content started I have been relentlessly chasing every bee in sight with my phone, making recordings of their flying sounds, so now have a useful custom library with which to test the process.
A Bumblebee's Acoustic Fingerprint
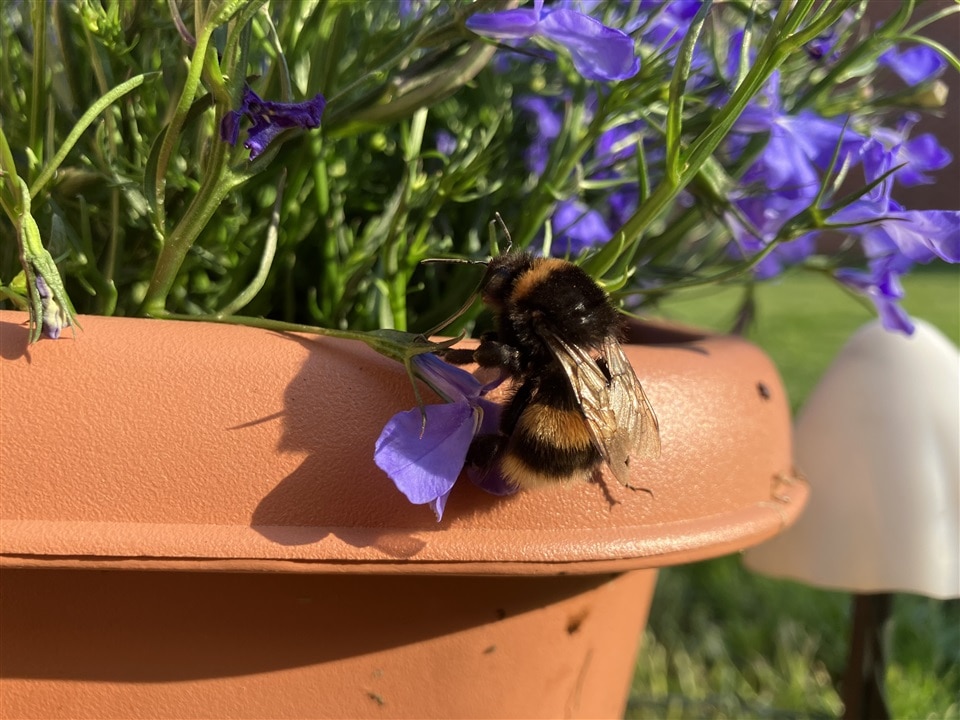
Taking the 'Buff-Tailed Bumblebee', Bombus terrestris as the example, as I see this type of bee in my garden daily, I made 10 clips of it foraging among the strawberry, lavender, daisy, and other flowers that we have in a planter. I love watching these bees, as round as a large coin, position themselves so delicately among the narrow flower stems and so purposefully visit all the flowers sequentially. Here's one that visited this week:
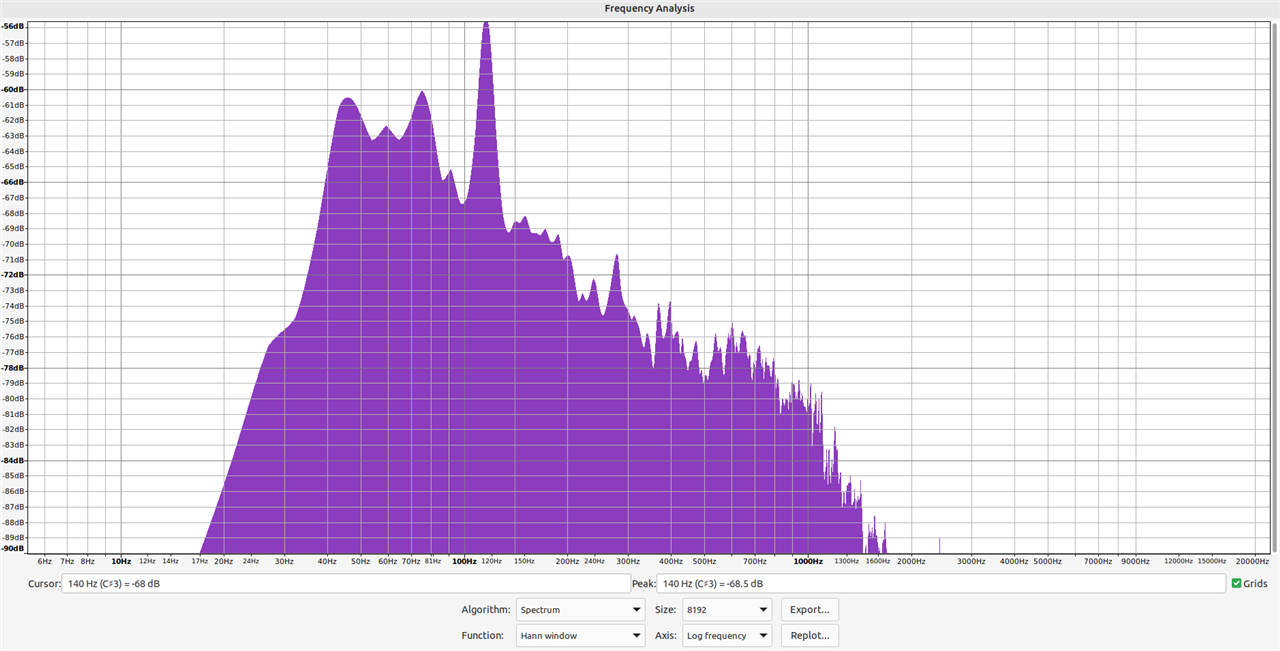
To demonstrate the acoustic fingerprint of the bee, I took one particular clip of it flying that I recorded, and used the freeware audio program Audacity to run a frequency analysis (performed using a Fast Fourier Transform). This gives you many options of plotting, but fundamentally allows you to visualise the distribution in frequency buckets of the magnitude of audio recorded. The below image is a frequency analysis of a segment of a clip recorded, in which the bumblebee is not buzzing, to show the background noise.
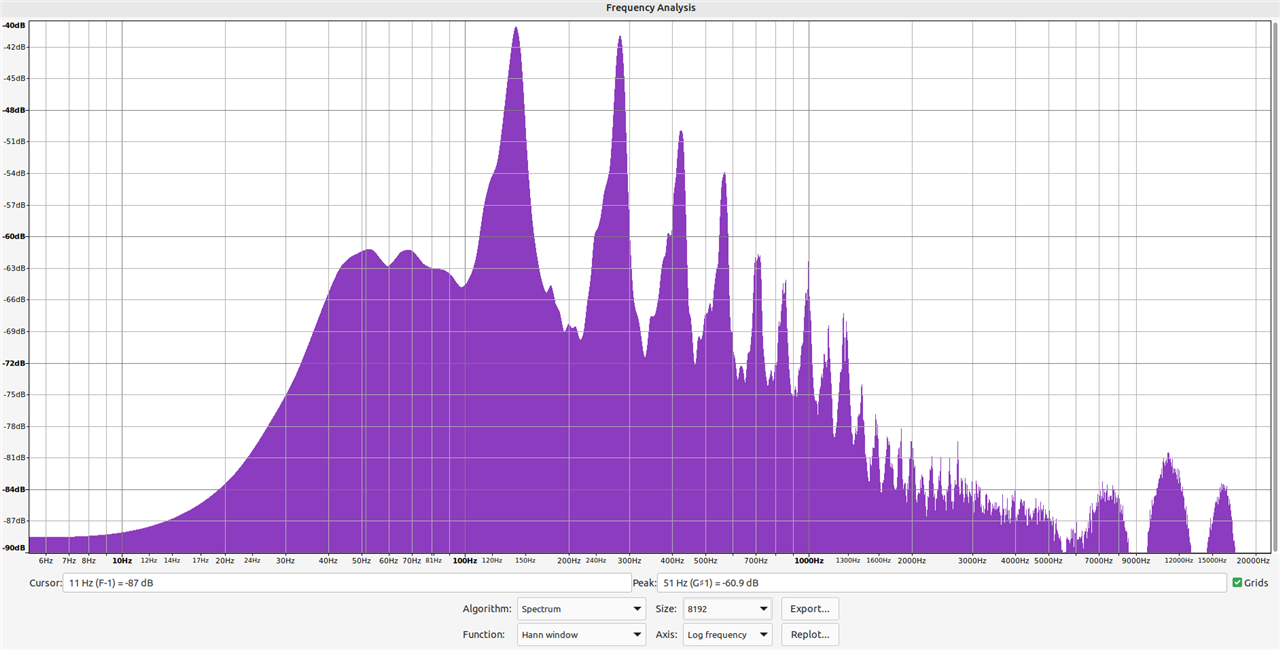
Now, a frequency analysis plot of another segment of the same clip, but in this the bumblebee takes off noisily from a flower.
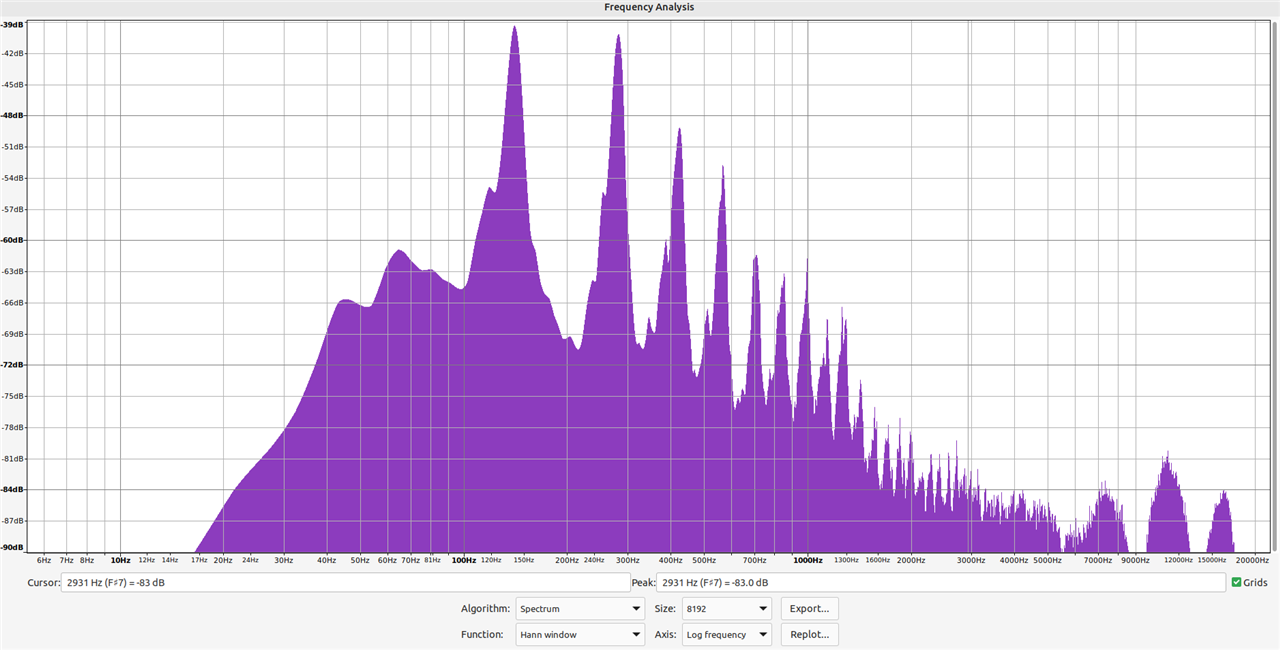
The presence of the bee's noise in the clip is clearly evident, with maximum amplitude being seen at c. 140Hz, with a secondary peak at c. 280Hz. I repeated this test on the other clips I'd recorded, as well as a compiled 30 minutes of audio of bumblebee flight which I had collated from different sources on the internet (valuable backup dataset, but not as useful as this includes different species of bumblebee from around the world, and hence will not be totally alike). Pleasingly, a very similar pattern was noticeable, but due to the different recording conditions and audio equipment used, those amplitude peaks were not necessarily at similar frequencies.
Frequency Analysis Repeatability
From the above work, I was confident that an audio classifier methodology based around frequency analysis from a Fast Fourier Transform on the Raspberry Pi Pico was a workable solution. It was also becoming apparent that while my sample datasets (recorded on my iPhone or collated from around the Internet) were invaluable in terms of proving the method, for my prototype sensor it would be necessary to build my own small dataset of example pollinator sound recordings using the same hardware as will be used in the prototype sensor itself. The reason for this is that will ensure that the shape of the recorded data from which the classifier algorithm will be based (e.g. look for peak in this frequency band, and this frequency band, of an amplitude greater than this value, and if these conditions are met then a positive classification is made), will be 100% representative of what the sensor itself will be seeing.
An example of this is as follows; the frequency plot below is of my self-recorded dataset of 10 clips of the Buff-Tailed Bumblebee in my garden, rolled into a single audio file, normalised, and analysed in Audacity. The pattern is already immediately recognisable by eye, with noticeable peaks of amplitude similar to the chart produced from a single recording above.
Now I have wired up my Adafruit PDM MEMS Microphone to the Pi Pico, and installed a program which allows the Pico to function as a USB microphone (reference). Recording directly into Audacity, I played the above audio clip into the microphone, effectively re-recording the clip. In Audacity, I then generated the below frequency plot:
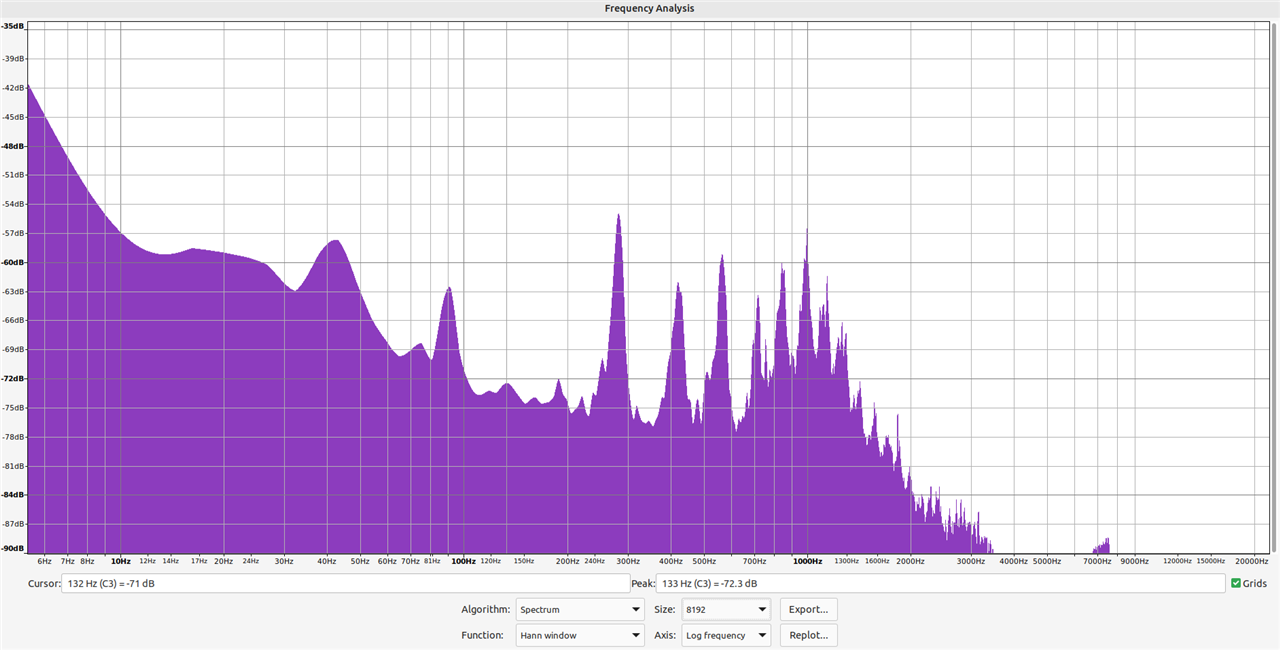
Clearly this is highly dissimilar to the previous plot, despite being derived from the same origin data. This is not unexpected; a different microphone is employed, the audio has also been reproduced on a speaker, rather than being directly recorded from the bee itself, and the level of noise in the clip will be greater. From this however there are two takeaway points;
1. To prove the audio classification algorithm using the Pi Pico, either audio must be sampled live (using the Pico's attached microphone) from a bee, or the Pico's microphone must be used to record a further dataset, on which the classification process can be tested, without recording any data.
2. To avoid the need for too many hours crouched in the garden, the first step should be to collect some sample audio using the Pico's microphone to allow development of the frequency analysis test in lab conditions, and then this should be verified 'in the field', a process in line with the original project plan.
Doesn't It All Just Sound Like Buzzing?
A perfectly reasonable comment at this point might be "Ok I see where you're going, this could detect the presence of buzzing, but lots of insects buzz - how do you know that it's specifically a bumblebee's buzz?".
Now until I've created the classification algorithm on the Pi Pico and tested this 'in the field', I cannot truly dispute this, but I am confident that it will be possible to be able to accurately discern a bumblebee from a wasp, for instance, or a fly. When doing background reading for this project back in April, I read a few different academic papers discussing the audio classification of insects. This paper, by Kawakita and Ichikawa, on the Automated classification of bees and hornets using acoustic analysis of their flight sounds uses a methodology reliant on the unique sound patterns of bees compared to other insects (as derived from the different wing morphology). It describes the successful development of a machine learning based system to identify bees by sound. Similarly, Chen et. al. in their paper discuss the classification of different insect species using audio - they use a different approach, but similarly their work is based on the existence of fundamental difference between the acoustic fingerprints of different insects.
Tuning the classification algorithm to discern a species by the location on the frequency spectrum of peaks is going to be very reliant on how repeatable the data is - do different recordings of the same species result in very similar acoustic fingerprints? If the algorithm looks at a too-narrow band of frequency for the tell-tale peaks, then it may result in false negatives if there is variability in the data. Conversely, a too-wide acceptable band of frequency for the tell-tale peaks, and this may risk false positives! Only time and testing will tell, but I am sure there will need to be a lot of iterations to make this as robust as possible.
Microphone Choice
There are multiple examples on the internet of Fast Fourier Transforms being performed on the Pi Pico on live audio. This, coupled with the above evidence that an FFT can demonstrate a noticeable acoustic fingerprint of a pollinator species, points towards this method of audio classification being entirely workable for this project. The next step will be to record a further dataset using the Pico's attached microphone, and from that look for a repeatable frequency test which can be used to differentiate the presence of a specific pollinator in an audio clip from a clip without the pollinator present.
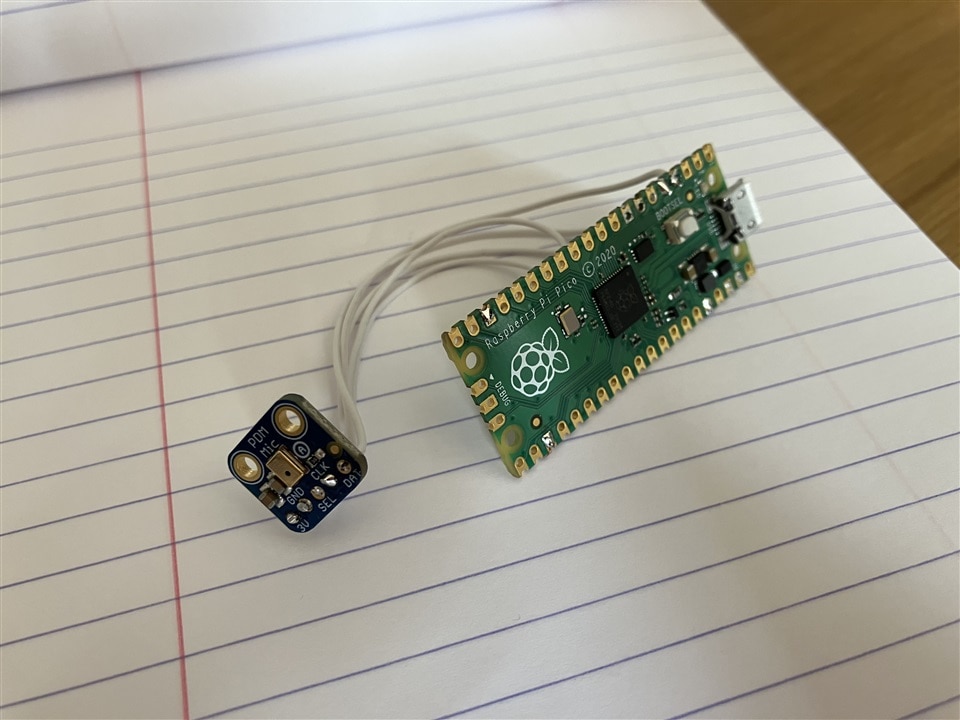
I have been using the Adafruit PDM MEMS microphone (see below), selected originally for its tiny form factor, good frequency range, and availability in the online component shops where I sourced the parts for this project. It has been easy to get this working with the Pico and fun playing around with it as a USB microphone in Audacity (no, I will not be sharing the karaoke tests that took place), but at this point I have decided at the 11th hour to substitute this for an analogue microphone, which I have ordered and is on its way. The reason for this is because given the limited time remaining until the project deadline, I need to focus my time as efficiently as possible. There are more detailed examples on the internet of FFTs and frequency analysis being performed on the Pi Pico with an analogue microphone, and adapting these to the PDM microphone is challenging (the process flow is very different, as examples with analogue microphones tend to being analysis on the data as soon as it is passed to the Pico's ADC, which is not part of the process flow for the PDM microphone).
Yet to Come
While awaiting the delivery of the substitute microphone, I will be focusing efforts on the mechanical build, as all 3D printed parts are ready for assembly, along with the other electrical parts which can be integrated now. I am relieved that I have what appears to be a viable alternative means of audio classification, but there's still quite a bit to do yet!
Thank you for reading this post, I've enjoyed following your builds too.


-

DAB
-
Cancel
-
Vote Up
0
Vote Down
-
-
Sign in to reply
-
More
-
Cancel
-

soldering.on
in reply to DAB
-
Cancel
-
Vote Up
0
Vote Down
-
-
Sign in to reply
-
More
-
Cancel
Comment-

soldering.on
in reply to DAB
-
Cancel
-
Vote Up
0
Vote Down
-
-
Sign in to reply
-
More
-
Cancel
Children