.png-1440x400x2.png?sv=2016-05-31&sr=b&sig=wQsYo1B0zBkfwM6srWgO%2BKR3kke9Fh%2Fobnvxo3f6k1g%3D&se=2026-07-29T23%3A59%3A59Z&sp=r&_=alK6vtGXN99oYdBllr69AQ==)
Pollinator Pollster (Powered by Pi)
In this, the final post for this project, I would like to firstly share with you the web domain for https://pollinatorpollster.cloud/, this is the website hosted on the Raspberry Pi 4 on which you can see the data collected by the prototype sensor. This Pi 4 receives the detection data from the Pico-powered sensor, saves and graphs it, then posts those charts to the site it hosts. Please bear in mind if this is getting many visitors it may run a little slower, but I will do my best to ensure it stays 'up' during this time.
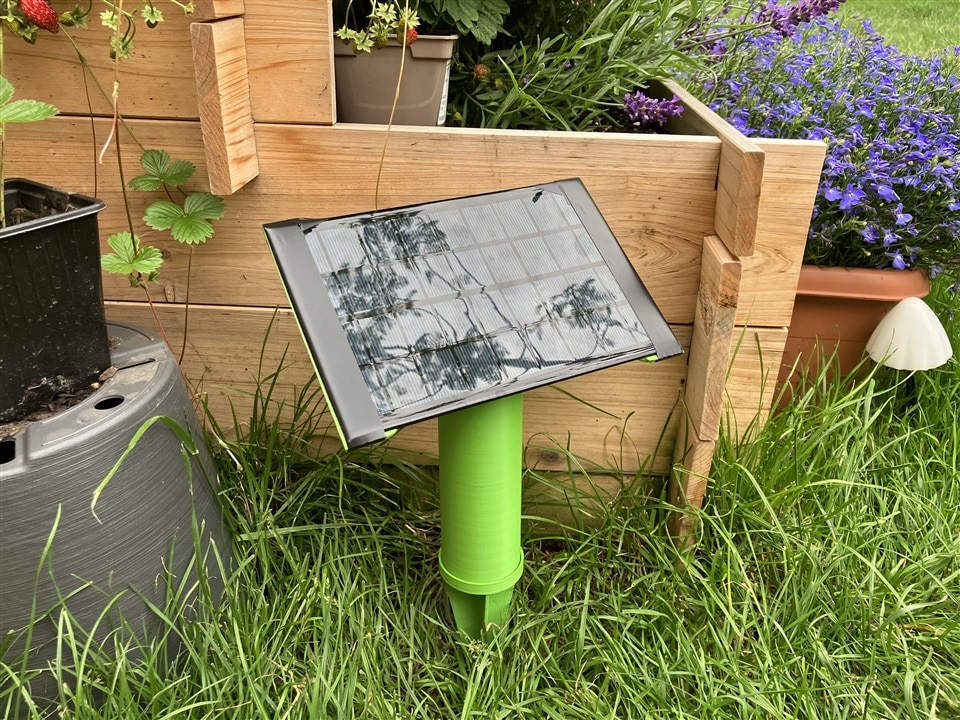
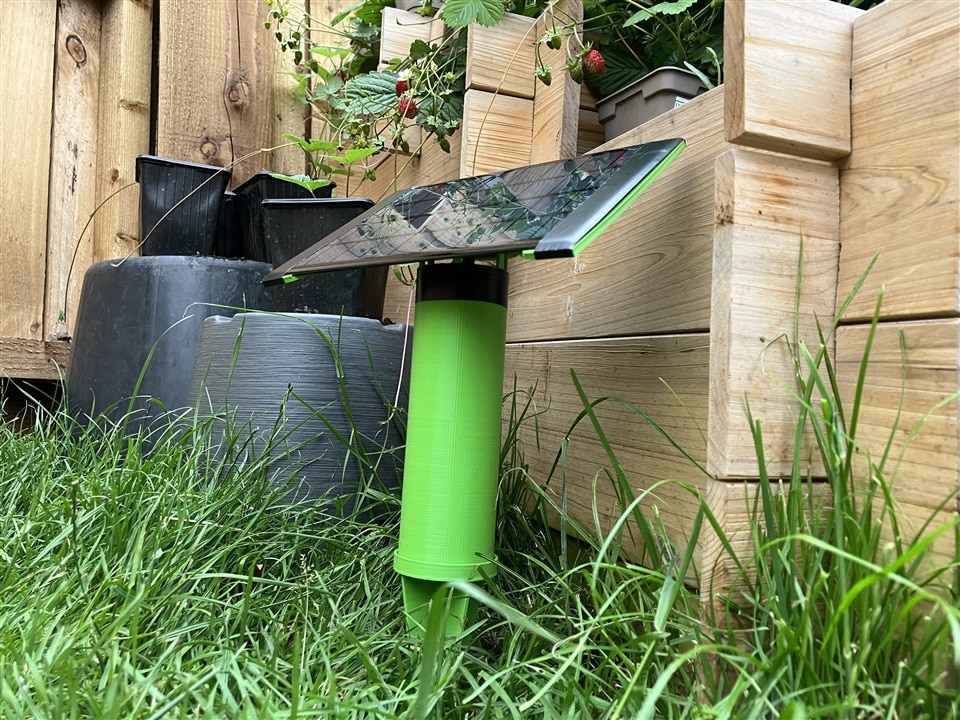
The prototype sensor is now set up in the garden, adjacent to lavender, strawberry, lobelia and daisy plants, all of which are in flower and see a lot of activity from bees and other insects so should be plenty to detect!
Summary Video
Please see the below video which is a demonstration of the fully working prototype system, and an explanation of how it works. You may need to use the 'Watch on YouTube' button to play it, depending on your browser, by pressing on the YouTube logo.
Where Did We Start?
In Part 1 of this blog series, the aim of the project was set out as "[...] to develop an automated remote monitoring system to detect pollinating insects via audio classification. Powered by Raspberry Pi, the system could provide 24/7 data from remote sites, which will permit scientists to augment human-collected data, aiding pollinator conservation."
I'd seen some interesting examples of Raspberry Pi being used in citizen science projects, and I was interested to apply it to conservation. After some research into citizen science monitoring schemes, bees seemed like an ideal subject, as at present large-scale studies of their populations are very dependent on human-based national counts. If an automated system could be developed using low-cost Raspberry Pi hardware, it might be able to augment the human-collected data with the potential for 24/7 monitoring in remote locations.
Audio classification seemed the right approach, as I encouraged by some research papers I found which suggested that the acoustic fingerprint of different insect groups, e.g. bees or bumblebees, are quite unique and distinguishable. I was interested to apply a machine learning method to the pollinator detection, likely using TensorFlow Lite on the Rasperry Pi Pico.
Where Did We End Up?
Early work on the audio classification process in April was entirely based around creating audio classifers using machine learning, utilising the TensorFlow Lite Model Maker library. This was selected as with transfer learning, an adaptation of the YAMNet deep neural network could be used, which in theory would provide good resilience against mis-identification with common ambient sounds heard in outdoor spaces, such as dogs barking as well as 511 other sounds classes. Unfortunately, a mid-project change of plan was needed in May, when support for TensorFlow Lite Model Maker was unexpectedly ended, resulting in it being incompatible with Python 3.10, and support for rolling-back to use Python 3.9 on Google Colab was stopped in Mid-May.
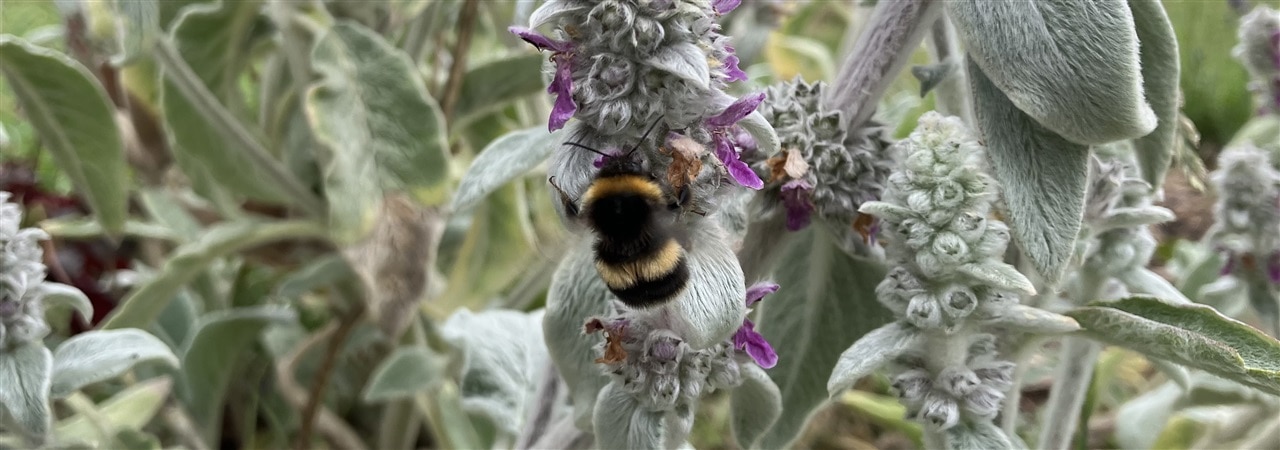
Thankfully there was a suitable alternative; the new method chosen was using a Fast Fourier Transform to perform a frequency analysis. By observation the maximum frequency recorded when a 'Buff-Tailed Bumblebee', Bombus terrestris (a bee species commonly seen in my garden and local park) was found (37.5Hz), and therefore this could be used as a detection algorithm, by comparing the maximum frequency observed within the Fast Fourier Transform output with that expected frequency (within a range).
Overall, I believe the prototype system has met the project goals, it couples a low-cost solar-powered sensor based around commonly available components within a 3D printed body, with a Raspberry Pi 4 which hosts a lightweight website that allows researchers to access the sensor data over the internet. The audio classification approach from initial tests appears reliable, as is the ability of the sensor to run continuously without power loss or loss of radio transmission between the sensor and hub. The usage of the HC-12 transceiver permits multiple sensors to be connected to the same hub whilst utilising the same frequency, as an identifier could be added to the transmitted messages to allow the hub to ascertain from which sensor data was received.
I am pleased that the system has come together in time for the contest deadline, but I am also aware that this is a first prototype with therefore some areas for improvement ~
Potential Improvements
There are some areas for improvement in the current sensor design, which I've listed, along with potential mitigations, below:
- Detection method: Relying on collection of audio data and identification of a dominant frequency which indicates the presence of a bee, the sensor is therefore vulnerable to audio interference such as passing traffic, human activity, or any other loud noises which could mask the acoustic fingerprint of the bee itself. The risk of this is low perhaps, given that nature reserves or farmland tend to be relatively quiet spaces, however to mitigate this the sensor must be installed as close as possible to location (e.g. flowering plant) where the bees are expected, as the the intensity of the sound decreases at the inverse square of the distance between the sound source and the microphone. If the surroundings are totally quiet, the detection range of the sensor will be greater, and vice versa.
- Radio interference: In all of my tests I have used Channel 1 of the HC-12 transceiver, which has a frequency of 433.4MHz. In the UK this can be used by the general public without a license, and hence carries the risk of interference. I have not experienced any interference during the testing, but that is likely due to the low population/industry density where I live. If interference was encountered when installing the sensor, it would be necessary to change the HC-12 channel on both receiver and transmitter, until an interference-free frequency was found.
- Server capacity: The NGINX server on the Pi 4 clearly cannot compete with commercial web hosting in terms of traffic capacity - if as envisaged the data is only to be accessed by a small group of researchers then it should be adequate, but it would be easy to give the site a 'hug of death' if it receives a large amount of traffic in a short space of time. The improvement to this would be to host the site using a commercial hosting service, with the Raspberry Pi 4 hub sending data to it, rather than also hosting the site.
- Species identification: While developing the prototype sensor, the audio classification has been focussed on a single species of bumblee, as this species is commonly seen in my garden and hence was a useful test subject. However to use the sensor more widely, thought needs to be given to the +270 species of bee seen in the UK (according to the Wildlife Trust). To add additional species to the detection algorithm, real-world frequency data would need to be captured for that each given species, to determine its acoustic fingerprint. If multiple species have highly similar acoustic fingerprints, the system would not be able to discriminate between them Given the significant differences in wing size and shape between major categories of pollinating insects, e.g. bumblebees, honey bees, flies, wasps, and moths, it seems most appropriate to develop the detection system to categorise a detection into one of those major categories, a task which could be done with a better success rate than aiming for individual species.
Last Words
Thank you very much for your interest, support, and suggestions throughout this project, I have found this an enormously interesting project to work on and have learned a lot along the way. Now the sensor is deployed and the website is live, I look forward to seeing what data is collected over the coming weeks, and if the detection is shown to have a good degree of reliability, I intend to contact my local Wildlife Trust and ask for permission to test the sensor at one of their nature reserves, as well as asking for their advice as to how best this system can be put to conservation use.
While collecting audio data for this project I've spent many hours crouched around plants, waving a microphone at everything that buzzes, squinting to read my laptop in the bright summer sunlight, and this has inevitably attracted some curiosity from passers-by! Managing to shrug off any self-consciousness of the slight ridiculousness of how I probably appeared, it was quite fun explaining the project to any interested passersby, and helping to spread the word for why pollinator conservation matters.
Thank you to element14 for giving me the Raspberry Pi 4 for this project, it is an awesome piece of kit, and I also have a new-found respect for the Pi Pico. This was my first time doing anything serious with the Pico, and although I have barely scratched the surface of its capabilities, it is an incredible board and I look forward to using it more in the future.
Good luck with your projects in the competition judging, and see you again in a future contest!
Appendices (Code)
I wanted to share all project code with you, but I have done some as images rather than using the code insertion tool, as using that on previous blog posts caused issues. I have not included the HTML/Python/CSS code used to create and run the website, as that is not the focus or innovative aspect of this project. If you are interested to learn more about that aspect of the project, in Part 3 of this blog series [posted 31st May 2023], I included a set of links to a good set of tutorials that can be used to create your own site using Flask and NGINX on the Pi.
Appendix 1: The Code Running on the Pi Pico
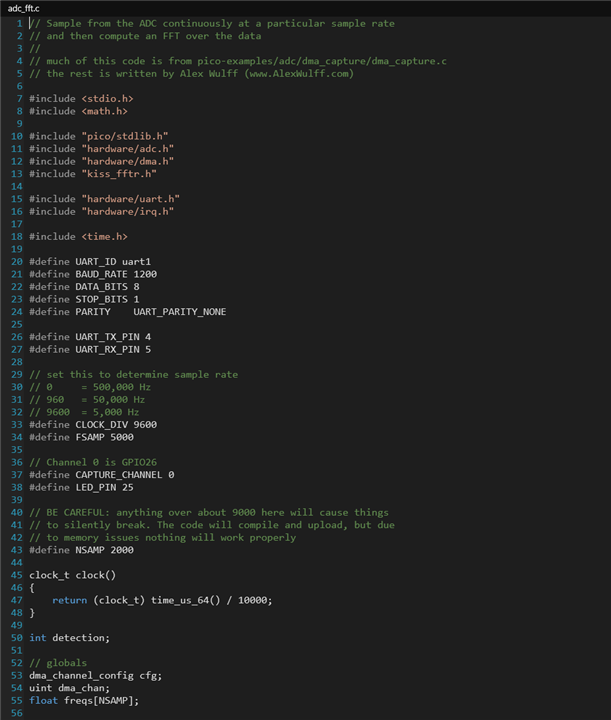
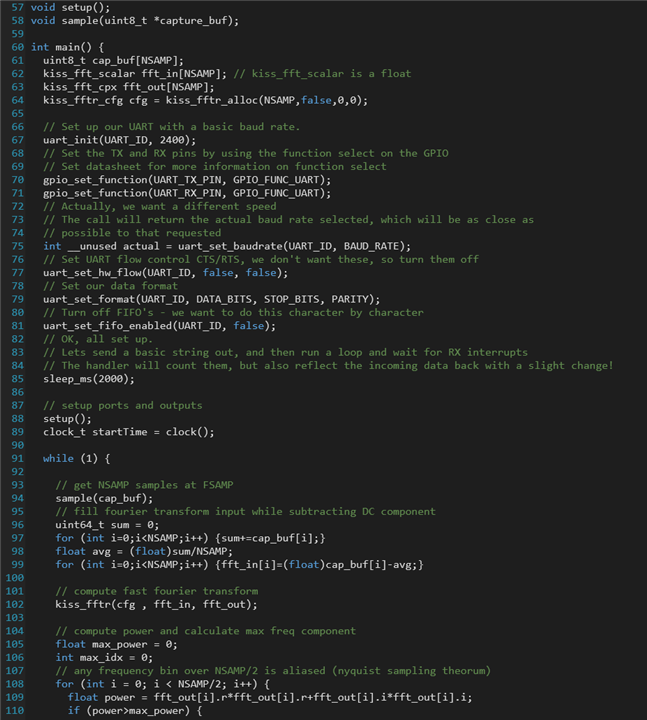
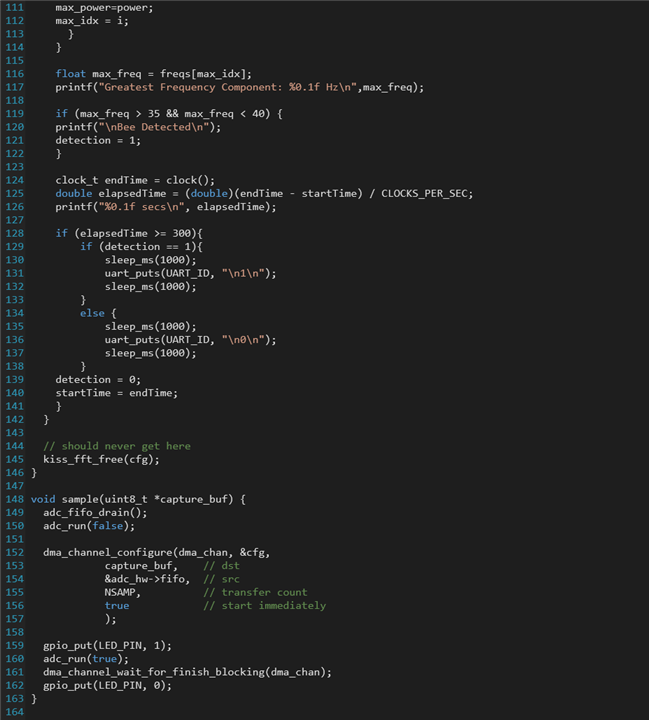
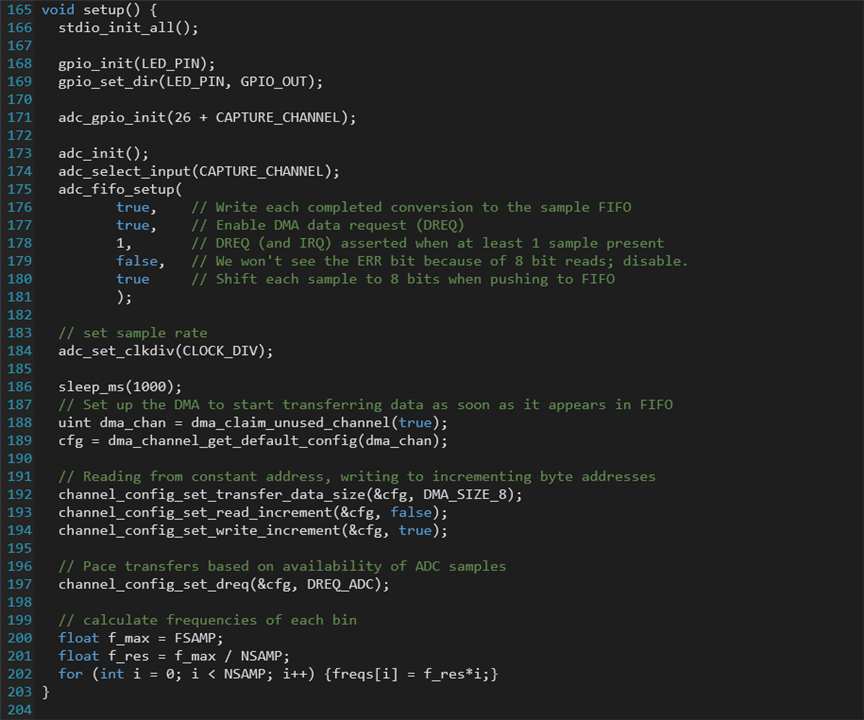
The C++ code which runs on the Pi Pico is shown in full below. This is explained in more detail in Part 7 of this blog series. It is based around C++ Fast Fourier Transform developed for the Pi Pico by Alex Wulff. On top of this is added a detection test, if the max_freq variable is within the 35 to 40Hz range it signifies the detection of a Buff-Tailed Bumblebee, which in field tests was found to exhibit a maximum frequency component of 37.5Hz. Every 5 minutes it then triggers the writing of the detection [1/0] to the Serial, which sends it to the attached HC-12 transceiver and sends it.
| {gallery:autoplay=false}Raspberry Pi Pico Code |
|---|
|
Code Part 1: Declaration, setup, and selection of FFT parameters. |
|
Code Part 2: Initiation of HC-12 code, and start of FFT process. |
|
Code Part 3: Includes detection algorithm and code to send data at 5 minute intervals. |
|
Code Part 4: Setup function. |
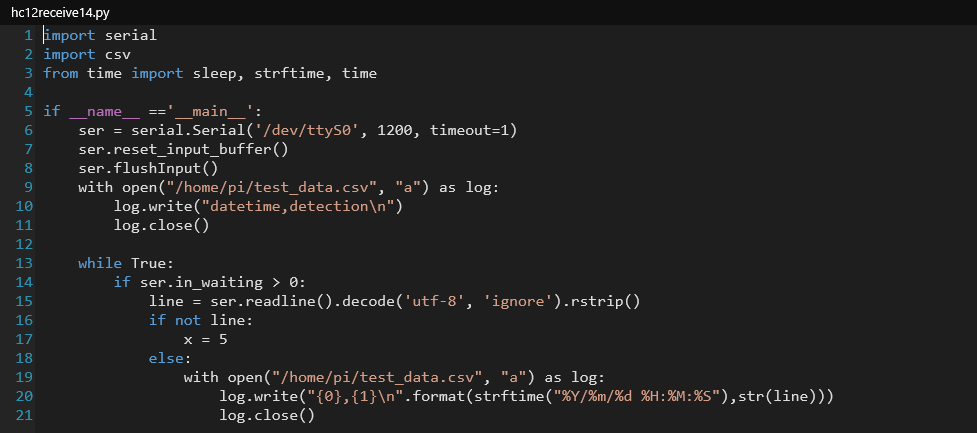
Appendix 2: The HC-12 Code Running on the Pi 4
This is automated on the Pi 4 as a systemd service, to run automatically on startup and continuously in the background. When first started it creates a new csv file and populates the header row. It is necessary to use 'sudo chown 777 test_data.csv' to change permissions for this csv file so that the graphing function (appendix 3) can also edit it. This code itself is relatively simple, if there is data waiting in serial it reads and decodes it, then writes it to the csv file. The more subtle aspects are some logical tests, firstly the use of 'ignore' within the ser.readline() function, this will skip over any data from serial which cannot be decoded (during testing this can happen occasionally if the HC-12 sends or receives a corrupted character). The 'ignore' function prevents that glitch from reaching the csv file, which would then cause problems as the graphing function would fail. The second test is whether there is any data within the line variable; the HC-12 can also occasionally produce a blank variable, which likewise would not be desirable to write this to the csv file and cause an inconsistency. Overall however, this has been shown to be quite reliable, opening and editing the csv file on a 5 minute basis with each receipt of sensor data.
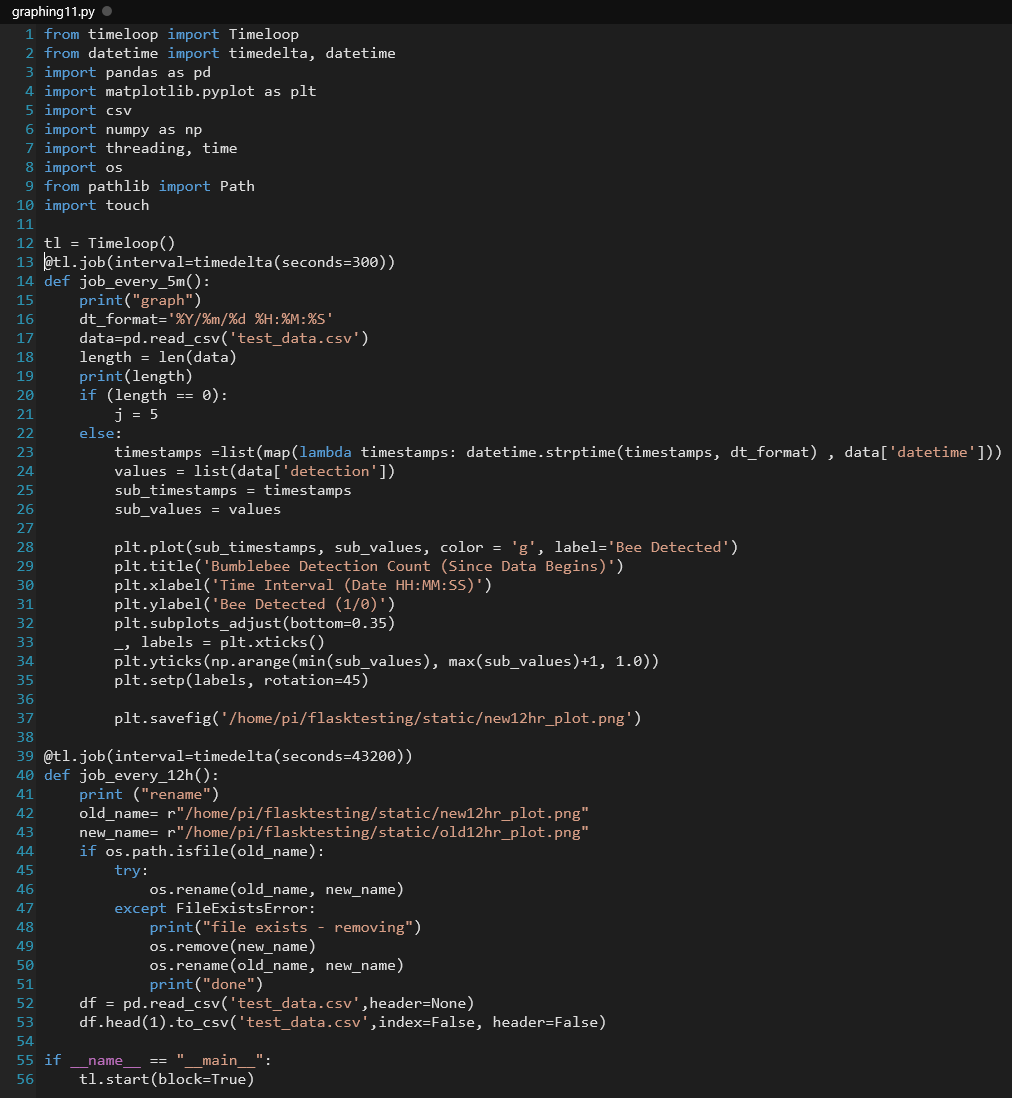
Appendix 3: The Graphing Code Running on the Pi 4
This is also automated on the Pi 4 as a systemd service, to run automatically on startup and continuously in the background. Code of note is the timeloop function, which calls different functions at a 5 minute and 12 hour interval. The 5 minute function updates a graph and places it within the static folder of the Flask directory, to reflect the latest data which has been received. The 12 hour function takes the latest graph and renames it to 'old12hr_plot'. It then goes into the test_data.csv file and deletes all rows except the headers. The purpose of this is so that on the website a regularly updating chart is shown first, which shows between 0 and 12 hours of data progressively, as well as a second chart below which shows the full data from the previous 12 hour time period, so a researcher accessing the site can see up to a 24 hour time window with a resolution of 5 minute intervals.