element14 Community
element14 Community
    Register Log In
  • Site
  • Search
  • Log In Register
  • Community Hub
    Community Hub
    • What's New on element14
    • Feedback and Support
    • Benefits of Membership
    • Personal Blogs
    • Members Area
    • Achievement Levels
  • Learn
    Learn
    • Ask an Expert
    • eBooks
    • element14 presents
    • Learning Center
    • Tech Spotlight
    • STEM Academy
    • Webinars, Training and Events
    • Learning Groups
  • Technologies
    Technologies
    • 3D Printing
    • FPGA
    • Industrial Automation
    • Internet of Things
    • Power & Energy
    • Sensors
    • Technology Groups
  • Challenges & Projects
    Challenges & Projects
    • Design Challenges
    • element14 presents Projects
    • Project14
    • Arduino Projects
    • Raspberry Pi Projects
    • Project Groups
  • Products
    Products
    • Arduino
    • Avnet & Tria Boards Community
    • Dev Tools
    • Manufacturers
    • Multicomp Pro
    • Product Groups
    • Raspberry Pi
    • RoadTests & Reviews
  • About Us
    About the element14 Community
  • Store
    Store
    • Visit Your Store
    • Choose another store...
      • Europe
      •  Austria (German)
      •  Belgium (Dutch, French)
      •  Bulgaria (Bulgarian)
      •  Czech Republic (Czech)
      •  Denmark (Danish)
      •  Estonia (Estonian)
      •  Finland (Finnish)
      •  France (French)
      •  Germany (German)
      •  Hungary (Hungarian)
      •  Ireland
      •  Israel
      •  Italy (Italian)
      •  Latvia (Latvian)
      •  
      •  Lithuania (Lithuanian)
      •  Netherlands (Dutch)
      •  Norway (Norwegian)
      •  Poland (Polish)
      •  Portugal (Portuguese)
      •  Romania (Romanian)
      •  Russia (Russian)
      •  Slovakia (Slovak)
      •  Slovenia (Slovenian)
      •  Spain (Spanish)
      •  Sweden (Swedish)
      •  Switzerland(German, French)
      •  Turkey (Turkish)
      •  United Kingdom
      • Asia Pacific
      •  Australia
      •  China
      •  Hong Kong
      •  India
      •  Japan
      •  Korea (Korean)
      •  Malaysia
      •  New Zealand
      •  Philippines
      •  Singapore
      •  Taiwan
      •  Thailand (Thai)
      •  Vietnam
      • Americas
      •  Brazil (Portuguese)
      •  Canada
      •  Mexico (Spanish)
      •  United States
      Can't find the country/region you're looking for? Visit our export site or find a local distributor.
  • Translate
  • Profile
  • Settings
Sci-Pi Design Challenge
  • Challenges & Projects
  • Design Challenges
  • Sci-Pi Design Challenge
  • More
  • Cancel
Sci-Pi Design Challenge
Blog Starting out! #1
  • Blog
  • Forum
  • Documents
  • Leaderboard
  • Polls
  • Files
  • Members
  • Mentions
  • Sub-Groups
  • Tags
  • More
  • Cancel
  • New
Join Sci-Pi Design Challenge to participate - click to join for free!
  • Share
  • More
  • Cancel
Group Actions
  • Group RSS
  • More
  • Cancel
Engagement
  • Author Author: Lannis
  • Date Created: 14 Jun 2023 11:25 AM Date Created
  • Views 328 views
  • Likes 5 likes
  • Comments 0 comments
Related
Recommended

Starting out! #1

Lannis
Lannis
14 Jun 2023

Hello everyone!

I apologize in advance for the late notice, and I realize that time is short as of now... I have been struggling quite a bit with university and my finals...

Nonetheless, I have been tinkering a bit with the raspberry pi!

I managed to set up the board and connect it to my monitor, keyboard and mouse just to be able to code.

image

My environment consists of the pi OS and VScode for coding (has a very nice extension that lets me compile C++ code with libraries like SDL).

What am I going to do, exactly?

Last semester I had a very fun (and stressful) elective called Introduction to Experimental Physics.

It was a very unique experience! However, quite cumbersome in some aspects... We had to use a weird online software to make graphs, plots and other stuff, and honestly it was quite the task to convert data from excel to the software and vice versa.. The software was also a website, which was REALLY annoying because sometimes we have no internet in the labs (this may not be a problem for ACTUAL labs, but for universities it may be a problem). Well I am sick of that!

Scientists aren't born, they are made! And if we can turn the learning process a bit more easy, why not? Why not build small data centers in labs for data collection, instead of relying on sudents' laptops with outdated software and/or licensed software? This is my main idea - to make a database for simple data-collection targeted for students in universities!

Since I am a bit short on time, I will be focusing on the software part - which I have been building upon for the last weeks (I am taking Computational Physics, and I will use some of the code that I wrote for this elective to build interactive UI tools).

How am I going to do it?

I will be programming mainly in C++ (which I am more acquainted with), using python if necessary. Coupled with C++, I will be using libraries for graphical display - SDL2, and *might* need to use scientific tools for C++ such as ROOT (by CERN) and Eigen (Linear systems library).

Minimal viable product

The UI will look something like this:

image

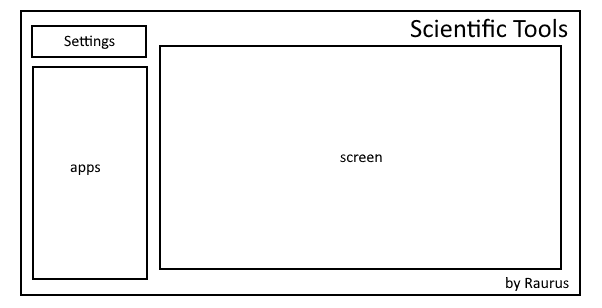
A settings button (to change resolution, style, etc), an apps list (with a list of all the apps I will be doing), and a main window, where all the fun happens - inserting UI elements such as buttons, input, etc.

The minimal applications I am planning to produce are as follows:

Plotter -> Given a data-set of 2 collumns and 2 arrays of bounds, the program represents a plot of points - OR - The program takes in a mathematical expression, number of variables, their names and respective axis bounds and plots a continuous function - This can be done to compare, for example, theoretical results with experimental results.

Derivative calculator -> Takes in a mathematical expressions and/or 2 collumns of data and calculates a derivative. for the mathematical expression case, we simply take an infinitesimal interval and calculate the slope (good enough approximation). In case of the data plot, a good first approximation would be to simply connect the points with linear functions - the derivative is the slope of the line.

Integrator -> Takes in a mathematical expressions and/or 2 collumns of data and calculates the integral. For both cases we simply use the trapezoidal rule.

Data Manager -> Allows for the creation of data tables - assigning titles, adding rows, adding collumns, creating new adjacent tables - and make operations between collumns (for example: collumn 1 is x, then collumn 2 is 2*x).

Error Calculator -> Given a variable A defined by n variables with e(n) associated errors, we calculate the relative error of A.

Here are some of the tools I will salvage for this project - https://github.com/lannisraurus/computational-physics

  • Sign in to reply
element14 Community

element14 is the first online community specifically for engineers. Connect with your peers and get expert answers to your questions.

  • Members
  • Learn
  • Technologies
  • Challenges & Projects
  • Products
  • Store
  • About Us
  • Feedback & Support
  • FAQs
  • Terms of Use
  • Privacy Policy
  • Legal and Copyright Notices
  • Sitemap
  • Cookies

An Avnet Company © 2026 Premier Farnell Limited. All Rights Reserved.

Premier Farnell Ltd, registered in England and Wales (no 00876412), registered office: Farnell House, Forge Lane, Leeds LS12 2NE.

ICP 备案号 10220084.

Follow element14

  • X
  • Facebook
  • linkedin
  • YouTube