


A few posts ago I plotted a map with the coordinates from the PSoC manually by creating a Google Docs Fusion table. Last night I finished a small script that post the data and a page to display the data.
The web part has three major components:
1. The web app (using Django, python)
2. The Rest Api (using Django rest framework, python )
3. Plotting the map (using Leaflet, javascript - using open street map data)
Oh and since it is in python you may run it anywhere, on your pc or on you Raspberry pi.
All code is on github, I commit as I go so it is not close to be organized but is on the line (online!).
Reads from PSoC into a text file
https://github.com/soynerdito/psoctracker/blob/master/test/import_bluetooth.py
Reads text file and sends it to the database
https://github.com/soynerdito/psoctracker/blob/master/test/gps_post.py
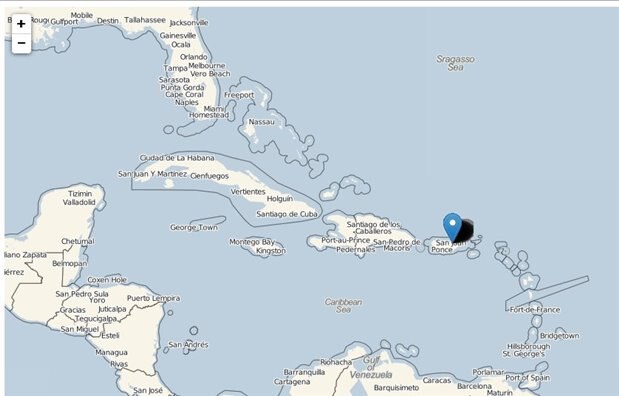
Here is a picture of the data I posted. In this example there are plenty of dots but all are close together because they were taken while I was programming with the GPS out the window. But you get the idea. Also for who didn't knew where Puerto Rico is, now you know. Boom!, extra info right there.
Note:
On another note, last night while I was sticking my hand with a CO sensor in the exhaust of the car it rained on me. I really enjoyed going outside with a laptop and a few cables for data gathering. It counts as an outside activity!


