


With the IMU working, I am now focusing my efforts on getting clean data, with an emphasis on simple to implement filters. That said, filtering is a dirty business, and it’s something that I am not too familiar with.
In any case, my plans for filtering are simple: high pass the gyro data to get rid of the drift, low pass the accelerometer and magnetometer data to remove the jerking inaccuracies. Hopefully, the data that comes out will be good enough for image stabilization. Unfortunately, I don’t have the proper software for simulating a nice FIR or IIR filter. I think an IIR higher than a 2nd order might be too much computation for 3 axis worth of data on a Cortex-M0 and relatively difficult to implement, though I am only basing this on a hunch and previous DSP experience on small microcontrollers. FIR might be a feasible option, but again, I’ll have to look into the software that can calculate the proper coefficients.
The simplest of these filters is a first order high pass and low pass filter. You can think of them as a special case of the IIR filter with a single coefficient. These are easy to implement, with minimal phase delay.
There’s no need to go into the derivations, and some basic information is available via Wikipedia (high-pass, low-pass). A cut off frequency is chosen using the following equation:
f = 1/(2*pi*tau)
Solving for tau:
tau = 1/(2*pi*f)
Next, we pick an alpha value using a sample period (dt) and tau, then implement an equation for sampled digital data, where y is the filtered data, and x is the input data. For the high pass:
alpha = tau/(tau + dt)
y[i] = alpha * y[i – 1] + alpha * (x[i] – x[i – 1])
For the low pass:
alpha = dt/(tau + dt)
y[i] = alpha * x[i] + (1 – alpha)*y[i – 1]
You are easily tell this is a case of the IIR since we are using previous output data (y[i – 1]). An FIR will use previous inputs, with not feedback from previous outputs. I decided to do a quick and dirty model of the filters on Excel. The Excel file is attached on this post. I didn’t have Matlab installed, so the only plot I have is the time domain response. Below is a screen shot:
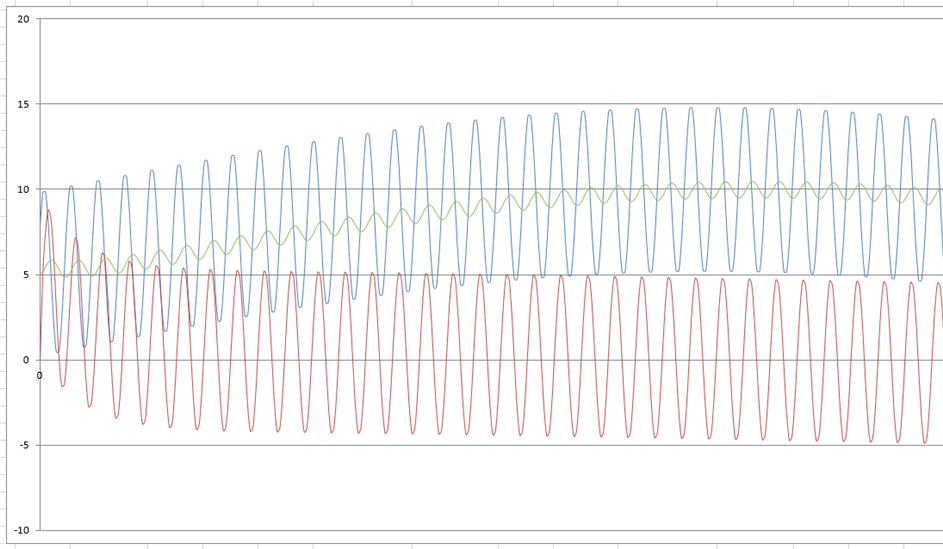
The blue signal is the original simulated data. It is a 1Hz sine plus a 100Hz sine along with a DC bias. The red line is the high pass filter, and the green line is the low pass filter. Cutoff frequency is set to 10Hz for both the high pass and low pass filters. There are several things worth noting.
There is noticeable phase shift in the data. This is expected since the filtering uses data from a previous output. The response has to be delayed. The hope is that the phase shift is small enough that the response to the motors not greatly affected.
DC bias is almost completely removed using the high pass filter. Of course this is on simulated data, so we won’t know how good the bias removal is until we can insert some real data into the filters.
Low pass signal has plenty of noise. Perhaps it is worth looking into a 2nd order IIR for the accelerometer. I don’t know yet how well the motors will response to the filtered data, so I will postpone designing a 2nd order IIR (like a 2nd order Butterworth) until I get the motors working.
So it seems like there’s still a lot of work to do. I will try to squeeze some real data as opposed to simulated data through the filters to see how they respond shortly. This is going to come down to the wire. I haven’t even looked into how to drive the motors yet.

