


Title: Total Player Monitoring
By: Md. Kamrul Hussain
Project Category: Design Challenge
Project Name: Sudden Impact Wearables Design Challenge
Blog post: 05
Intro:
In this blog post I would like to present my experiment on Heart Beat Rate detection from QRS complex of ECG signal. Here I have used a modified version of the algorithm developed by PAN and TOMPKINS [1985] and further described by HAMILTON and TOMPKINS [1986]. This algorithm has several steps -
- Filtering
- Slope detection
- Moving Window Integral
- Amplitude analysis
- Width analysis
Purpose:
The reasons behind selecting this algorithm -
- General threshold based beat detection can be suitable for a subject who is not moving frequently. But as this design challenge is intended to use it for players, so there will be motion artifacts, making it hard to implement the threshold of the QRS complex precisely. Therefore, we need an algorithm which is capable of detecting the Heart Beats in noisy environment with big motion artifacts.
- The amplitude and the baseline of the raw ECG varies person to person and its necessary to implement a post signal processing to significantly identify the QRS complex and remove the unwanted spikes to ensure precise beat detection. This algorithm is smart enough to do that.
- While doing so, its important that we can implement it in a microcontroller. This algorithm, suggested by PAN and TOMPKINS was particularly developed for real time analysis performed inside a mid range microcontroller.
Block Diagram:

Hardware:
AD8232 AFE EVAL MikroMedia dsPIC33EP from Mikroelektronika [used for demonstration purpose]


MikroMedia for dsPIC33EP is a development kit designed by MikroElektronika using Microchip's dsPIC33EP512MU810 microcontroller. I have used this small board to demonstrate the raw and processed signal at different stages using the TFT display. Later on I'll be using only a similar controller for my final design.
Sampling:
I have sampled the ECG output of AD8232 at 366 sps. This sampling rate is pretty good enough to reconstruct the ECG and suitable to display the full dynamic range of the signal on the onboard TFT display. Two separate crystal oscillators are used. 8MHz with PLL is used as main clock at 140MHz and 32.768KHz crystal is used for internal RTC to get the precise time duration between two heart beats.
STEPS:

Band Pass Filter:
The bandpass filter reduces noise in the ECG signal by matching the spectrum of the average QRS complex. It attenuates muscle noise, 50-Hz interference, baseline wander, and T-wave interference.
The pass band that maximizes the QRS energy is approximately in the 5 - 15 Hz range according to PAN and TOMPKINS [1985]. But what I have found in my case is that the sharp rise of the QR and fall of the RS wave shapes emphasis 12 - 16 Hz range. So, the designed bandpass filter using the DSP of the dsPIC33EP MCU has following parameters -
Filter Type - Bandpass FIR
Filter order - 32
Window - Bartlett (Triangle)
Passband1 - 8Hz
Passband2 - 20Hz
Sampling - 366Hz

Coefficients - [filter order + 1 = 33]
0x0000, 0xFF65, 0xFE98, 0xFDB6, 0xFCE6, 0xFC51,
0xFC20, 0xFC76, 0xFD6C, 0xFF0A, 0x0143, 0x03FB,
0x0701, 0x0A15, 0x0CEF, 0x0F42, 0x10C9, 0x0F42,
0x0CEF, 0x0A15, 0x0701, 0x03FB, 0x0143, 0xFF0A,
0xFD6C, 0xFC76, 0xFC20, 0xFC51, 0xFCE6, 0xFDB6,
0xFE98, 0xFF65, 0x0000
The output of the filter shows that -
The most noticeable result is the attenuation of the higher frequency spikes and ripples. Any 50-Hz noise or muscle noise present would have also been significantly attenuated.
The following images show the raw and filtered output in RED and GREEN plots respectively.
Body stays in stationary condition With body movements


Derivative:
After the signal has been filtered, it was then differentiated to provide information about the slope of the QRS complex. But the differentiated output fluctuates in both positive and negative directions according to the change of the filtered wave shape. But it reduces the amplitude of the rest of the signal significantly except the QRS complex. I have implemented the Derivative, Squared output and Moving Window Integral all together in one part. So I can't post the separated images of the individual output. For reference, I am sharing the expected output taken from PAN and TOMPKINS [1985].
Squaring Function:
The previous processes and the moving-window integration, which is explained in the next paragraph, are linear processing parts of the QRS detector. The squaring function that the signal now passes through is a nonlinear operation. The equation that implements this operation is -
y(nT) = [x(nT)]^2
This operation makes all data points in the processed signal positive, and it amplifies the output of the derivative process non linearly. It emphasizes the higher frequencies in the signal, which are mainly due to the QRS complex.In this operation the output of this stage is hard limited to a certain maximum level corresponding to the number of bits used to represent the data type of the signal.
Moving Window Integral:

The output of the squared function gives the significant difference for R slopes. But this information is not enough for noisy environment and motion artifacts as there can be other spikes rather than QRS complex. Also, squared output gives three spikes for Q, R ans S points. For detecting the QRS complex we need to represent it in one integral form which will produce one single pulse for the whole QRS complex.
An averaged moving window for a certain period can produce the desired output.

where N is the number of samples in the width of the moving window.
In this case, its necessary to carefully select the buffer length [N]. In general, the QRS complex has a duration of 80msec to 200msec. I have taken an approximate assumption of 150msec long window. Which represents a buffer length of about 55 for 366Hz sampling frequency. So, the equation can be written as -

The output of the moving window integral [GREEN wave shape] is given below with respect to the raw ECG signal [RED wave shape].
Body stays in Stationary condition With body movement


Now, it seems that the QRS complex is now represented as a well formed single pulse which can be significantly identified or separated even in noisy environment or in case of body movements.
But the amplitude of the moving window changes with the raw ECG wave shape. Therefore, a threshold has to be implemented.
Thresholding:
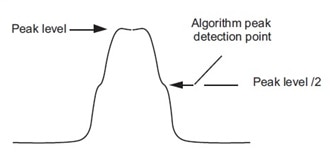
The set of thresholds that Pan and Tompkins (1985) used for this stage of the QRS
detection algorithm were set such that signal peaks (i.e., valid QRS complexes)
were detected. Signal peaks are defined as those of the QRS complex, while noise
peaks are those of the T waves, muscle noise, etc. After the ECG signal has passed
through the bandpass filter stages, its signal-to-noise ratio increases. This permits
the use of thresholds that are just above the noise peak levels. Thus, the overall
sensitivity of the detector improves.
Moreover, after implementing the amplitude threshold, the output becomes a square pulse, where the pulse duration can be calculated. So, a time threshold can be implemented to remove any unnecessary spike except QRS. A range of 80msec to 200msec can be used as the threshold for the duration of the pulse width.
Body is in stationary condition With body movements


The output showed that the algorithm is capable of detecting QRS complex out of all the noise and motion artifacts. Now the time duration between two consecutive pulses can be calculated to get the heart beat rate.
BEAT rate [BPM]:
An independent 32.768KHz crystal oscillator is used to clock the timer1 module of dsPIC33EP for RTC. This helps to calculate the beat rate precisely.
The 32.78KHz oscillator is prescaled by 8. So, we have a timer clock of 4096 Hz. Means 4096 clocks in a second.
So, the Beats Per Minute [BPM] will be -
BPM = [4096 / total count by timer1 between two pulses] * 60
Body is in resting condition With body movements


At the end of the experiment the BEAT rate was verified using a digital blood pressure monitor which can show the heart beat rate also.
The BP machine showed a heart rate of 80 BPM which was an averaged value and the real time output of the algorithm showed a heart rate of 79 - 85 BPM during the time period.


In my next blog, I'll post the full circuit design including the bluetooth. Whereas the TFT display and other unnecessary modules in the mikromedia board will be excluded.
Top Comments