It's funny how plans change when results come in that don't match the original hypotheses! Science!!
My plan for this blog post had been to check the air quality in the hallway that connects to our attached garage; However, after having completed a series of tests of the air quality in my office and in my garage, it appears that the cars may not be the greatest source of pollution in our garage and home.
So for this next part I've decided to monitor what was going on with the "fresh air" outside.
It is November on the West Coast, and the forecast is wet and chilly - so I adjusted the code accordingly, with 90% humidty and 3 degrees C as an expected average temperature for the next week or two.
I positioned the sensor outside in a sheltered place, away from doors and windows that might interfere. We have a metal gazebo on our deck that's the perfect place. Up high should keep it nice and dry out of the rain and wind. I kinda just hung it up by wrapping the USB power cord around a decoration in there.
I had to run an extension cord, so I decided to add some rain protection to the USB charger - the wind was blowing rain everywhere.
Wind Direction History is reported by our local weather station, which I think is by the airport not far from here. So I'll keep an eye on that to see if any interesting patterns appear.
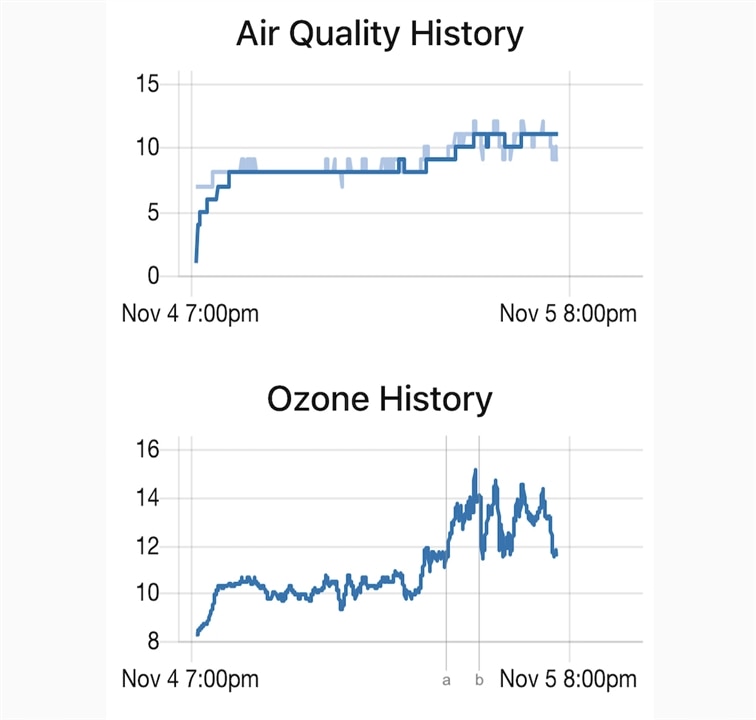
Looking at the chart for November 4 to 5, which is late Friday night and most of Saturday, I thought maybe the air quality might be related to the direction of the wind.

For most of the early part of the day, the wind was coming mainly from the West, with some variation to SouthWest and NorthWest, and ozone levels stayed around 10ppb.
However, at around 11am, which is just before line 'a' on the chart, the wind direction shifted to be from the NorthEast, after which the ozone levels went up significantly.
Then around 2pm, marked by line 'b', the wind shifted to North-NorthEast and ozone levels dropped - that sharp drop only lasted for about half an hour on the chart.
The wind then came from the North for a bit and then NNE again, which in the chart again is a sharp up and down.
When the winds returned to South and SouthWest later in the day, ozone levels dropped again.
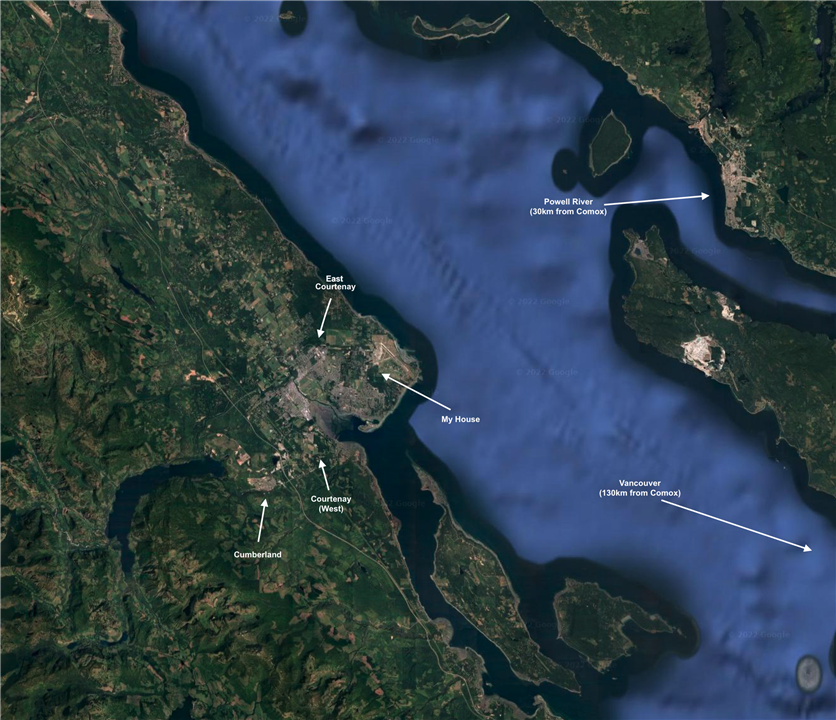
Let's see what Google Maps has to say about all this...

I've shown what I think are the major pollution centres in my area. I think Vancouver may be far enough away to not have an impact on us.
Powell River used to have a pulp mill, but I think that shut down just a year or two ago, so I don't expect that to have much impact anymore.
Winds from the NorthEast would possibly bring pollution from the airport, but straight North, and maybe NNW or NNE, might just miss the main action, giving us air mostly going over farmlands or ocean.
South and SouthWest are mostly Comox, which appears to be less of a pollution source when the wind is from that direction. That adds up, because traffic in Comox tends to not be as bad as Courtenay, and just a little bit further South is the water.
The other interpretation could simply be that on Saturdays traffic doesn't really pick up until the afternoon, and therefore ozone stays relatively level until the traffic gets heavier.
The bigger eye-opening take-away from this first day of data is that outdoor air quality tends to be worse than my indoor air quality, and far outweighs any air quality changes my car makes to my garage or home, during regular use.
During my longer duration testing of my home and garage, ozone tended to be around 10 or 11, maybe a little lower for the garage, but for the outside air, that level marks the lower limits of the reported ozone concentrations.
The AQI is generally a few notches higher too.
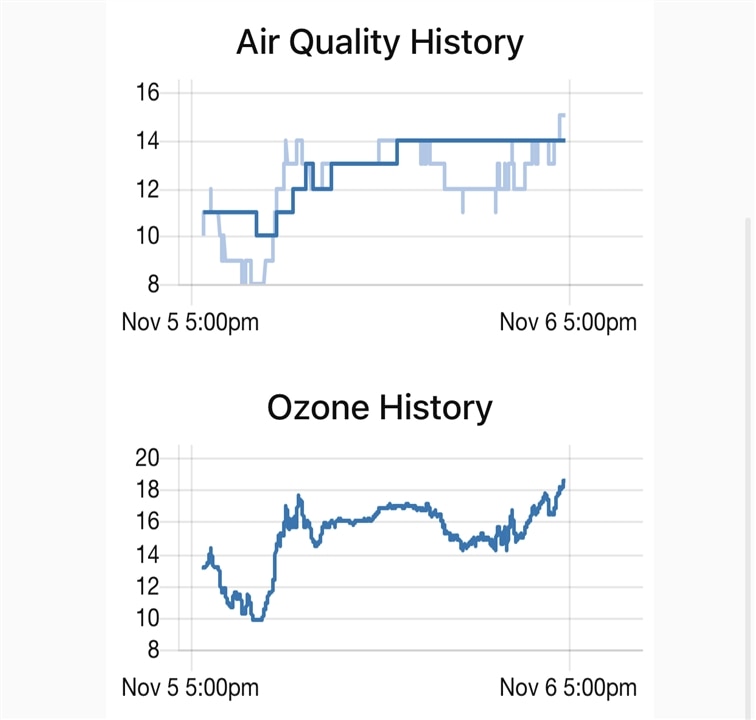
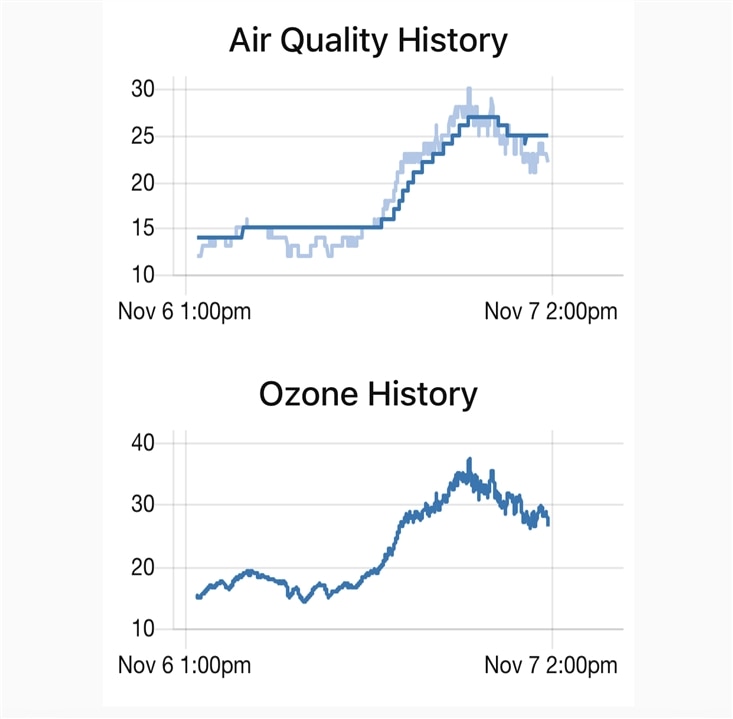
The next few days were not any better. For the weekend of November 5 and 6, the AQI and ozone levels kept creeping upward!

And then, as the weather got colder I guess furnaces and woodstoves started going, because air quality numbers went way up!

It seemed to peak Nov 8th (Tuesday) in the morning:

Thankfully, the air cleared up a fair bit in the afternoon:

One interesting note is that the sharp downward line coincides with the winds shifting to NNW (North-North-West), which on the map is up and slightly to the left of us, which possibly means the pollution from East Courtenay as well as from the airport misses us.
This part of the experimenting was probably the most eye-opening experience of the whole project!
Who knew there was so much pollution out there. In my mind this was still the small town I moved to over 30 years ago, but it has definitely become busier - and more polluted - since then.
On the bright side, our ozone levels are still considered "low" in that range, just not in the super-clean "very low" class anymore.
And our AQI levels are also still considered to be "good", with values staying under 50.

