element14 Community
element14 Community
    Register Log In
  • Site
  • Search
  • Log In Register
  • About Us
  • Community Hub
    Community Hub
    • What's New on element14
    • Feedback and Support
    • Benefits of Membership
    • Personal Blogs
    • Members Area
    • Achievement Levels
  • Learn
    Learn
    • Ask an Expert
    • eBooks
    • element14 presents
    • Learning Center
    • Tech Spotlight
    • STEM Academy
    • Webinars, Training and Events
    • Learning Groups
  • Technologies
    Technologies
    • 3D Printing
    • FPGA
    • Industrial Automation
    • Internet of Things
    • Power & Energy
    • Sensors
    • Technology Groups
  • Challenges & Projects
    Challenges & Projects
    • Design Challenges
    • element14 presents Projects
    • Project14
    • Arduino Projects
    • Raspberry Pi Projects
    • Project Groups
  • Products
    Products
    • Arduino
    • Avnet Boards Community
    • Dev Tools
    • Manufacturers
    • Multicomp Pro
    • Product Groups
    • Raspberry Pi
    • RoadTests & Reviews
  • Store
    Store
    • Visit Your Store
    • Choose another store...
      • Europe
      •  Austria (German)
      •  Belgium (Dutch, French)
      •  Bulgaria (Bulgarian)
      •  Czech Republic (Czech)
      •  Denmark (Danish)
      •  Estonia (Estonian)
      •  Finland (Finnish)
      •  France (French)
      •  Germany (German)
      •  Hungary (Hungarian)
      •  Ireland
      •  Israel
      •  Italy (Italian)
      •  Latvia (Latvian)
      •  
      •  Lithuania (Lithuanian)
      •  Netherlands (Dutch)
      •  Norway (Norwegian)
      •  Poland (Polish)
      •  Portugal (Portuguese)
      •  Romania (Romanian)
      •  Russia (Russian)
      •  Slovakia (Slovak)
      •  Slovenia (Slovenian)
      •  Spain (Spanish)
      •  Sweden (Swedish)
      •  Switzerland(German, French)
      •  Turkey (Turkish)
      •  United Kingdom
      • Asia Pacific
      •  Australia
      •  China
      •  Hong Kong
      •  India
      •  Korea (Korean)
      •  Malaysia
      •  New Zealand
      •  Philippines
      •  Singapore
      •  Taiwan
      •  Thailand (Thai)
      • Americas
      •  Brazil (Portuguese)
      •  Canada
      •  Mexico (Spanish)
      •  United States
      Can't find the country/region you're looking for? Visit our export site or find a local distributor.
  • Translate
  • Profile
  • Settings
Summer of Sensors Design Challenge
  • Challenges & Projects
  • Design Challenges
  • Summer of Sensors Design Challenge
  • More
  • Cancel
Summer of Sensors Design Challenge
Blog In The Air Tonight - Storing Data and Adding Graphs
  • Blog
  • Forum
  • Documents
  • Design Challenge
  • Leaderboard
  • Polls
  • Files
  • Members
  • Mentions
  • Sub-Groups
  • Tags
  • More
  • Cancel
  • New
Join Summer of Sensors Design Challenge to participate - click to join for free!
  • Share
  • More
  • Cancel
Group Actions
  • Group RSS
  • More
  • Cancel
Engagement
  • Author Author: ntewinkel
  • Date Created: 26 Oct 2022 5:11 AM Date Created
  • Views 611 views
  • Likes 8 likes
  • Comments 2 comments
  • zmod4510-evk
  • zmod4510
  • air quality
  • Summer of Sensors Design Challenge
  • node-red
  • renesas
  • summer of sensors
  • influxdb
  • In the Air Tonight
  • aqi
  • sensor
Related
Recommended

In The Air Tonight - Storing Data and Adding Graphs

ntewinkel
ntewinkel
26 Oct 2022
In The Air Tonight - Storing Data and Adding Graphs

At the end of my previous blog post, my Arduino board was sending real data from the ZMOD4510 sensor, via MQTT, to my Node-Red server, which then allowed me to view the results on a dashboard that shows all of the values. However, it's always a good thing to be able to go back and view trends over the course of a day, or maybe days or weeks or longer.

So the next step is to save the incoming data, and set up some graphs to show the values over the course of the day.

The first thing that was required to accomplish that goal was to save the data in InfluxDB to store all of the values, and thankfully that's almost automatic: just having a database is enough - the individual bits of information are stored automatically as they come in from Node-Red. Node-Red does the work of talking to the database. Since I already had InfluxDB set up with a "sensors" database for my hummingbird monitoring sensors, I didn't actually have to do anything in InfluxDB to get it ready.

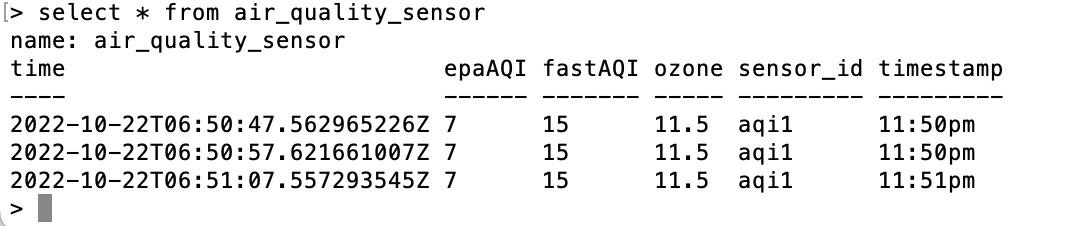
In Node-Red I simply added a node that saves the data as it comes in. It has a built-in InfluxDB node for that. In the Node all I had to do was specify a new name for the set of measurements. I named it "air_quality_sensor". The Node then just sends the data from the flow straight to InfluxDB, which stores the data. Quite easy actually. No complex SQL or special coding required!

After running the test sketch to send some sample data to the server, I was able to verify that the data was being stored properly:

InfluxDB showing sensor data

Once that was done, I went back into Node-Red to add the graphs to track how the information changes over time.
This was not too different from the graphs I had previously built for my hummingbird feeder monitoring system, so I was thankfully able to copy and modify my existing nodes without too much pain.

Node-Red flow to save and show sensor data

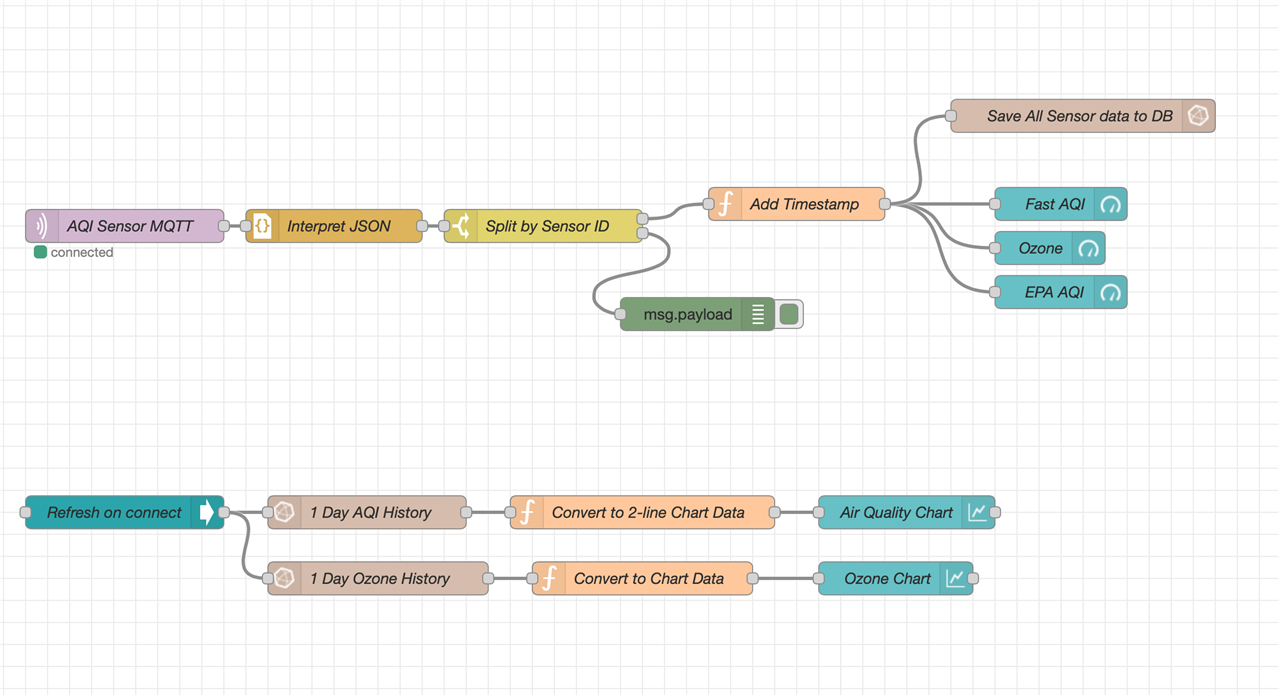
Since I didn't actually get real temperature and humidity data, I decided to remove those gauges, and also to not send those values from the sensor or store those values in the database. It would be easy to add that back in if I decided to add the extra sensor in the future.

After running the sensor for about a day in my office, this is what my dashboard now looks like, complete with the daily graphs. For my project, daily graphs should be enough to see if any fluctuations happen around the time we use the vehicles. (Hovering over a data point shows the details - I've done that for this screen capture to this to help identify the lines)

First day of air quality sensor data

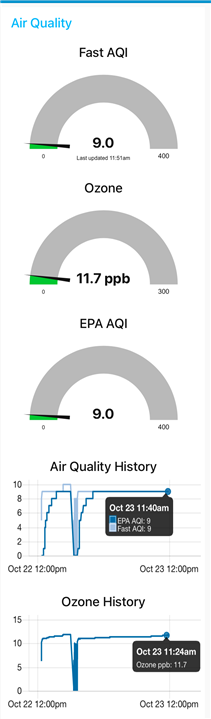
The charts show when I started data collection: in the dips at the start, and when I re-started data collection, by the middle dips. I re-started data collection because for the first while I had it plugged into my computer so I could look at the debug data on the Arduino Serial Monitor. I then moved it away from my computer and plugged it into a USB charger to run it independently.

This finishes the building and coding part of the project!

Now I need to run it for a few weeks in a few different places to see what kind of data it collects.

I've attached the node-red flow export to this blog post

NodeRed_InTheAirTonight_export.json.zip

  • Sign in to reply
  • DAB
    DAB over 2 years ago

    Nice post Nico.

    It will be interesting to see what the data reveals over time.

    • Cancel
    • Vote Up 0 Vote Down
    • Sign in to reply
    • More
    • Cancel
  • dougw
    dougw over 2 years ago

    Well done. Looks like a clean job, no pun intended.

    • Cancel
    • Vote Up 0 Vote Down
    • Sign in to reply
    • More
    • Cancel
element14 Community

element14 is the first online community specifically for engineers. Connect with your peers and get expert answers to your questions.

  • Members
  • Learn
  • Technologies
  • Challenges & Projects
  • Products
  • Store
  • About Us
  • Feedback & Support
  • FAQs
  • Terms of Use
  • Privacy Policy
  • Legal and Copyright Notices
  • Sitemap
  • Cookies

An Avnet Company © 2025 Premier Farnell Limited. All Rights Reserved.

Premier Farnell Ltd, registered in England and Wales (no 00876412), registered office: Farnell House, Forge Lane, Leeds LS12 2NE.

ICP 备案号 10220084.

Follow element14

  • X
  • Facebook
  • linkedin
  • YouTube