Table of Contents
- Blood Oxygen Saturation
- Pulse Oximetry
- Oximeter 5 Click
- Heart Rate Measurement
- Oxygen Level Measurement
- The Oximeter 5 Click Hardware Overview
- Getting Started With Oximeter 5 Click
- Installing Library
- Testing the Sensor - Reading Rad & IR
- Measuring Heart-Rate (BPM)
- Measuring Oxygen Saturation (SpO2)
- Conclusion
Introduction
This is going to be the second post for Summer of Sensors Design Challenge. In this blog I will try to experiment with mikroelektronika Oximeter 5 Click. But before going to the hardware first I will discuss about the oxygen saturation and pulse oximetry in a brief. If you like you can jump to nay section from the table of content section.
Your oxygen saturation (blood oxygen level) is the amount of oxygen you have circulating in your blood. Oxygen is essential to life, and our bodies need a certain amount of oxygen to function properly. Oxygen enters our body through our nose or mouth when we breathe (inhale) and passes through our lungs into our bloodstream. Once in our bloodstream, the oxygen then goes to cells all over our body. All of our cells need oxygen to create energy efficiently, and our body needs the energy to fulfill all of its processes, such as digestion and even thinking.
Our body tightly regulates the amount of oxygen saturation in our blood, because low blood oxygen levels (hypoxemia) can lead to many serious conditions and damage to individual organ systems, especially our brain and heart. Low blood oxygen levels indicate that our lungs and/or circulatory system may not be working as they should.
There are two main ways to measure or test blood oxygen levels:
- blood draw test
- pulse oximetry (using an oximeter)
In this project, we will measure oxygen saturation using the pulse oximetry technique.
A pulse oximeter can measure blood oxygen saturation levels through a small clip that’s usually placed on your finger or toe. An oximeter reading only indicates what percentage of your blood is saturated with oxygen, known as the SpO2 level, as well as your heart rate. It’s a quick and harmless way to check if someone’s blood oxygen level is too low.
Healthcare providers use pulse oximeters frequently in hospitals. You can also use a pulse oximeter at home.
Oximeter 5 Click is a compact add-on board suitable for measuring blood oxygen saturation. This board features the MAX30102, integrated pulse oximetry, and heart-rate monitor module from Analog Devices. The MAX30102 includes internal LEDs, photodetectors, optical elements, and low-noise electronics with ambient light rejection. It operates on a single 1.8V power supply acquired from both mikroBUS power rails for the internal LEDs, communicating through a standard I2C compatible interface. The MAX30102 can be shut down through software with zero standby current, allowing the power rails to remain powered at all times. This Click board makes it an excellent choice for optical pulse oximetry and health monitoring applications.
The MAX30102, or any optical pulse oximeter and heart-rate sensor for that matter, consists of a pair of high-intensity LEDs (RED and IR, both of different wavelengths) and a photodetector. The wavelengths of these LEDs are 660nm and 880nm, respectively. The MAX30102 works by shining both lights onto the finger or earlobe (or essentially anywhere where the skin isn’t too thick, so both lights can easily penetrate the tissue) and measuring the amount of reflected light using a photodetector. This method of pulse detection through light is called Photoplethysmogram.
The working of MAX30102 can be divided into two parts:
- Heart Rate Measurement and
- Pulse Oximetry (measuring the oxygen level of the blood).
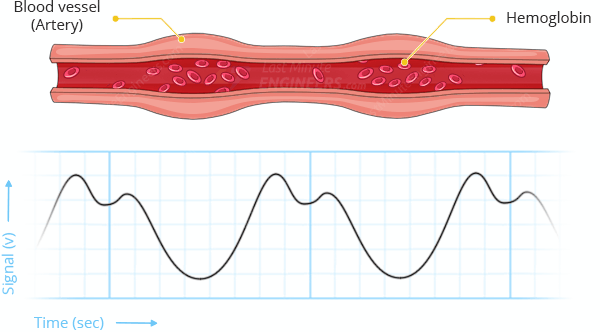
The oxygenated hemoglobin (HbO2) in the arterial blood has the characteristic of absorbing IR light. The redder the blood (the higher the hemoglobin), the more IR light is absorbed. As the blood is pumped through the finger with each heartbeat, the amount of reflected light changes, creating a changing waveform at the output of the photodetector. As you continue to shine light and take photodetector readings, you quickly start to get a heart-beat (HR) pulse reading.
Pulse oximetry is based on the principle that the amount of RED and IR light absorbed varies depending on the amount of oxygen in your blood. The following graph is the absorption-spectrum of oxygenated hemoglobin (HbO2) and deoxygenated hemoglobin (Hb).

As you can see from the graph, deoxygenated blood absorbs more RED light (660nm), while oxygenated blood absorbs more IR light (880nm). By measuring the ratio of IR and RED light received by the photodetector, the oxygen level (SpO2) in the blood is calculated.
The Oximeter 5 Click Hardware Overview
Oximeter 5 Click as its foundation uses the MAX30102, a high-sensitivity pulse oximeter and heart-rate sensor from Maxim Integrated, now part of Analog Devices. The MAX30102 integrates Red and IR LEDs, with 660nm red and 880nm IR wavelengths, to modulate LED pulses for oxygen saturation (SpO2) and heart rate measurements. The LED pulse width can be programmed to allow the algorithm to optimize SpO2 and HR accuracy and power consumption based on use cases.
The SpO2 subsystem of the MAX30102 contains ambient light cancellation (ALC), a continuous-time oversampling sigma-delta ADC with 18-bit resolution, and a proprietary discrete-time filter. The ALC has an internal Track/Hold circuit to cancel ambient light and increase the effective dynamic range. The MAX30102 also has an on-chip temperature sensor with an inherent resolution of 0.0625°C for calibrating the temperature dependence of the SpO2 subsystem.
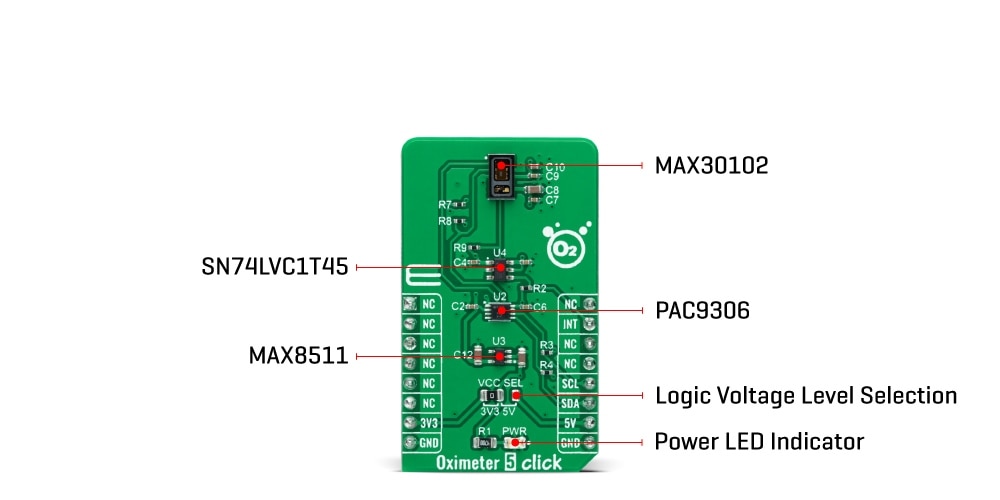
The MAX30102 does not require a specific Power-Up sequence but requires a supply voltage of 1.8V to work correctly. Therefore, a small regulating LDO is used, the MAX8511, providing a 1.8V out of both 5V and 3.3V mikroBUS power rails. Also, it can be shut down through software with zero standby current, allowing the power rails to remain powered at all times.
Oximeter 5 Click communicates with MCU using the standard I2C 2-Wire interface with a maximum clock frequency of 400kHz. It is fully adjustable through software registers, and the digital output data is stored in a 32-deep FIFO within the device. Since the sensor for operation requires a power supply of 1.8V, this Click board also feature the PCA9306 and SN74LVC1T45 voltage-level translators. The I2C interface bus lines are routed to the voltage-level translators allowing this Click board
to work with both 3.3V and 5V MCUs properly. Also, it uses an interrupt pin, the INT pin of the mikroBUS
socket, used for when an interrupt occurs, after the power is established, to alert the system that the MAX30102 is ready for operation.
This Click board can operate with both 3.3V and 5V logic voltage levels selected via the VCC SEL jumper. This way, it is allowed for both 3.3V and 5V capable MCUs to use the communication lines properly. However, the Click board
comes equipped with a library containing easy-to-use functions and an example code that can be used, as a reference, for further development.
One of the most important features of the MAX30102 is its low power consumption: the MAX30102 consumes less than 600μA during measurement. Also, it is possible to put the MAX30102 in standby mode, where it consumes only 0.7μA. This low power consumption allows implementation in battery-powered devices such as handsets, wearables, or smartwatches.
To know more details about the Oximeter 5 Click please visit official https://www.mikroe.com/oximeter-5-click
Getting started with Oximeter 5 Click
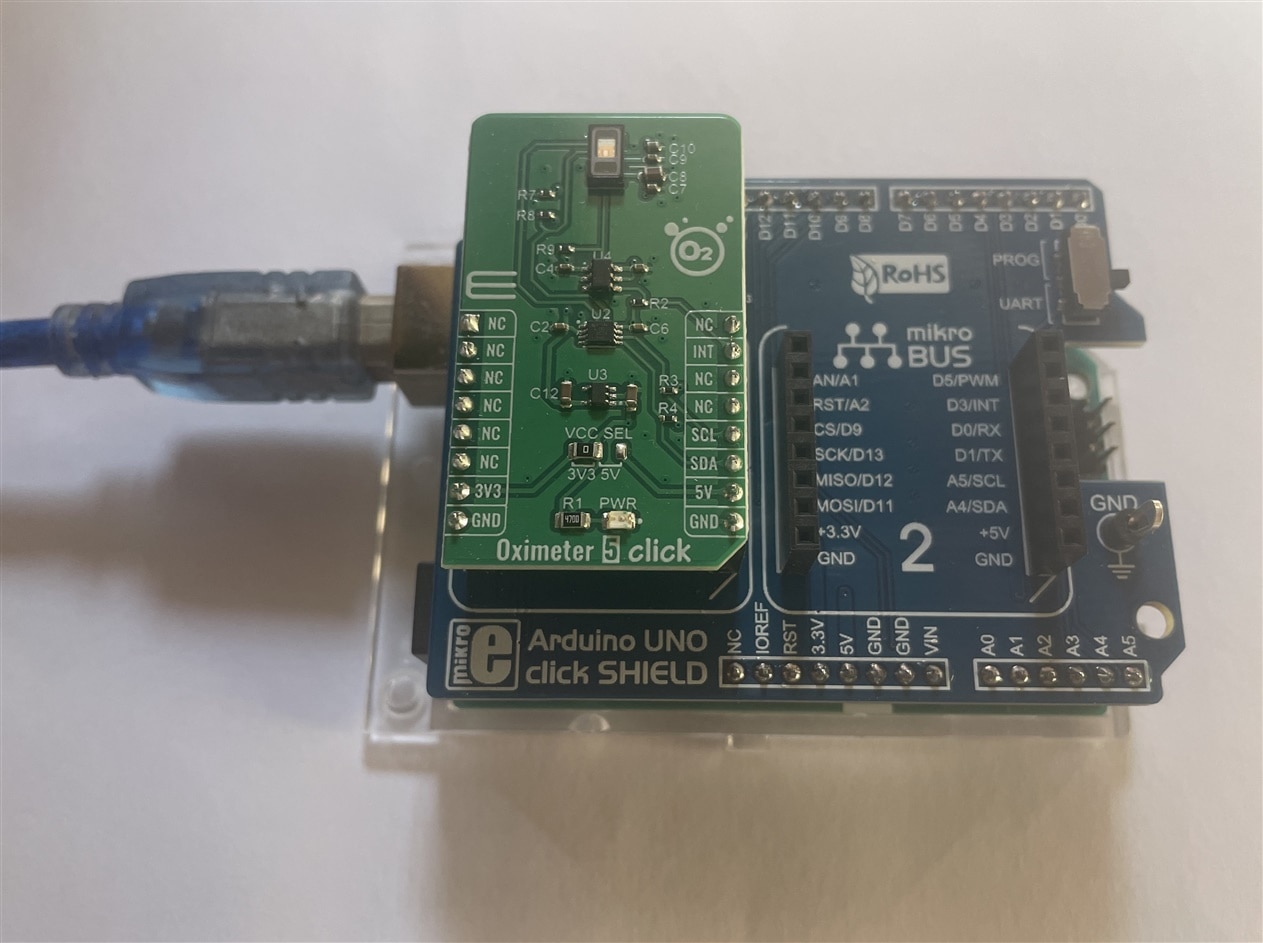
We have gathered enough knowledge about pulse oximetry and the oximeter 5 click. Now we can begin hooking it up to our Arduino board. Before programming, we need to connect the oximeter 5 click to our Arduino Uno board. The best way to connect any click board with Arduino is to use Arduino Uno Click Shield which I am going to use in this project. This module transfer data through a standard I2C bus. The shield has 2 Click slot and we can use any of them for connecting the oximeter 5 click. After placing the oximeter 5 click to the click shield it will be connected to Arduino through the standard I2C port of the Arduino.
There are several libraries available for the MAX30102 sensor. However, in this example, I am using the one by SparkFun Electronics. This library exposes most of the features of the MAX30102 and offers simple and easy-to-use functions to calculate pulse rate and SpO2. You can download this library from within the Arduino IDE Library Manager.
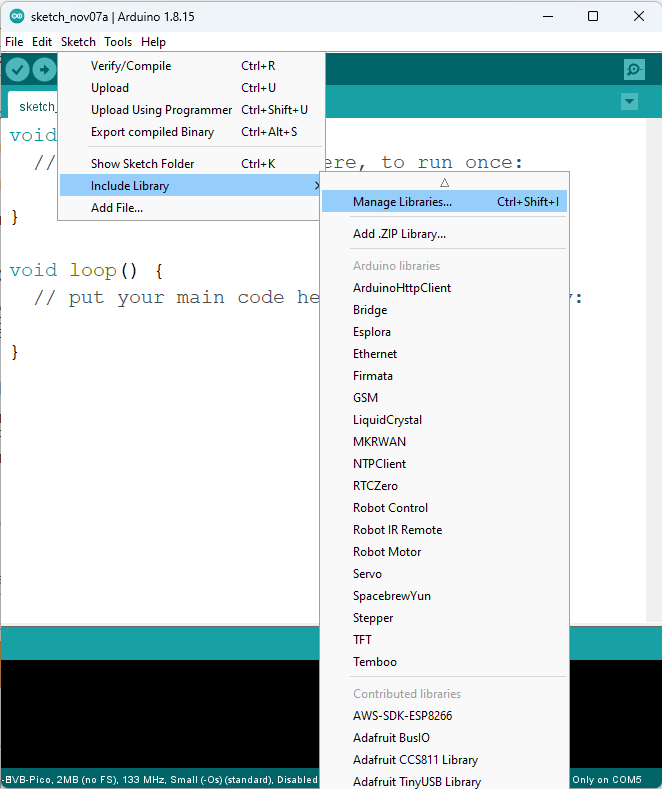
To install the library navigate to Sketch > Include Library > Manage Libraries… Wait for the Library Manager to download the libraries index and update the list of installed libraries.
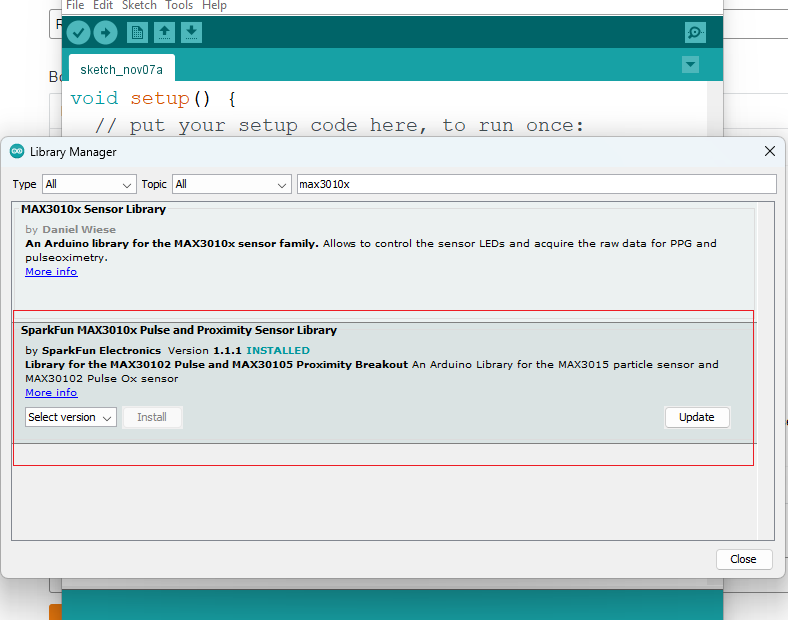
Filter your search by typing MAX3010x. Look for SparkFun MAX3010x Pulse and Proximity Sensor Library. Click on that entry, and then select Install. I have already installed the library that's why I am getting an update message.
Testting the Sensor - Reading Red & IR
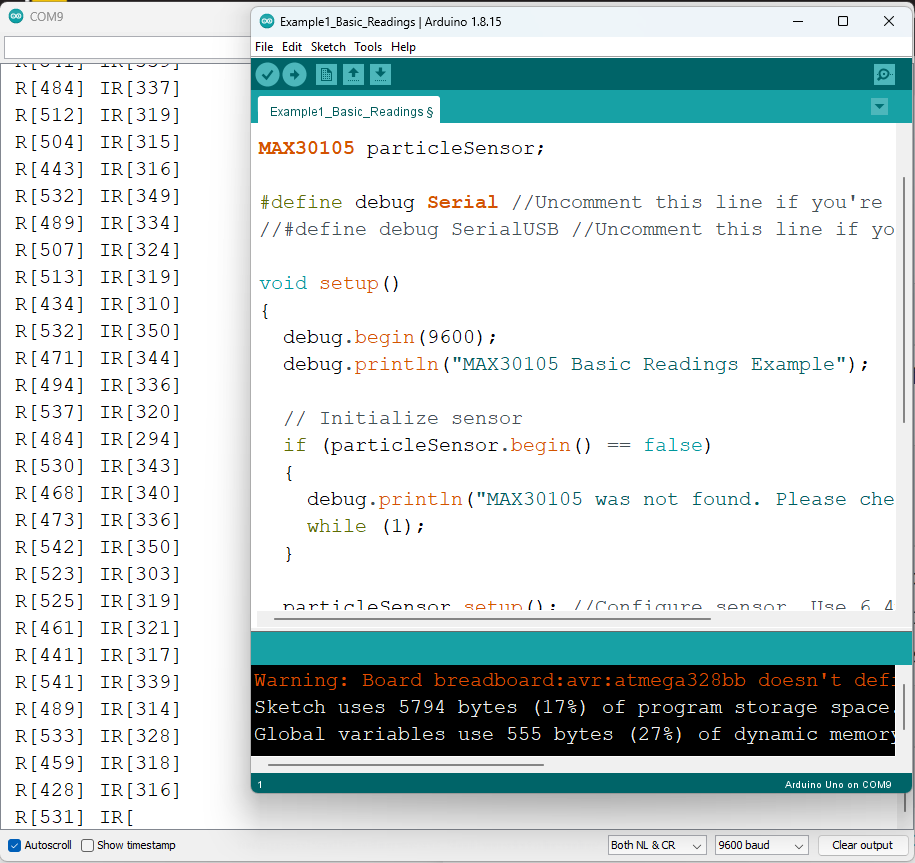
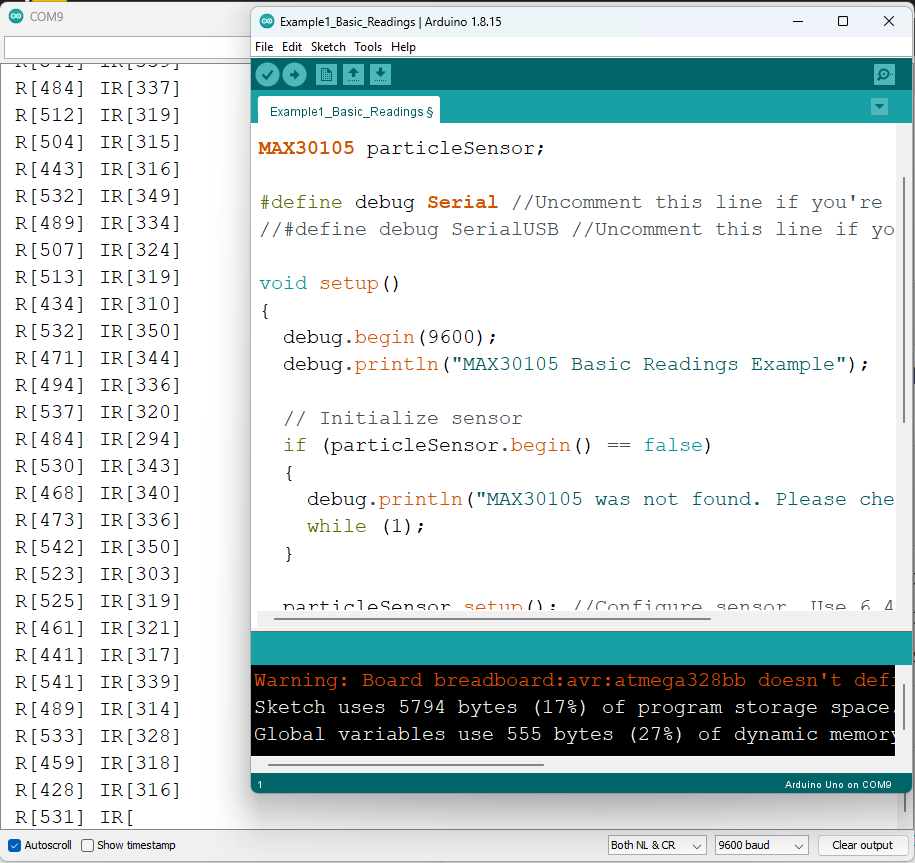
The first example provided with the library outputs the raw values (IR and Red readings) read by the sensor. Load it onto your Arduino and open the Serial Terminal to see the printed values.
#include <Wire.h>
#include "MAX30105.h"

MAX30105 particleSensor;

#define debug Serial //Uncomment this line if you're using an Uno or ESP
//#define debug SerialUSB //Uncomment this line if you're using a SAMD21

void setup()
{
  debug.begin(9600);
  debug.println("MAX30102 Basic Readings Example");

  // Initialize sensor
  if (particleSensor.begin() == false)
  {
    debug.println("MAX30102 was not found. Please check wiring/power. ");
    while (1);
  }

  particleSensor.setup(); //Configure sensor. Use 6.4mA for LED drive
}

void loop()
{
  debug.print(" R[");
  debug.print(particleSensor.getRed());
  debug.print("] IR[");
  debug.print(particleSensor.getIR());
  debug.print("]");

  debug.println();
}
With the sensor pointing up, swipe your hand over the sensor. You should see a change in values as your hand reflects different amounts of light.
Serial data can be visualized if you’re using the Arduino IDE v1.6.6+, there is an option to view the data on a graph using the Arduino Serial Plotter.
To start, replace the loop() in the code above with this code snippet:
void loop() {
	Serial.print(particleSensor.getRed());
	Serial.print(", ");
	Serial.println(particleSensor.getIR());
}
In the Arduino IDE, choose Tools > Serial Plotter. You should see a wave similar to the image below, when you swipe your hand over the sensor.
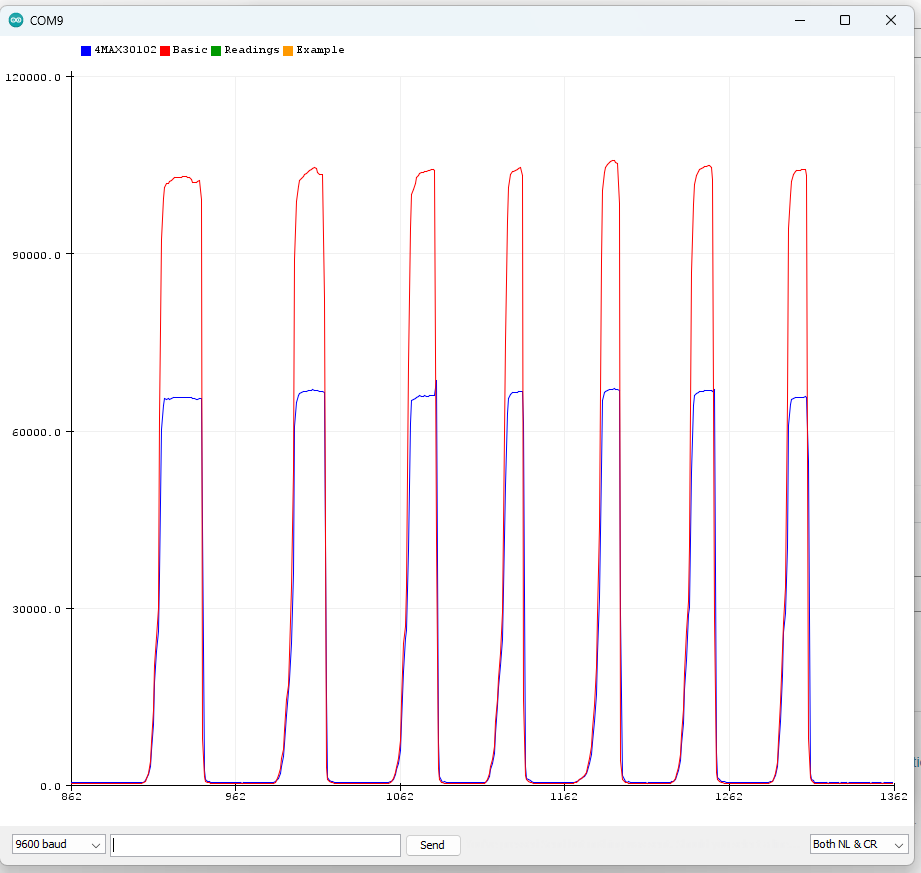
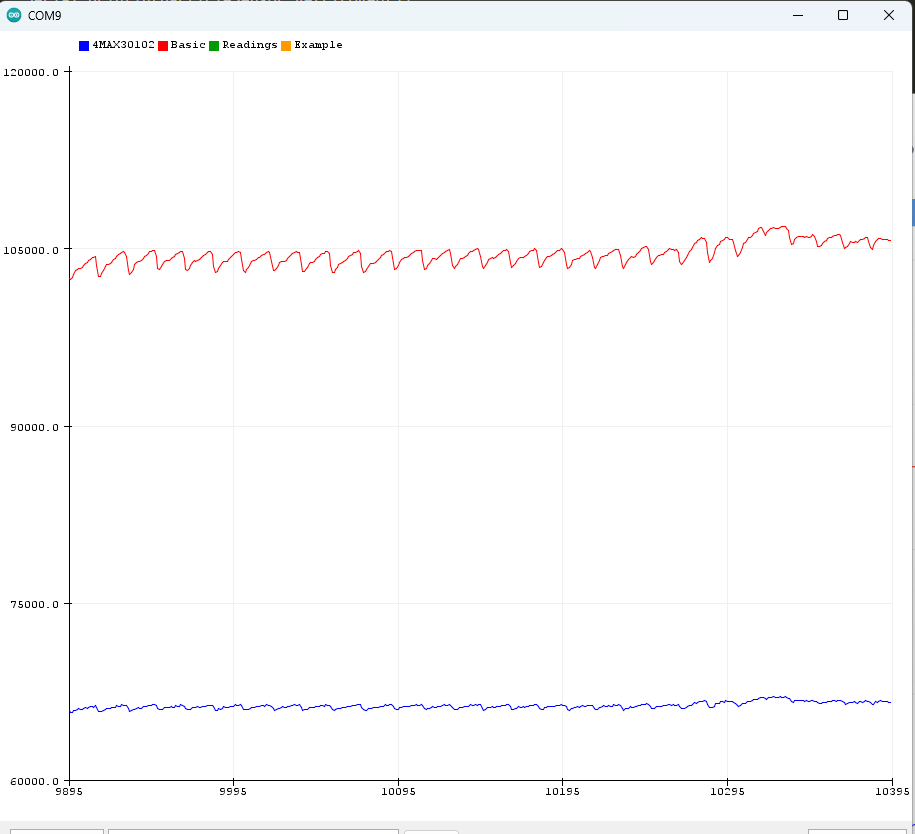
With a finger attached to the MAX30102 (either by rubber band, tape, or encapulation), the printout to the Arduino serial plotter should look as follows:
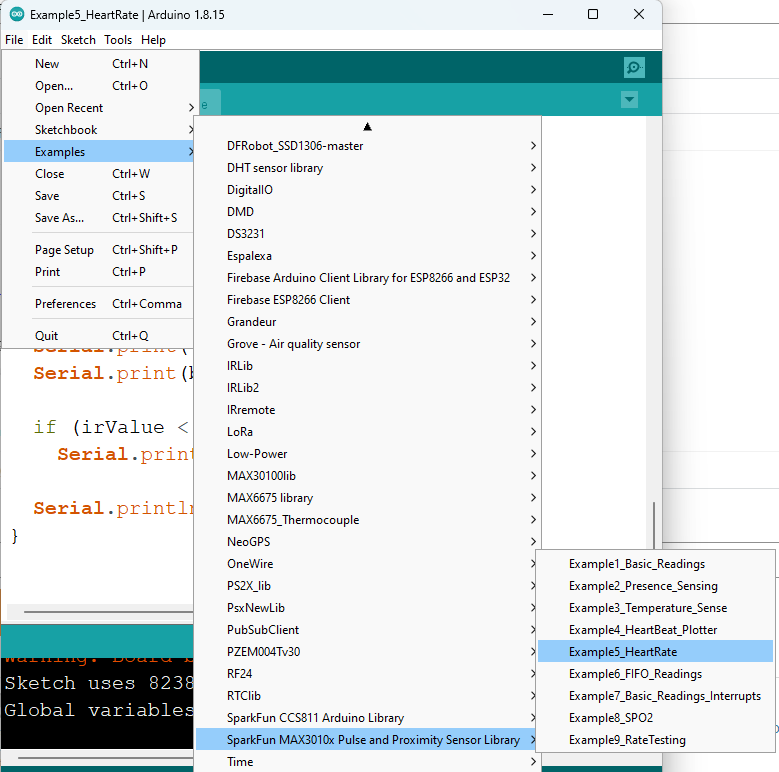
We can measure herat rate (beats per minute or BPM) very easily using the oximiter 5 click. To measure the heart-rate and view the value in serial monitor open the Example5_HeartRate from the example menu.
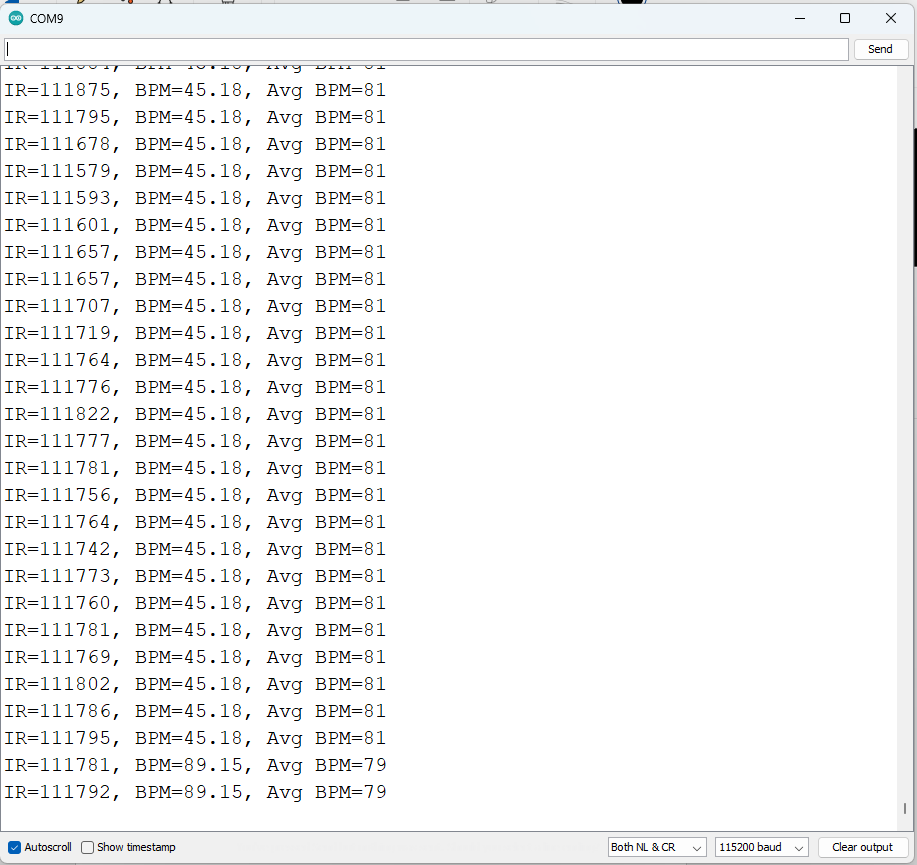
You will get the heart rate from the serial monitor
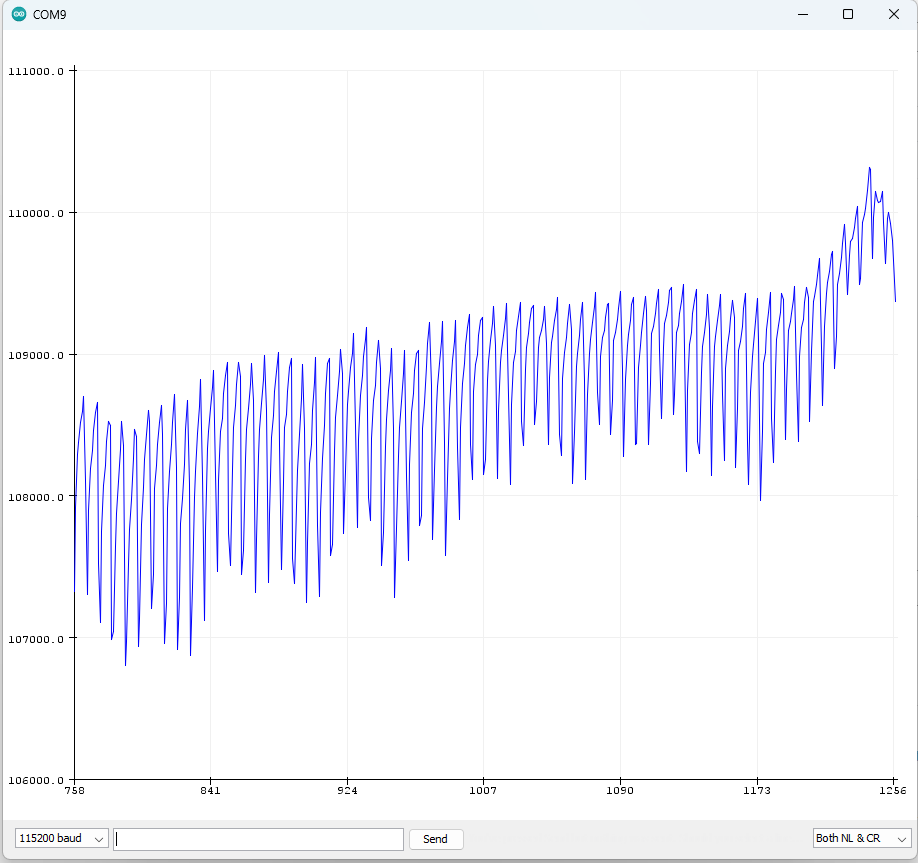
Even you can visulaize the heart beat from the heartBeat_plotter example
Measuring Oxygen Saturation (SpO2)
For measuring oxygen saturation open the SpO2 Example from the example menu or use the following sketch
#include <Wire.h>
#include "MAX30105.h"
#include "spo2_algorithm.h"

MAX30105 particleSensor;

#define MAX_BRIGHTNESS 255

#if defined(__AVR_ATmega328P__) || defined(__AVR_ATmega168__)
//Arduino Uno doesn't have enough SRAM to store 100 samples of IR led data and red led data in 32-bit format
//To solve this problem, 16-bit MSB of the sampled data will be truncated. Samples become 16-bit data.
uint16_t irBuffer[100]; //infrared LED sensor data
uint16_t redBuffer[100];  //red LED sensor data
#else
uint32_t irBuffer[100]; //infrared LED sensor data
uint32_t redBuffer[100];  //red LED sensor data
#endif

int32_t bufferLength; //data length
int32_t spo2; //SPO2 value
int8_t validSPO2; //indicator to show if the SPO2 calculation is valid
int32_t heartRate; //heart rate value
int8_t validHeartRate; //indicator to show if the heart rate calculation is valid

byte pulseLED = 11; //Must be on PWM pin
byte readLED = 13; //Blinks with each data read

void setup()
{
  Serial.begin(115200); // initialize serial communication at 115200 bits per second:

  pinMode(pulseLED, OUTPUT);
  pinMode(readLED, OUTPUT);

  // Initialize sensor
  if (!particleSensor.begin(Wire, I2C_SPEED_FAST)) //Use default I2C port, 400kHz speed
  {
    Serial.println(F("MAX30105 was not found. Please check wiring/power."));
    while (1);
  }

  Serial.println(F("Attach sensor to finger with rubber band. Press any key to start conversion"));
  while (Serial.available() == 0) ; //wait until user presses a key
  Serial.read();

  byte ledBrightness = 60; //Options: 0=Off to 255=50mA
  byte sampleAverage = 4; //Options: 1, 2, 4, 8, 16, 32
  byte ledMode = 2; //Options: 1 = Red only, 2 = Red + IR, 3 = Red + IR + Green
  byte sampleRate = 100; //Options: 50, 100, 200, 400, 800, 1000, 1600, 3200
  int pulseWidth = 411; //Options: 69, 118, 215, 411
  int adcRange = 4096; //Options: 2048, 4096, 8192, 16384

  particleSensor.setup(ledBrightness, sampleAverage, ledMode, sampleRate, pulseWidth, adcRange); //Configure sensor with these settings
}

void loop()
{
  bufferLength = 100; //buffer length of 100 stores 4 seconds of samples running at 25sps

  //read the first 100 samples, and determine the signal range
  for (byte i = 0 ; i < bufferLength ; i++)
  {
    while (particleSensor.available() == false) //do we have new data?
      particleSensor.check(); //Check the sensor for new data

    redBuffer[i] = particleSensor.getRed();
    irBuffer[i] = particleSensor.getIR();
    particleSensor.nextSample(); //We're finished with this sample so move to next sample

    Serial.print(F("red="));
    Serial.print(redBuffer[i], DEC);
    Serial.print(F(", ir="));
    Serial.println(irBuffer[i], DEC);
  }

  //calculate heart rate and SpO2 after first 100 samples (first 4 seconds of samples)
  maxim_heart_rate_and_oxygen_saturation(irBuffer, bufferLength, redBuffer, &spo2, &validSPO2, &heartRate, &validHeartRate);

  //Continuously taking samples from MAX30102.  Heart rate and SpO2 are calculated every 1 second
  while (1)
  {
    //dumping the first 25 sets of samples in the memory and shift the last 75 sets of samples to the top
    for (byte i = 25; i < 100; i++)
    {
      redBuffer[i - 25] = redBuffer[i];
      irBuffer[i - 25] = irBuffer[i];
    }

    //take 25 sets of samples before calculating the heart rate.
    for (byte i = 75; i < 100; i++)
    {
      while (particleSensor.available() == false) //do we have new data?
        particleSensor.check(); //Check the sensor for new data

      digitalWrite(readLED, !digitalRead(readLED)); //Blink onboard LED with every data read

      redBuffer[i] = particleSensor.getRed();
      irBuffer[i] = particleSensor.getIR();
      particleSensor.nextSample(); //We're finished with this sample so move to next sample

      //send samples and calculation result to terminal program through UART
      Serial.print(F("red="));
      Serial.print(redBuffer[i], DEC);
      Serial.print(F(", ir="));
      Serial.print(irBuffer[i], DEC);

      Serial.print(F(", HR="));
      Serial.print(heartRate, DEC);

      Serial.print(F(", HRvalid="));
      Serial.print(validHeartRate, DEC);

      Serial.print(F(", SPO2="));
      Serial.print(spo2, DEC);

      Serial.print(F(", SPO2Valid="));
      Serial.println(validSPO2, DEC);
    }

    //After gathering 25 new samples recalculate HR and SP02
    maxim_heart_rate_and_oxygen_saturation(irBuffer, bufferLength, redBuffer, &spo2, &validSPO2, &heartRate, &validHeartRate);
  }
}
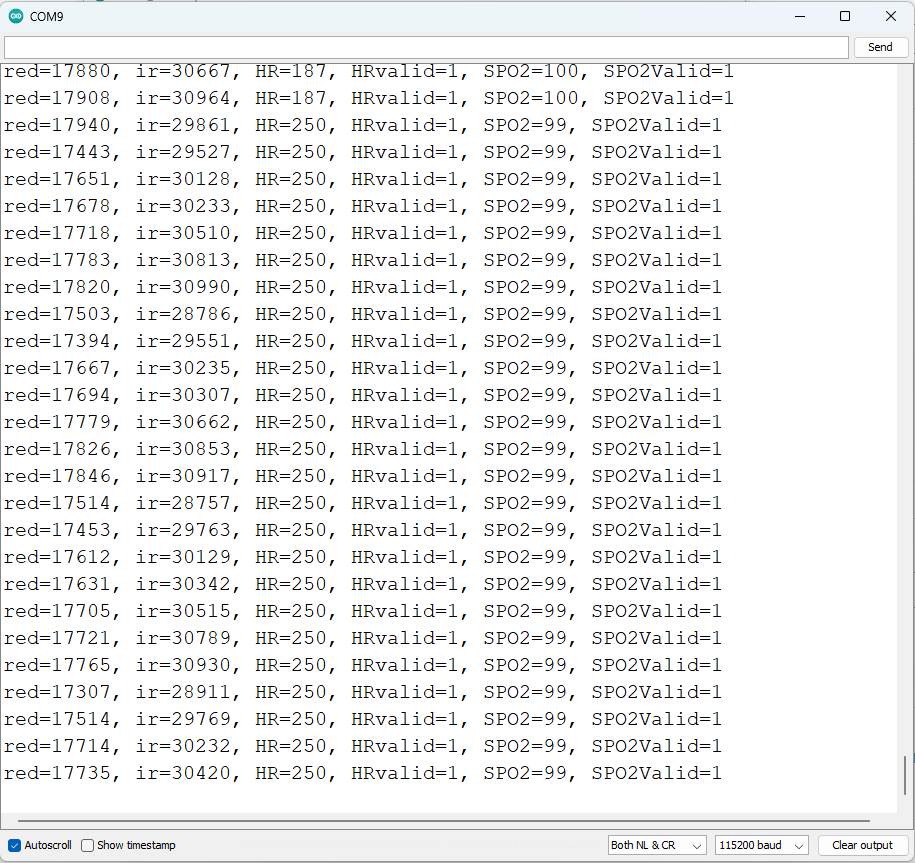
After uploading the sketch to the Arduino board, keep your finger on the sensor as steady as possible and wait a few seconds for the reading to make sense. You will see a result like this.
In this blog I explained the basics of heart rate, pulse oximetry, the oximeter 5 click and how to measure the heart rate and oxigen saturation using the oximeter 5 click and Arduino. This blog is a test of the oximeter 5 click and the Arduino library of for the oximeter 5 click board. In my next blog I will test AD8232 ECG sensor and try to measure ECG using Arduino.
