Table of Contents
- Introduction
- What is ECG?
- Why is ECG Important
- The AD8232 ECG Sensor
- AD8232 Connections
- Sensor Pad Placement
- Interfacing AD8232 Sensor with Arduino
- Understanding ECG Signal
- Conclusion
This is the third blog of the Summer of Sensors Design Challenge. In this blog, I will explore the open-source AD8232 ECG Sensor module from Sparkfun that is made using the AD8232 IC from Analog Device. I will observe the accuracy of the sensor module. This module is not compatible with the Mikroe click shield. So, for making it compatible with the click shield I use a piece of perf board and male header. MIKROE ECG 3 Click can be a good alternative and can be directly used without any extra work. It is not available in my country so I am using AD8232 here. Before going to the main work I will give a brief explanation about the ECG, its working, and its importance.
ECG or electrocardiography is a non-invasive medical technology that is used every day in doctors' offices, clinics, and hospitals around the world by measuring the electrical activity of the heart. The technology grew out of investigations beginning in the late 18th century of electrical phenomena in living systems. The nerve and muscle are electrically active, and the heart produces currents and voltages that can be recorded in what is called the electrocardiogram (ECG). Electrocardiography provides vital information about the functioning of a heart and is one of the most important of all medical technologies. Electrocardiograms are recorded based on the input from leads connected to the body at specific points. ECG is considered a fairly routine and sufficient indication of heart health and is performed with 3, 5, 12, or 15-lead ECG/EKG machines.
Cardiovascular diseases are known as the second cause of death during the last 10 years. According to World Health Organization statistics, 15 million people died in the year 2015 because of ischemic heart disease and stroke, the world's biggest killers. It is estimated that the number of deaths by the year 2030 will increase to 23.6 million people, the rate is increasing as a result of changes in lifestyles. With increasing cardiovascular diseases during the last few decades, the patient's constant heart signal monitoring plays a major role in the fast retrieval of pathological symptoms. ECG provides a sufficient indication of heart health. ECG sensors measure the bio potential generated by electrical signals that control the expansion and contraction of heart chambers.
AD8232 is a cost-effective, ECG analog sensor for measuring the electrical activity of the heart. Essentially, AD8232 is an integrated signal conditioning block for ECG and other biopotential measurements. It’s designed to perform three functions on small bi-potential signals in noisy conditions, such as extraction, amplification, and filtration. The final filtered signal provides a plot of an Electrocardiogram (ECG) of the heart, representing the heart’s electrical activity. The AD8232 ECG sensor is the most commonly used and available ECG sensor that is affordable and can be used for hobby purposes. It is a 3-lead or single-channel ECG module.

Though the AD8232 is not an industry-grade medical device and is not recommended to be used to diagnose or treat any medical condition several studies have been made on this sensor. According to M B S Sugunakar and K N Maruthy's study, there is a strong positive correlation of ECG data obtained between AD8232 and standard clinically approved ECG monitor r=0.9 (p ≤0.001) [document attached]PDF. So, we can use the AD8232 module instead of the standard ECG device for basic monitoring.
The AD8232 Heart Rate Monitor breaks out nine connections from the IC that you can solder pins, wires, or other connectors to. SDN, LO+, LO-, OUTPUT, 3.3V, and GND provide essential pins for operating this monitor with an Arduino or other development board. Also provided on this board are RA (Right Arm), LA (Left Arm), and RL (Right Leg) pins to attach and use your own custom sensors. Additionally, there is an LED indicator light that will pulsate to the rhythm of a heartbeat. Biomedical Sensor Pads and Sensor Cables are required to use the heart monitor.
The AD8232 device is connected to a microphone input jack and instead of using breakout connections, it’s possible to use a biomedical sensor cable with a 3.5mm connector. The device uses 3 electrodes; the first electrode is connected to the right arm second one is to the left arm and the third one is connected to the right leg which is the ground electrode. All three electrodes were color coded. The electrodes were not interchangeable.
We'll connect five of the nine pins on the board to your Arduino. The five pins you need are labeled GND, 3.3V, OUTPUT, LO-, and LO+.
[Note: When the system is powered from the electrical grid isolation is must require to protect from any current loop. If it is connected to the electrical grid by any means and no isolation is used it can be lethal. Additional protection can be provided via the SparkFun Opto-isolator Breakout or similar Opto-isolator circuit.]
| Board Label | Pin Function | Arduino Connection |
| GND | Ground | GND |
| 3.3V | 3.3V Power Supply | 3.3V |
| OUTPUT | Output Analog Signal | A1 (Any Analog pin) |
| LO- | Leads-off Detect - | 5 (Any digital pin) |
| LO+ | Leads-off Detect + | 9 (Any digital pin) |
| SDN | Shutdown | Not used (Optional) |
The shutdown pin is used to send the AD8232 sensor into standby mode, during which it only consumes a current of 200nA.
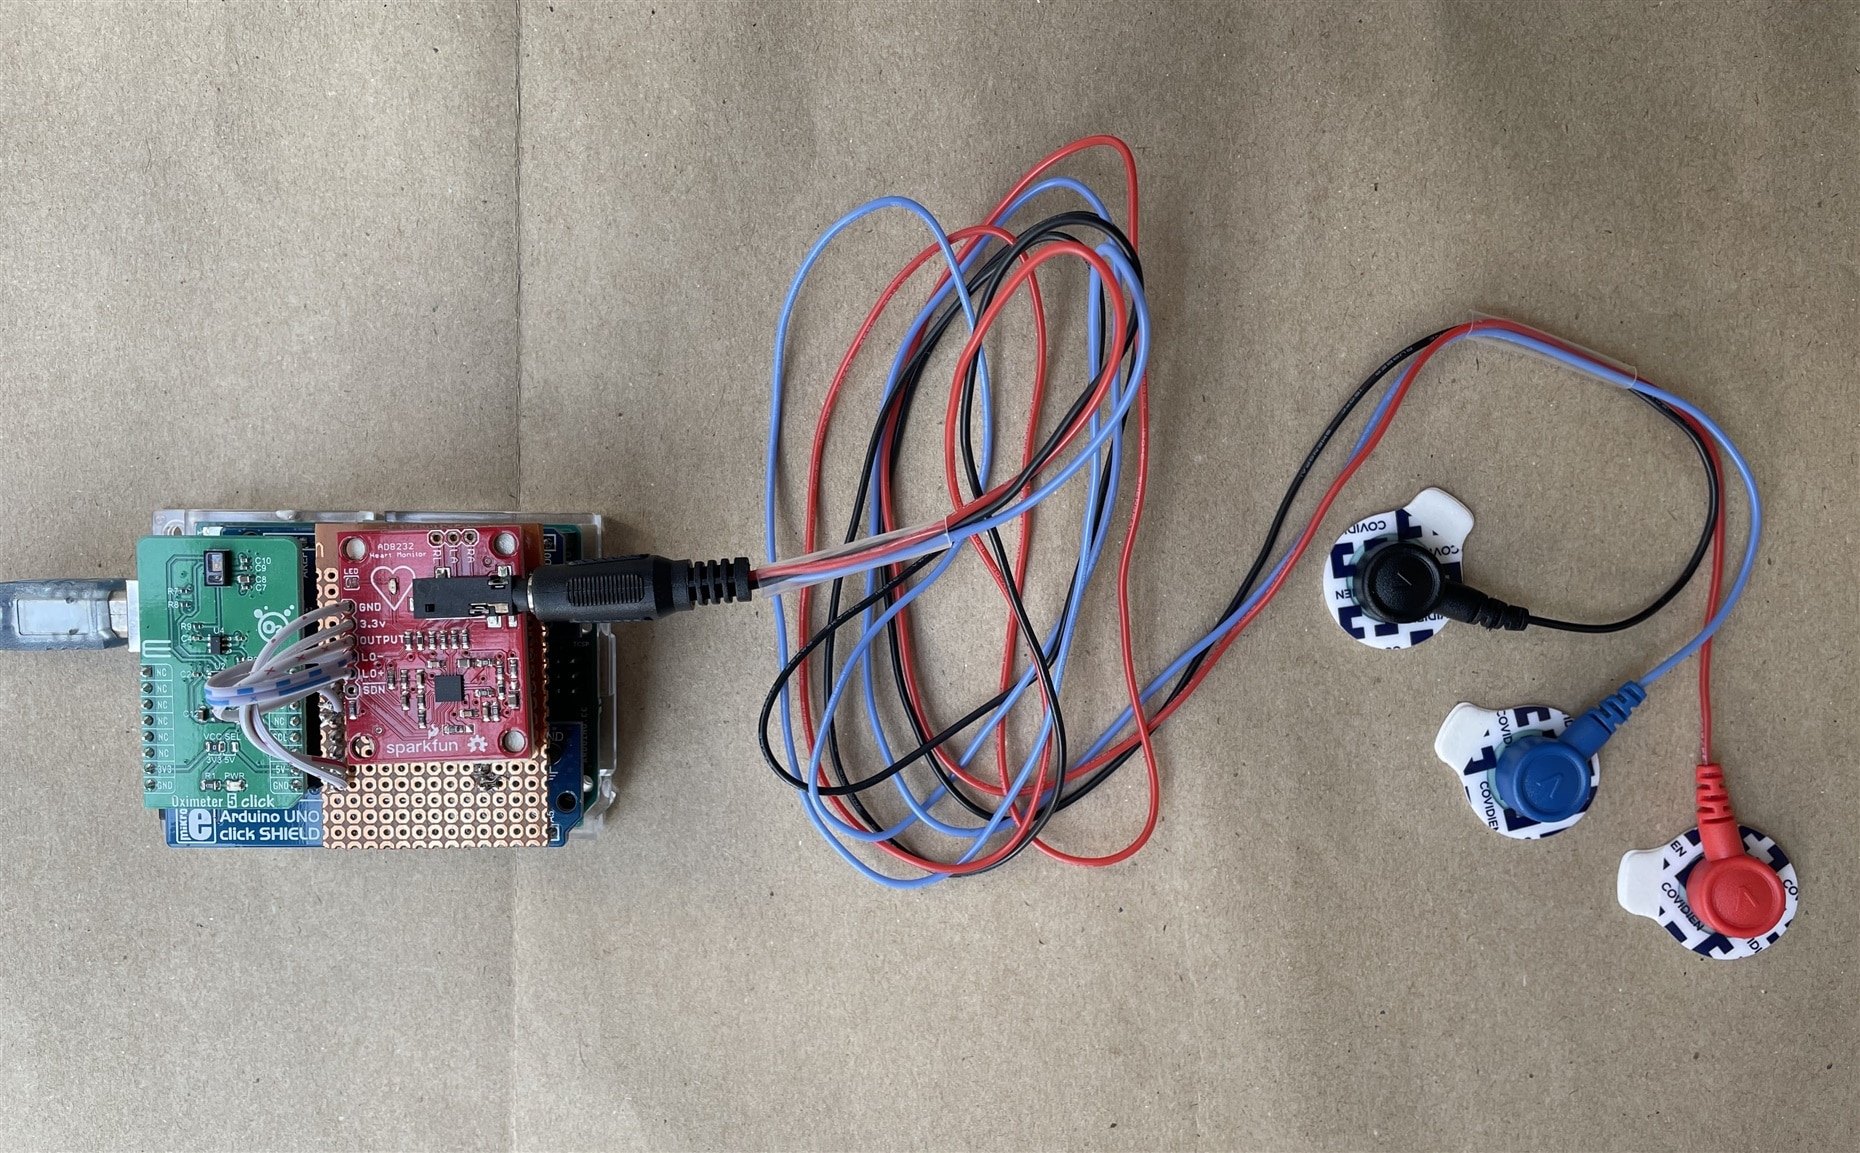
As I already said this Sparkfun sensor module is not directly compatible with click shield. So, I soldered the board with a perf board and added few male headers so that I can place it to the click shield easily.

The following connections are made according to the wiring shown in the above image.

Then I used a piece of double sided sponge tape to place the sensor board at the top of the perf board.
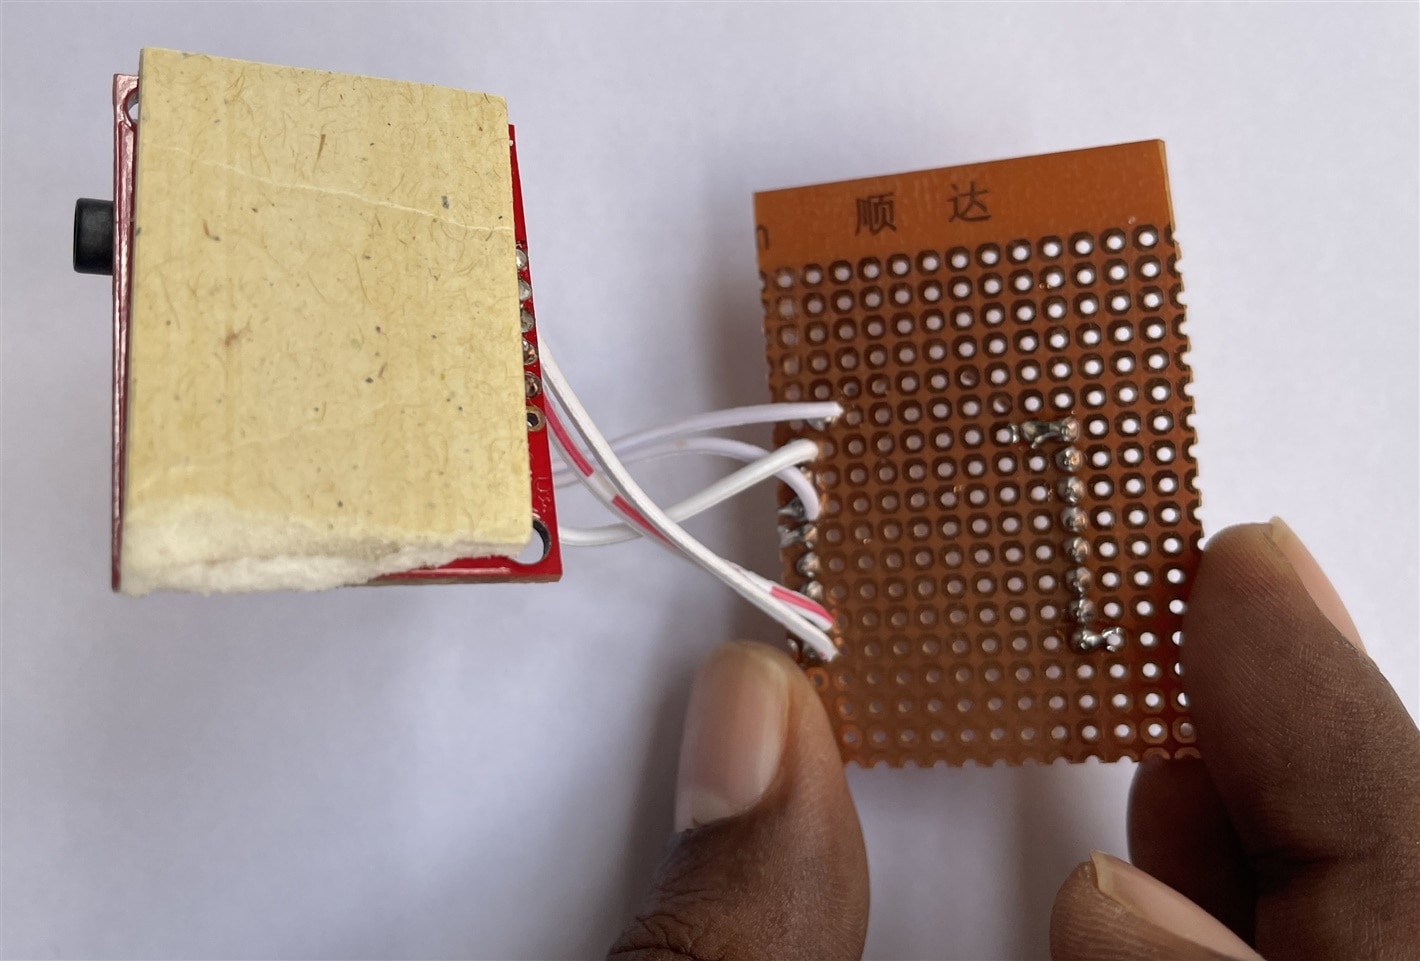
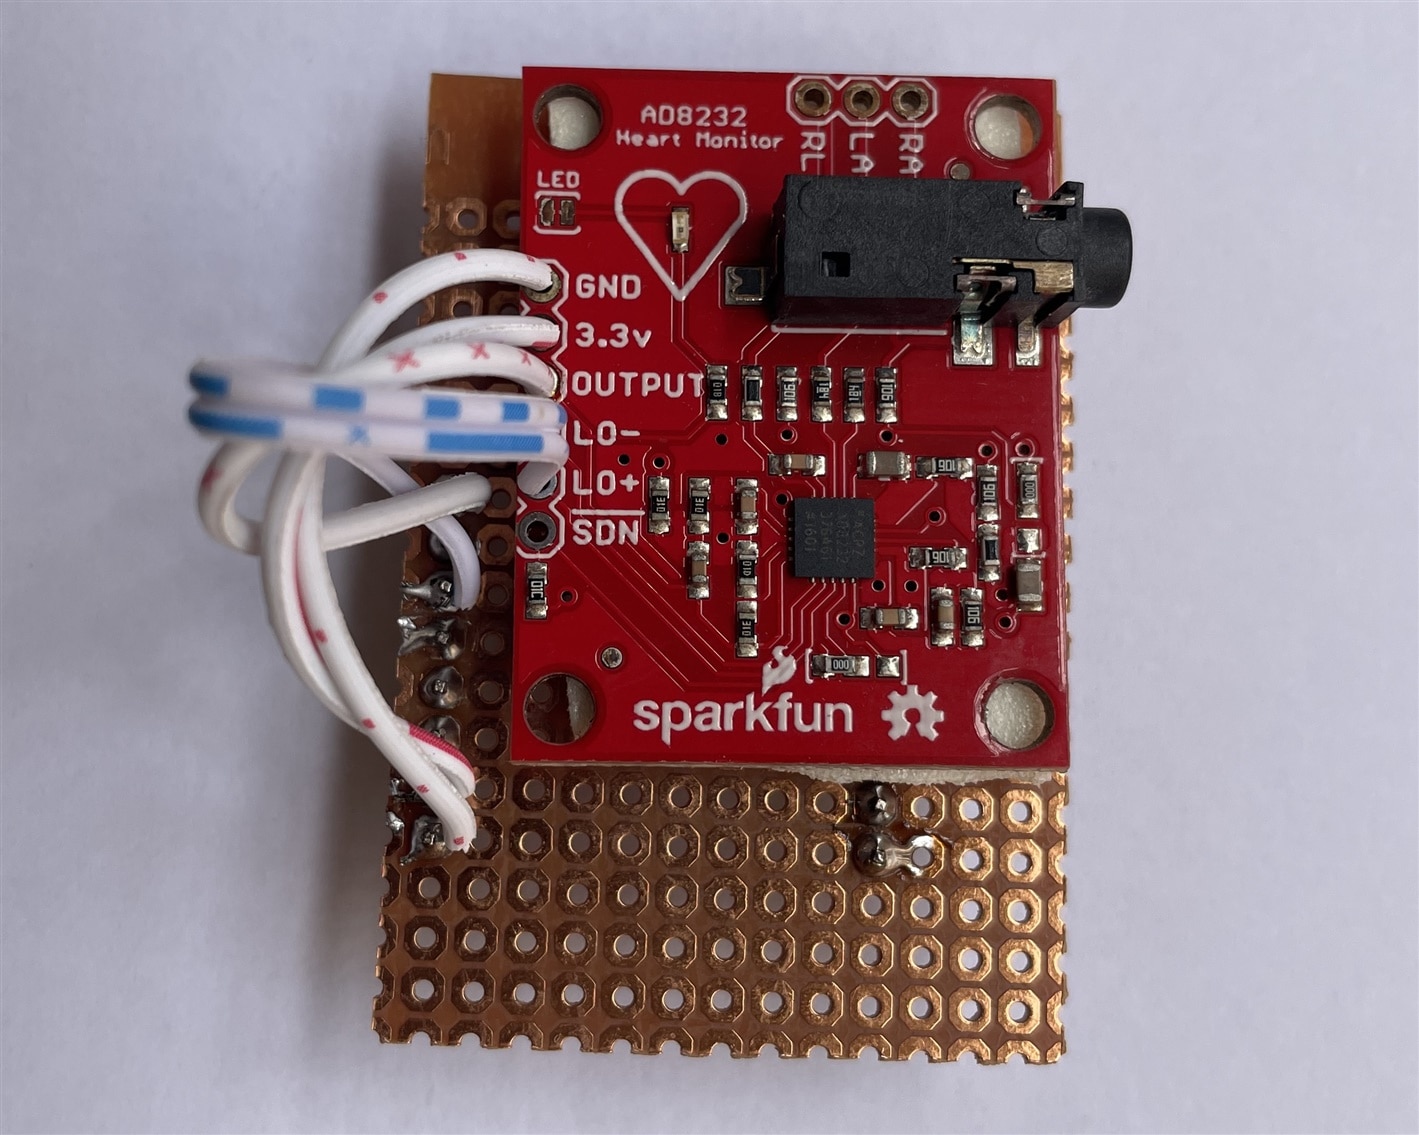
It is now like a AD8232 Click Board. After placing it to the 2nd slot of the click shield it looks like the following image.

Now that the elecronics are complete, let's look at sensor placement. It is recommended to snap the sensor pads on the leads before application to the body.
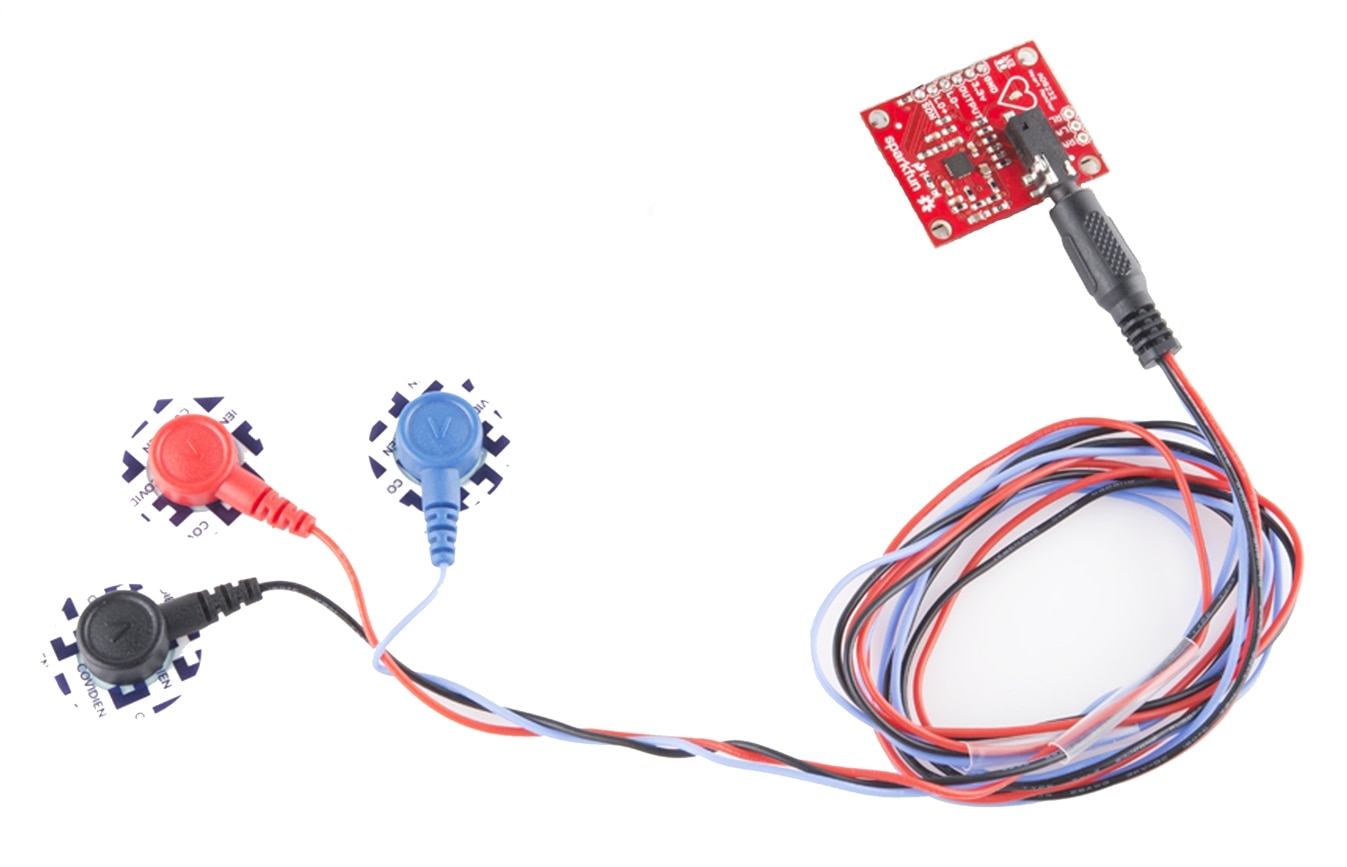
The closer to the heart the pads are, the better the measurement. The cables are color coded to help identify proper placement as shown in the table based on Einthoven's triangle.
| Electrode Name | Electrode Color | Location |
| RA | BLACK | Right Arm |
| LA | BLUE | Left Arm |
| RL | RED | Right Leg |
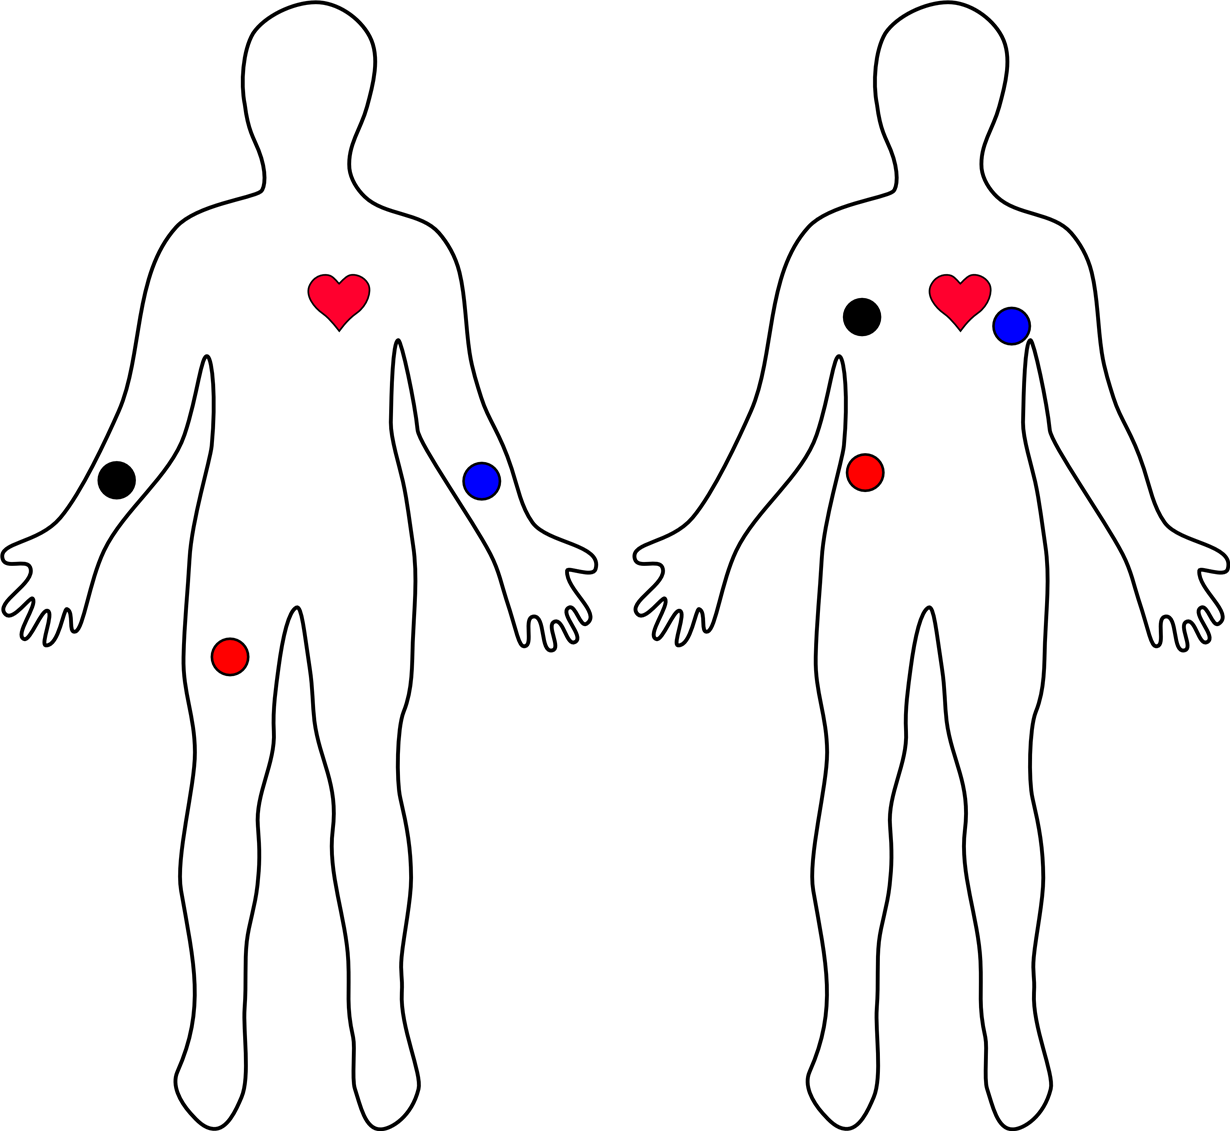
For a 3-lead system, there are two placements that are used-
The sensors can be placed on the forearms and leg as shown on the diagram on the left. Or they can be placed on the chest near the arms and above the right, lower abdomen (i.e. just above the right hip) as shown on the diagram on the right.The left position is generally used for females and is the reason why the three electrodes are called RA, LA, and RL. However, this method of placing electrodes produces more noise and hence, it is preferred that the electrodes are placed as shown in the right position, especially for hospital patients.
Interfacing AD8232 ECG sensor with Arduino
Interfacing the sensor with Arduino is very simple. The sensor provides analog data. We just need to read the analog value using the Arduino. The following Arduino sketch simply reads the analog signal from the sensor board and prints it to the serial port. If there’s a leads-off detection, the exclamation character is sent to the printer.
void setup() {
  // initialize the serial communication:
  Serial.begin(9600);
  pinMode(9, INPUT); // Setup for leads off detection LO +
  pinMode(5, INPUT); // Setup for leads off detection LO -

}

void loop() {

  if((digitalRead(9) == 1)||(digitalRead(5) == 1)){
    Serial.println('!');
  }
  else{
    // send the value of analog input 0:
      Serial.println(analogRead(A1));
  }
  //Wait for a bit to keep serial data from saturating
  delay(1);
}
After uploading code and making all the connections, connect 3.5mm biomedical three electrode pad connectors with black colour female jack and place the pads in you body according to the guideline peovided before.
You can now visualize the output in the form graph on Arduino IDE plotter. In Arduino IDE, go to tools>Serial Plotter and set the baud rate to 9600. After that you will see an output like this on Arduino serial plotter.
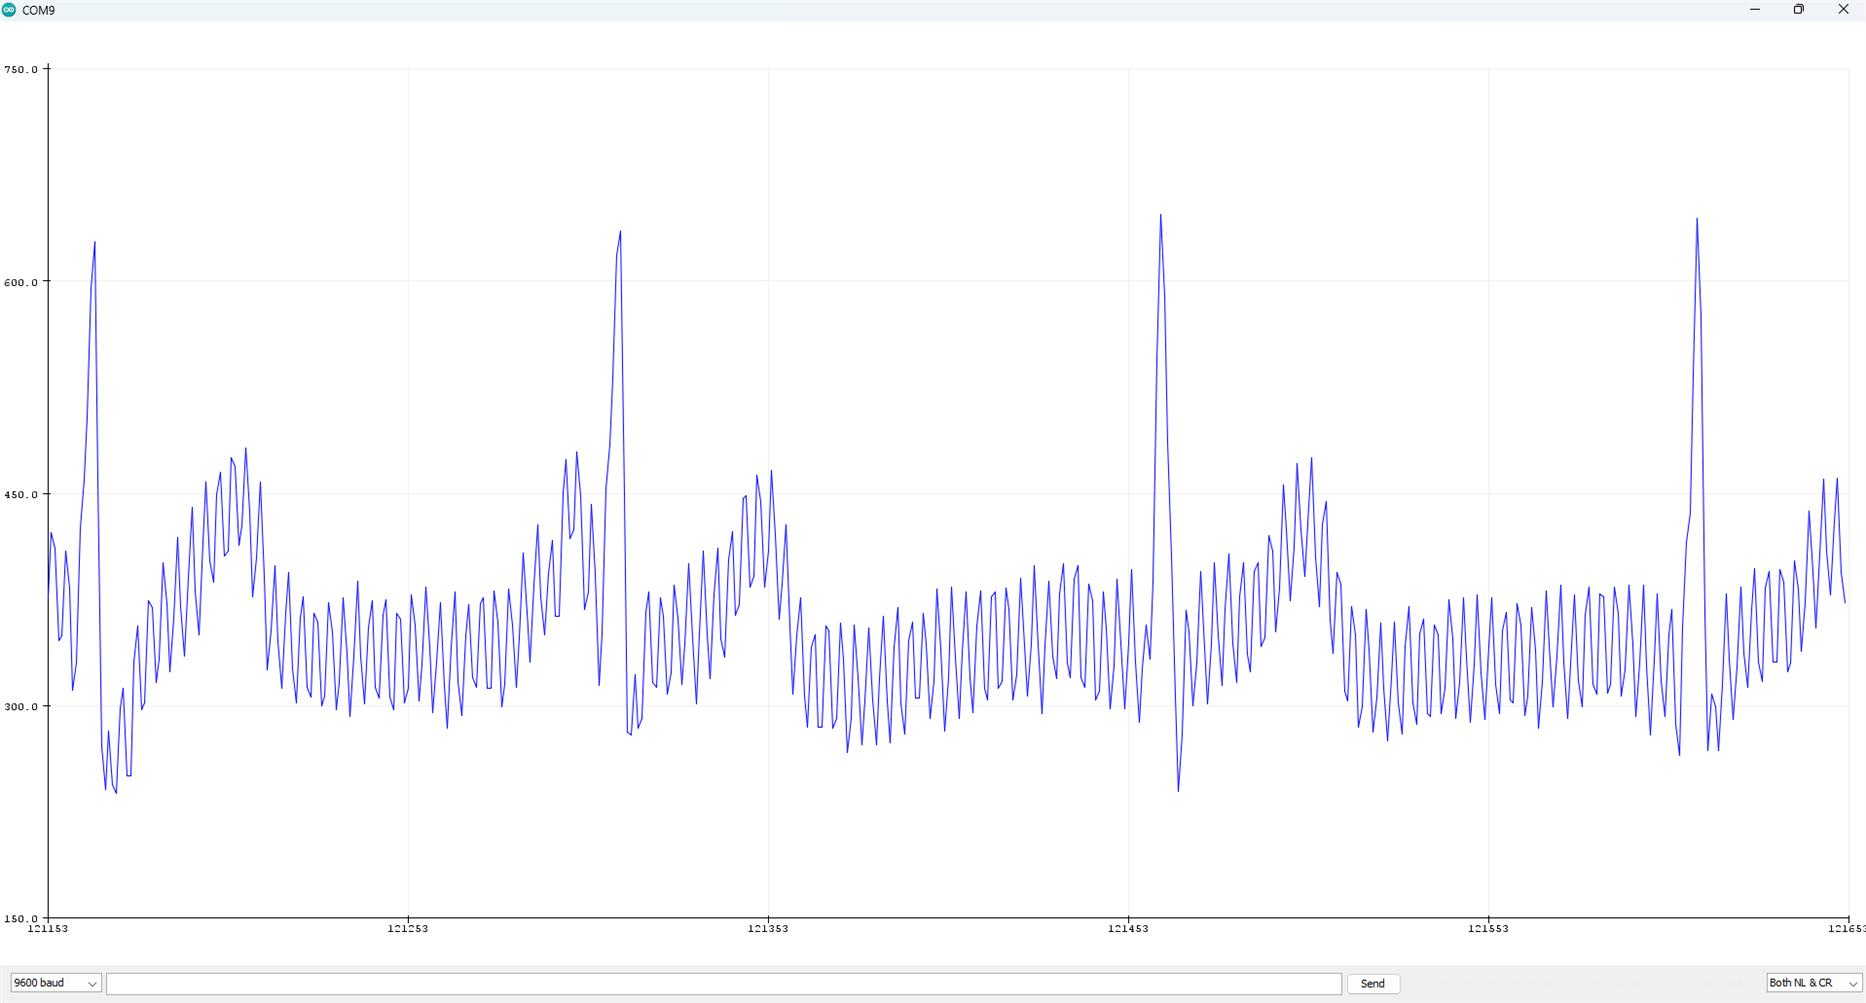
It seems there are some high frequency noise in the signal. But the signal is clearly understable.
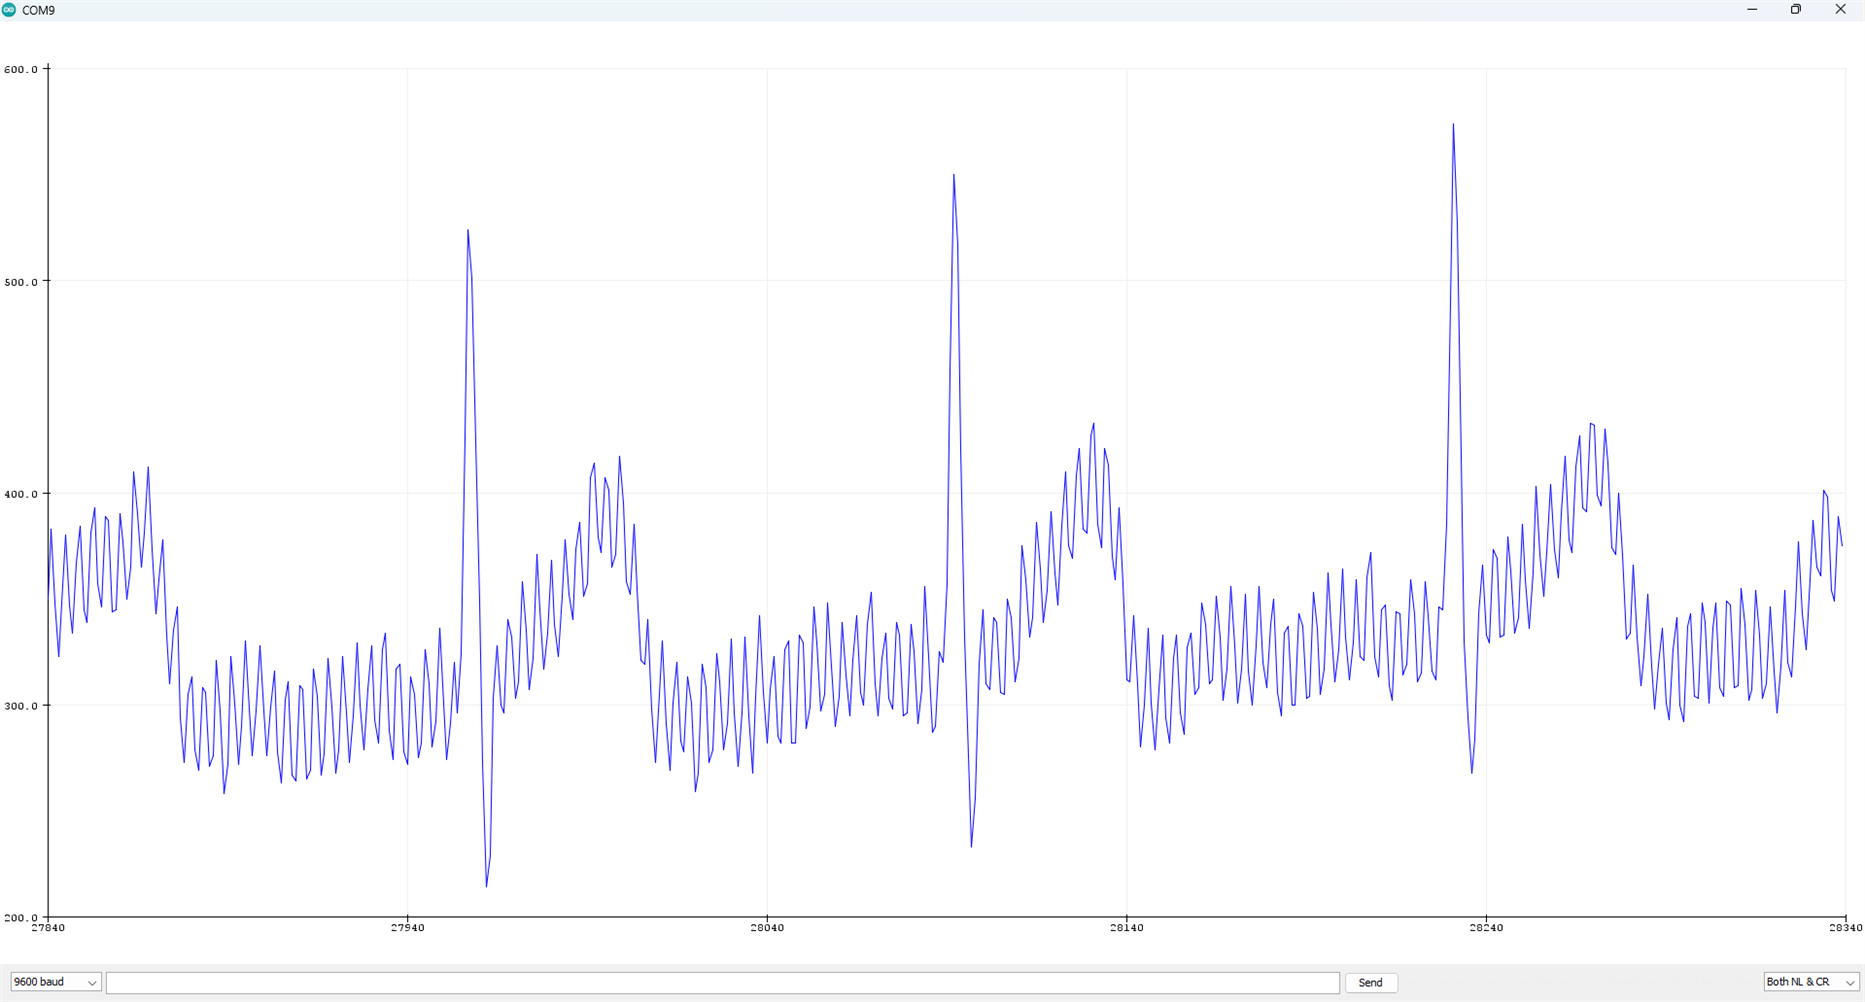
I also recorded 30 seconds video from the serial monitor.
The digital value when plotted in a graph will show a pattern of repetition, hereinafter known as a PQRST signal in the medical terms. Signals from those three electrodes will produce a graph that has hills and valleys as a representation of the heart's electricity.
The Electrocardiogram (ECG) signal is considered to provide valuable information about cardiac diseases. Therefore, accurate identification of the properties of an ECG signal will help detect abnormalities within the signal and improve predictions. The ECG signal records the electric pulses of the heart, including the magnitude and direction of the signal. Electrical flow is produced by the depolarization and repolarization of the atria and ventricles. A typical ECG signal cycle contains three waves, namely, the P wave, the QRS wave, and the T wave, as shown in following figure.
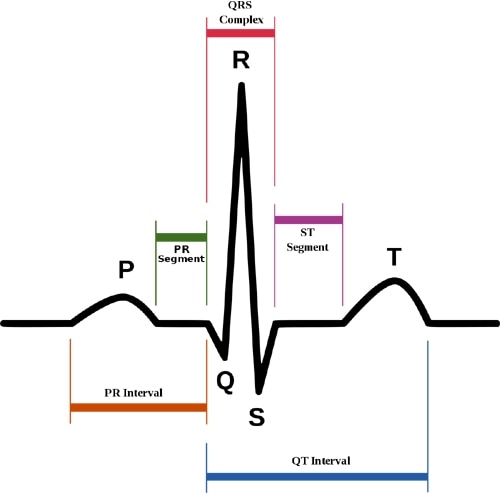
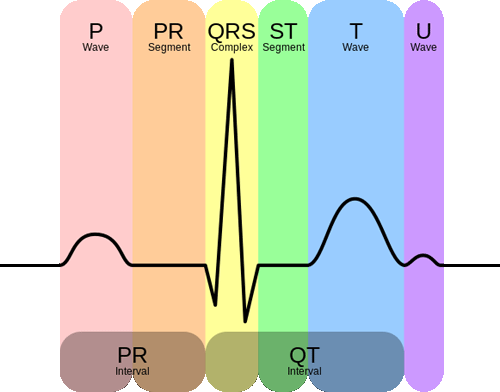
Additionally, the ECG signal contains several intervals, such as the PR, QT, ST, TQ, QRS, and RR intervals shown in the above image. The shape and amplitude of the waves and the duration of the intervals determine the characteristics of the signal and whether it is normal or abnormal. Moreover, these characteristics can be used for diagnostic purposes. For example, a normal P wave should be present and upright, so an absent or inverted P wave may indicate that the patient has a form of dysrhythmia such as junctional rhythm. The PR interval should be between 0.12 and 0.2 s, and therefore, detection of it outside its normal time range can indicate hard line dysrhythmia. The QRS complex is usually between 0.06 and 0.12 s, so a duration above this range can indicate Premature Ventricular Contractions (PVC) dysrhythmia. Unequal RR intervals in an ECG signal indicate that the rhythm is irregular. Furthermore, an ECG signal can be utilized to calculate the heart rate. Accurate analysis of the ECG signal is essential for both specialists and patients.
In this blog I connected an ECG sensor module with Arduino and was able to record the ecg signal successfully. In the next blog I will try hack a digital blood pressure monitor to read the blood pressure data from the meter and use those data to our system.

