Hello everyone!
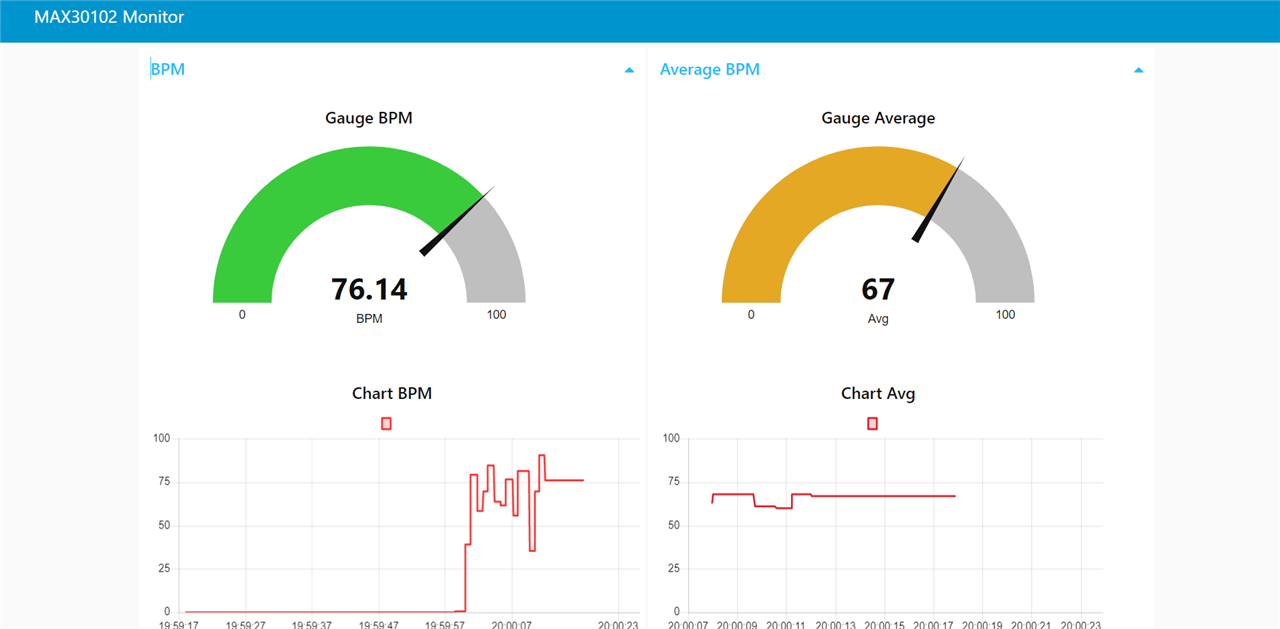
In this blog I present to you what I have worked on, a blog also about the MAX30102, and as in the case with the MAX30100, I made a graphic interface. I followed the same route, the graphic interface created contains a tab named MAX30102 Monitor and three groups: BPM Rate, Average BPM Rate and Temperature. In each group there is one gauge widget and one chart widget. As the normal values for BPM are between 60 and 100, this is how we set the thresholds for these widgets.
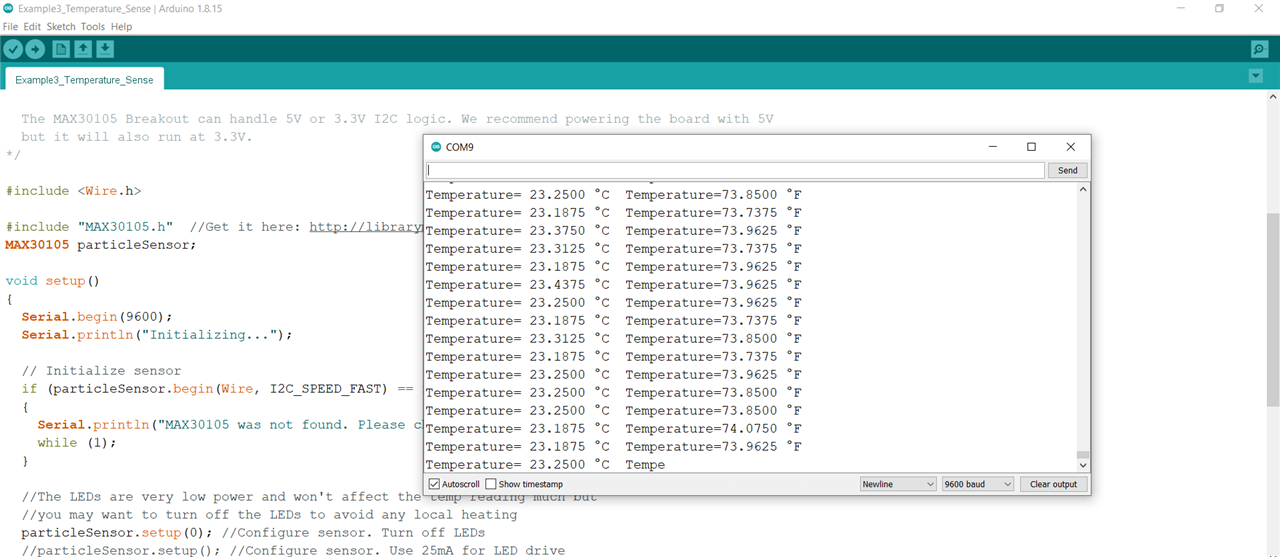
On board the module with MAX30102 we also have a temperature sensor. The temperature is measured using a temperature sensor and is expressed in degrees Celsius. The MAX30102 has an on-chip temperature sensor for calibrating the temperature dependence of the SpO2 subsystem. The temperature sensor has an inherent resolution of 0.0625°C. The device output data is relatively insensitive to the wavelength of the IR LED, where the Red LED's wavelength is critical to correct interpretation of the data. A SpO2 algorithm used with the MAX30102 output signal can compensate for the associated SpO2 error with ambient temperature changes.
Temperature sensor example:
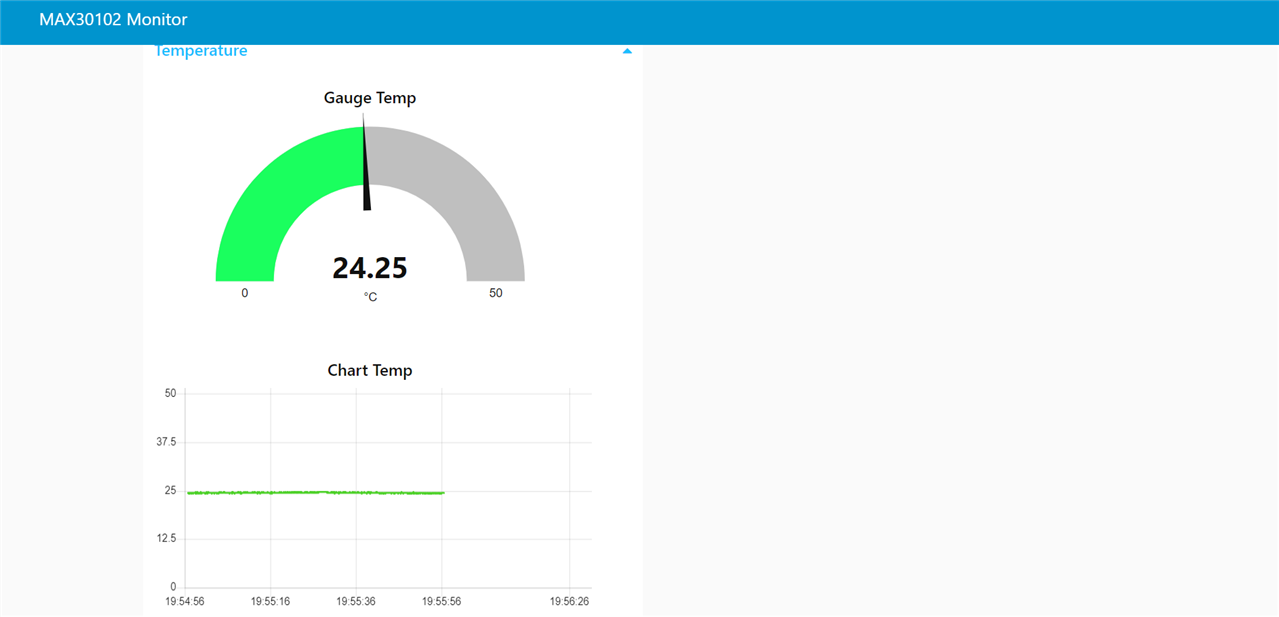
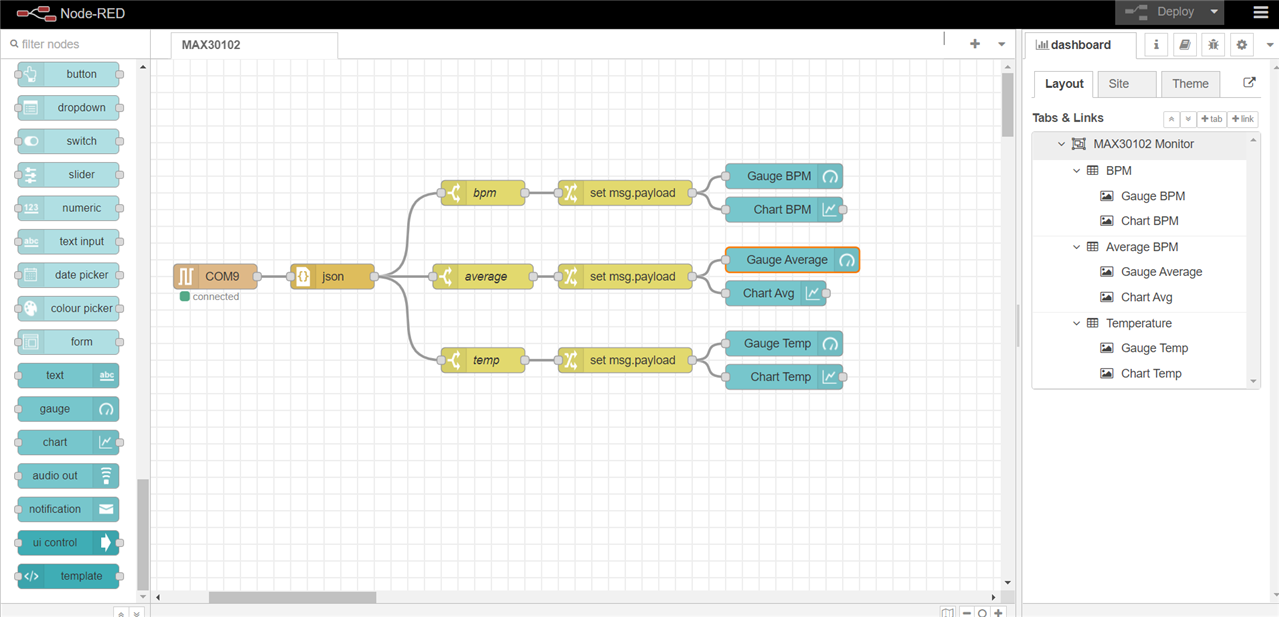
Unlike the flow created for MAX30100, the flow for MAX30102 contains a few more nodes to insert the temperature sensor on the graphics.
The graphical interface can also be accessed from another device, PC/laptop/mobile phone, since it is a web page, obviously an internet connection is required, and the IP address where the host, PC/laptop, is running at the time Node Red application, all you have to do is access http://IP_Host:1880
One thing to keep in mind is that the Node Red application will not work if the COMx port is busy, ie another application on the PC/laptop is using it. So, to make this Node Red application possible, it must be checked that the chosen COMx port is not blocked by the Arduino IDE programming environment or another program, since this is the tool through which an Arduino platform communicates with the PC/laptop platform, and as a result the data measured must reach from the Arduino platform through the serial port to the PC/laptop but at the same time the connection between the respective serial port and the Node Red instrument must be facilitated.
The flow created in Node Red looks like this:
And the user graphic interface looks like this:
Besides the graph above, I also managed to run a sketch with an example MAX30102 on Arduino with Serial Plotter:
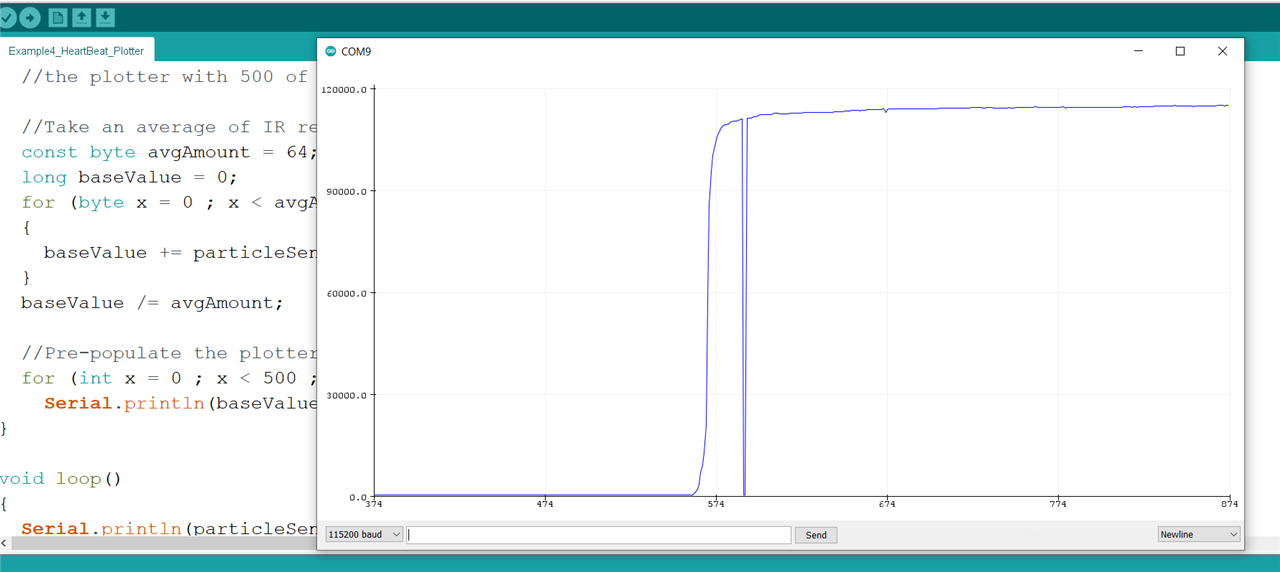
And on the Serial Monitor we have:
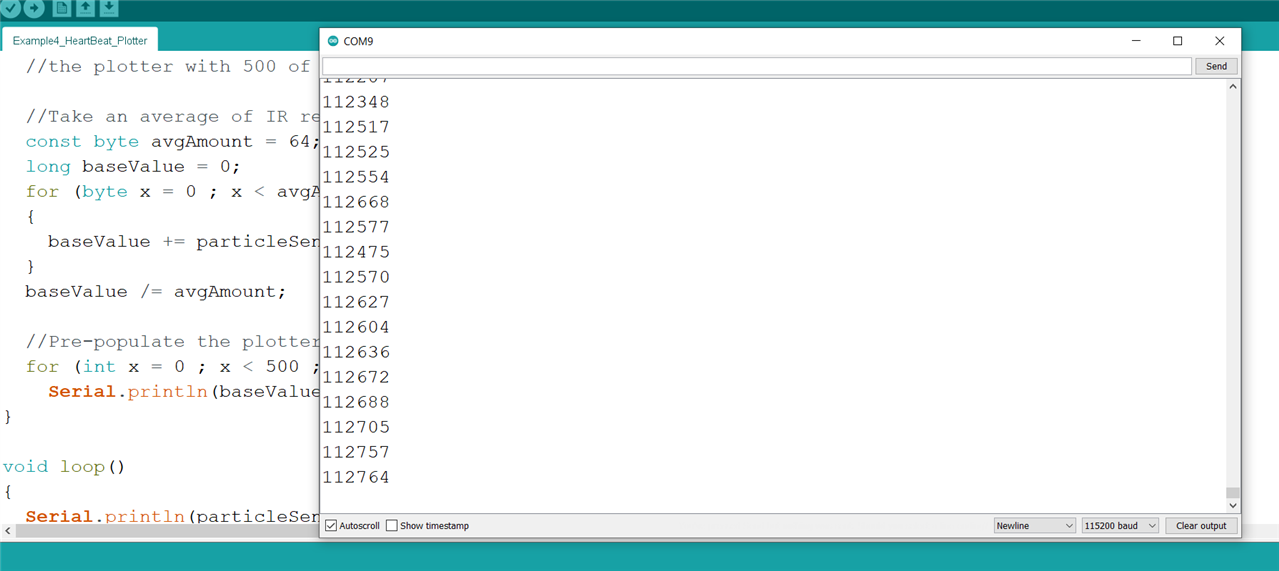
Note that these are raw values from the IR sensor, when I place my finger on the MAX30102 sensor. This would be a good starting point to represent the data from the MAX30102 in the Arduino IDE environment as well, as an alternative to what I did in Node Red.
We also have at our disposal an example of an interesting sketch. This sketch runs a program that allows detection of movement in the vicinity of the MAX30102 sensor, in other words, if someone acts within the range of the sensor, a message is issued to this effect, which looks something like this:
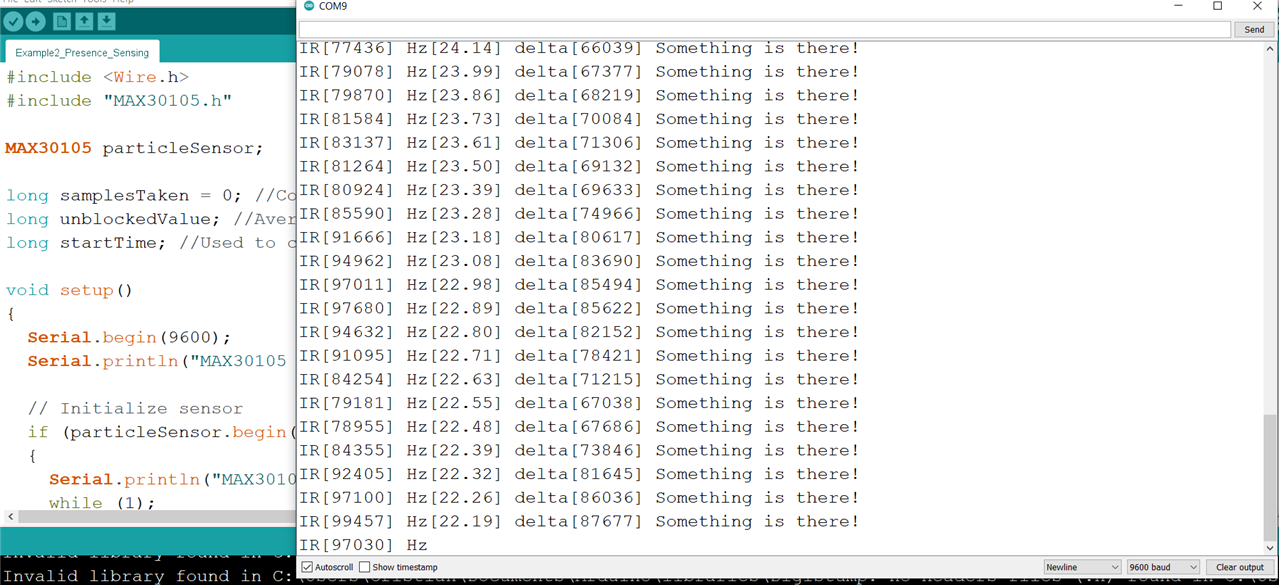
This is based on the fact that the IR sensor will detect a value that exceeds a threshold, eg 100, and when someone passes in front of the MAX30102 sensor, the value inevitably exceeds the threshold.
It was interesting to work with this MAX30102 sensor, I don't know for sure what is the main reason why sometimes even aberrant values are recorded. There is definitely room for progress and improvements to what we have done so far.
Web references:
https://www.hnhcart.com/blogs/sensors-modules/a
Thanks Element14Community for the kit received.
Best regards!

Top Comments