Intro
In the previous blog post we have researched the method of controlling household refrigerator operations, but doing it blindly/open-loop can lead to sub-optimal results. Thus, some measurement method has to be prepared. To not make big modifications in the fridge construction (which can lead to decrease of thermal insulation, water vapor condensation and other problems), I have decided to use wireless temperature sensor.
Sensor
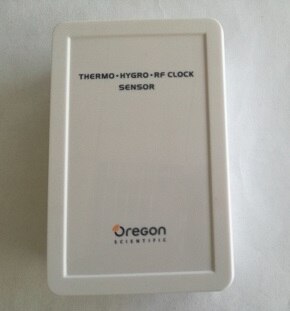
Use of an outdoor weather station sensor was inspired by the story I have read sometimes in the past, when somebody was troubleshooting his fridge by measuring temperature inside using such a sensor. That choice is not an intuitive one - after all, what is the most recognizable characteristic of the fridge? That people can stick magnets to it's walls. Which means that they are made of ferromagnetic metal. That probably shields RF signal. But that's theory - let's see if correct.
To not create controversies with other fridge users, my outdoor sensor was put into food-certified plastic bag and then placed in the freezer (first) before being moved to the uppermost shelf, near the termostat. Below is the photo of it - it is a second-hand Oregon RTGN318 working on 433 MHz frequency band, using proprietary (but well-researched) communication protocol.

Data gathering station
To obtain data from the sensor, small SBC (OrangePI Zero) with RTL-SDR dongle was used

It has some issues - mainly: limited memory (256MB) and a CPU with the tendency to running hot (especially inside a case and with daughterboard installed), but as it already serves as a print server, it is most convenient hardware for quick tests.
On this SBC, typical software stack was configured:
- rtl_433 to control SDR module and decode messages,
- rtl to influxdb relay to forward messages to the database,
- influxdb as a database (in fact, this time influxdb had to be started on different machine due to memory shortage caused by growing dataset)
- grafana as visualization tool
Rtl_433 influxdb relay was copied from the example (/usr/share/doc/rtl-433/examples/rtl_433_influxdb_relay.py) and then modified to include correct database connection parameters.
Then, rtl_433 and data relay were executed in different screen sessions (it is a temporary installation after all) using following commands:
python3 ./rtl_433_influxdb_relay.py
while `/bin/true` ; do date; rtl_433 -R 12 -F syslog:127.0.0.1:1433 ; sleep 10; done
As we see, rtl_433 is loading only one protocol parser (-R 12) and executes in the loop - version from official system repository was crashing every few days.
By default, relay script is loading data into the "rtl433" database, each sensor type into different measurement (table equivalent).
Data can then be selected using sql-like query language:
select * from "Oregon-RTGN318" where time > now() - 1d;
[...]
2024-01-31T16:48:31.532522Z 1 1 50 181 -4.12024-01-31T16:49:24.322516Z 1 1 50 181 -4.12024-01-31T16:49:24.424488Z 1 1 50 181 -4.12024-01-31T16:51:10.22942Z 1 1 50 181 -3.92024-01-31T16:51:10.292678Z 1 1 50 181 -3.92024-01-31T16:52:03.184808Z 1 1 50 181 -3.72024-01-31T16:52:03.313972Z 1 1 50 181 -3.7
or displayed in visualization tool like Grafana

As we can see, temperature curve is quite interesting - our mechanical thermostat seems to have hysteresis window of about 10°C
