


The idea to write a blog for this challenge has come into my mind almost as a coincidence. I was checking the datasheet for an attiny microcontroller, and I noticed that the particular model I have hasn't any ADC embedded into it. That's not a problem for many applications, but if you need to read an analog voltage, even from the simplest resistor divider or a potentiometer, that becomes a problem.
Well, when I found this challenge the idea almost came by itself: let's try to create a simple ADC using a 555!
The concept is pretty straightforward and based on "integrating ADCs": the input signal is processed by a voltage controlled current source and then integrated by a capacitor. The time the voltage across this capacitor takes to reach a certain threshold represent the analog value, and the resulting square wave it's our output signal. This signal can then be processed by a counter or directly by a microcontroller to convert time (which every uC is pretty good at measuring it) into the "digital twin" of our initial analog signal.
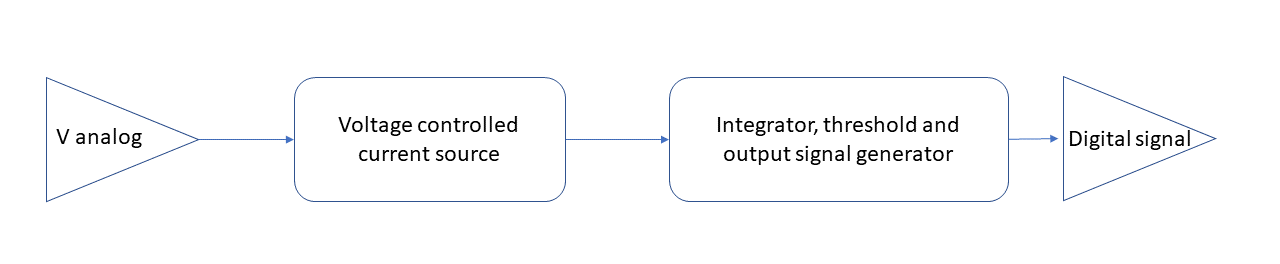 ADC block diagram
From this block diagram I came up with the following scheme. Resistor values maybe are a little weird, but that's what I have on hand at the moment  Absolute value is not that critical, it's much more important ratio between resistors.
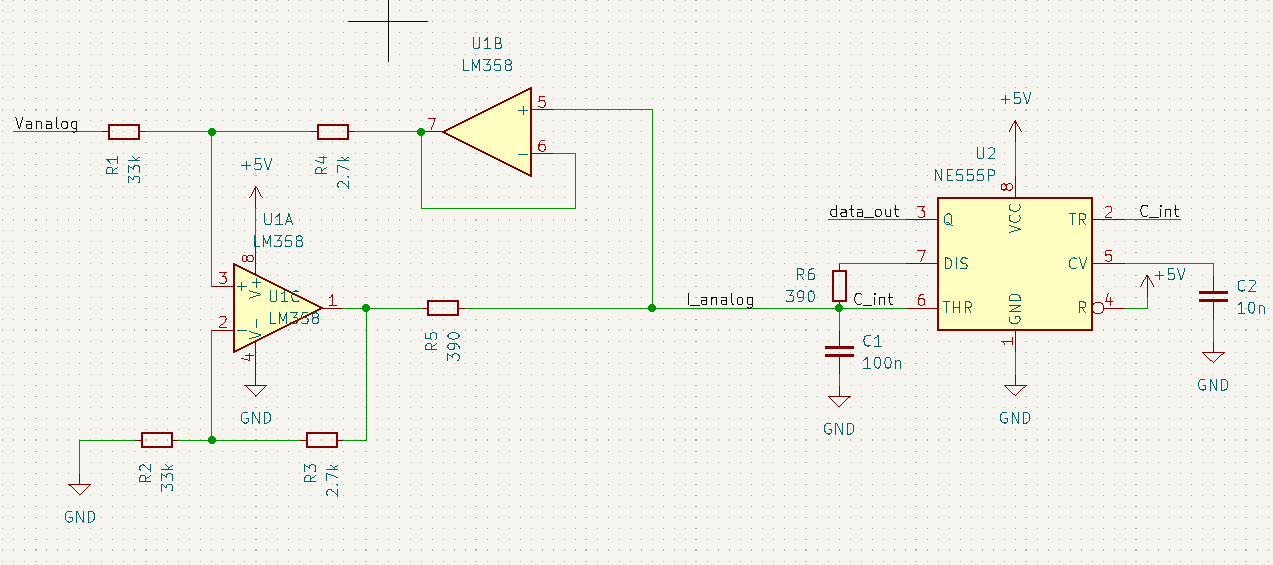 ADC scheme
As opamp I've chosen the LM358, due to it's ability to work close to gnd. Current source has been designed to have minimum voltage drop across resistor R5 and a transconductance more or less of 250uS. A rapid simulation with LTspice confirmed that.
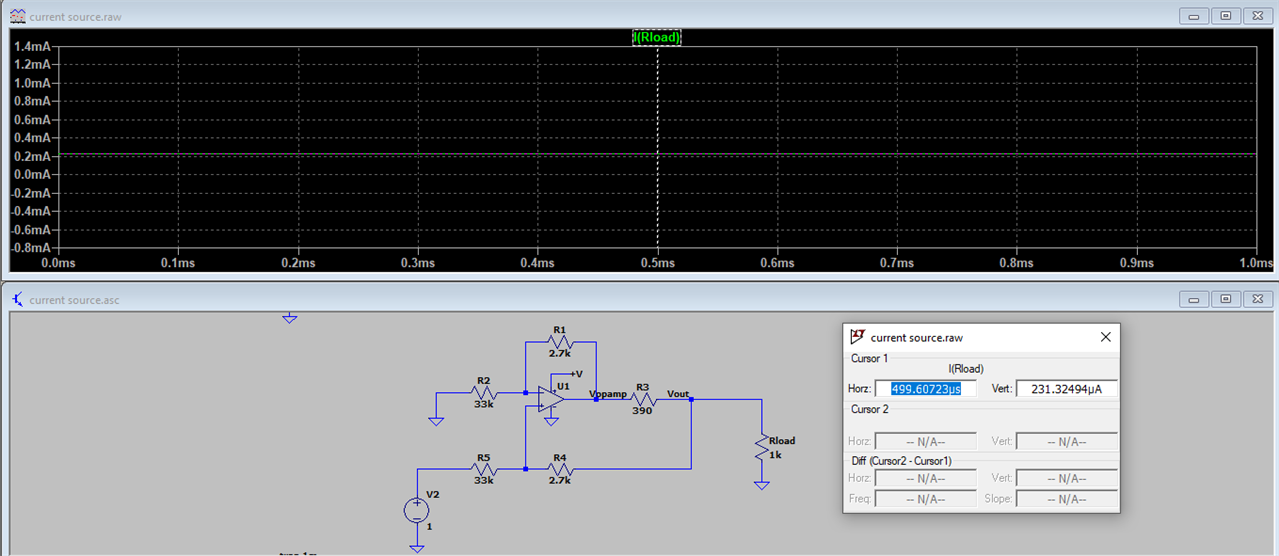 LTspice simulation: with 1V input it estimates an output current of 230uA
The 555 timer is set up as astable, with a capacitor value (C1) to obtain a conversion frequency in the kHz range (not too fast because I'm using a standard bjt based 555 chip). R6 is present to limit discharge rate and ensure that C6 voltage is mantained between 1/3Vcc and 2/3Vcc. This is very important because it allow the LM358 to operate (mostly) without saturating.
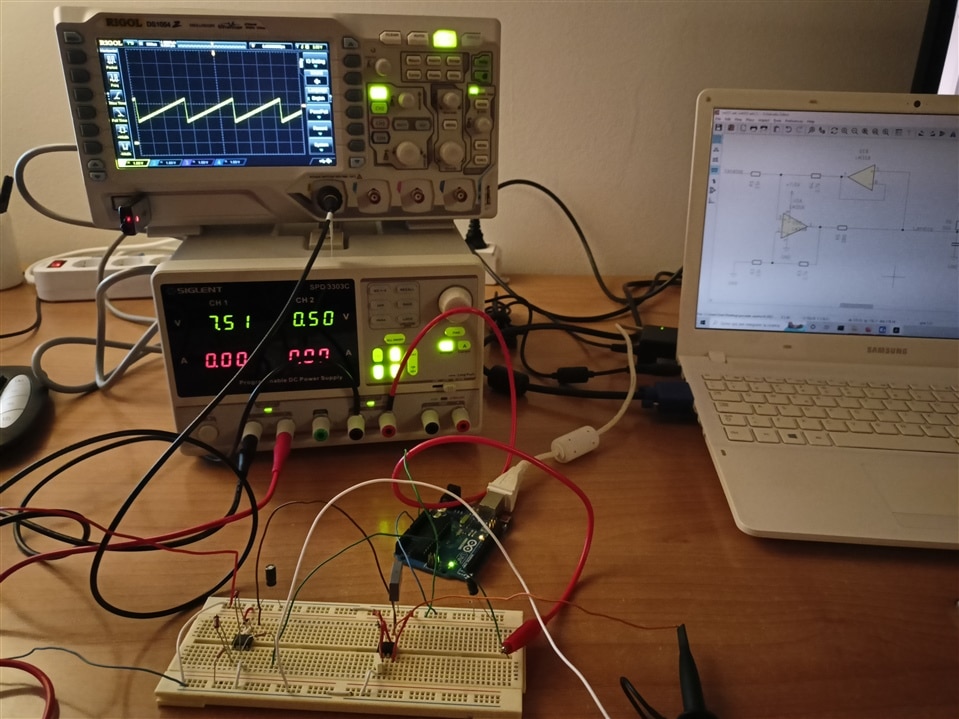
Now to the fun part: prototyping and testing!
Due to circuit simplicity, breadboard is the prototype technique of choice this time. In the final set up 5V rail to supply the circuit will be handled by and arduino uno board, which is also used to acquire data and display it over serial monitor, already converted into volt. Input signal is created with a bench power supply.
First circuit test: checking capacitor voltage waveform. During first test the current generator is supplied with 7.5V to avoid any possible saturation
Let's explore together this circuit:
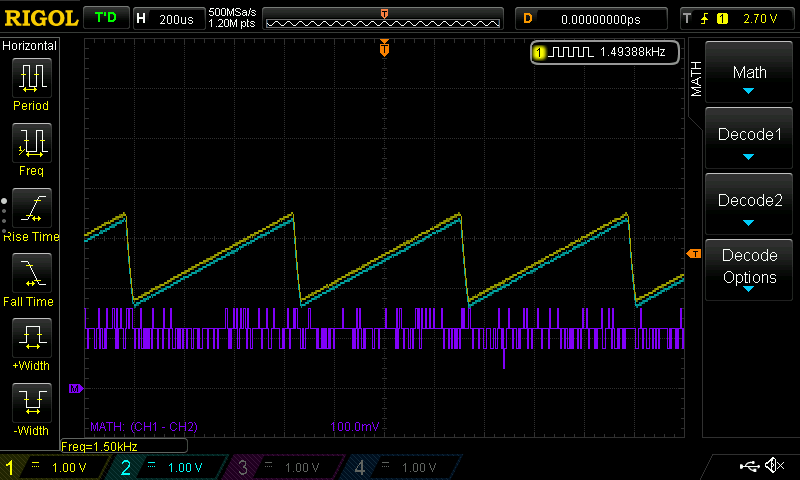 C1 voltage (blue) and opamp output voltage (yellow). The difference (purple) between those two signals is the voltage drop across R6 (around 120mV). No saturation visible here
 Increasing input voltage to 5V lead to a slight saturation of the LM358 (supply set to 5V), visible on the yellow trace
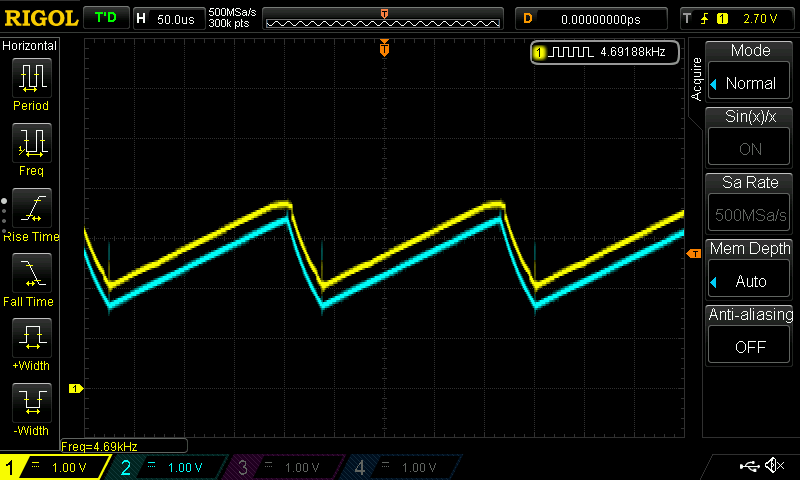
 This is the output signal: a square wave with a frequency proportional to input voltage. Reading it is pretty simple with any kind of microcontroller
As finalt touch, I decided to plot the curve that represent the ADC reading compared to input voltage from my power supply. The whole circuit is being powered up with 5V and the input voltage swing is between 0V and 5V.
Having the frequency to voltage conversion automatically done by the microcontroller played a big role to simplify this measure .
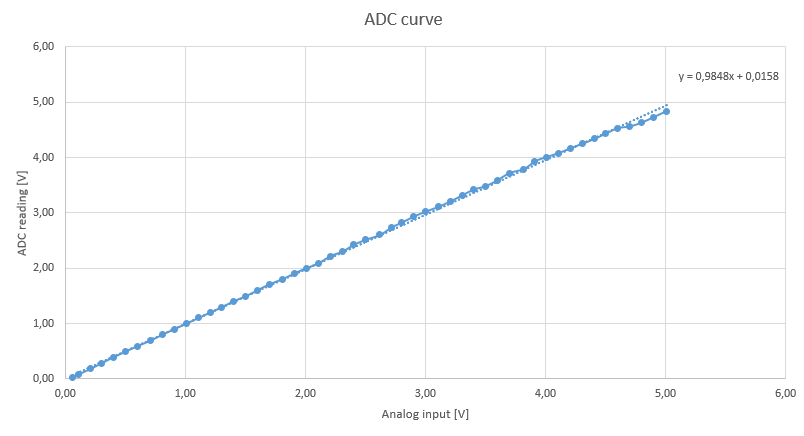 This is the final result! The solid line represent measured data, while the dotted line represent the fit. Equation of this rect is shown on top of it.
I have to say that it's much better than I would ever expected! We can see a bit of noise in measurement and a small drop in the upper portion of the graph (probably due to opamp saturation) but overall I'm extremely happy with the final result.
For sure there is room for improvement, but still I'm stoked about how well this concept works. Also, it has been a bit of time since I've built a circuit on a breadboard and I had a bunch of fun doing it again! For me this small project has been a great win, both for circuit performance as much as for the fun of building it.
I hope you enjoied it too
Bye!
-

DAB
-
Cancel
-
Vote Up
0
Vote Down
-
-
Sign in to reply
-
More
-
Cancel
-

strb
in reply to DAB
-
Cancel
-
Vote Up
0
Vote Down
-
-
Sign in to reply
-
More
-
Cancel
Comment-

strb
in reply to DAB
-
Cancel
-
Vote Up
0
Vote Down
-
-
Sign in to reply
-
More
-
Cancel
Children