


Introduction
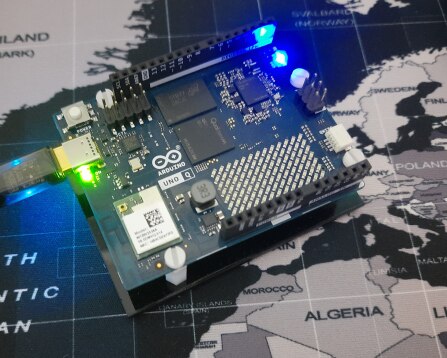
For the last few weeks, I’ve had an Arduino UNO Q sitting on my desk, quietly running Hermes Agent. Most of the time it is not seen. No screen, no blinking lights that signify anything, just a small board doing work I can't see.
Occasionally, I’d ssh in, run htop, stare at a wall of numbers, and close terminal again. It worked, but it never felt quite right.
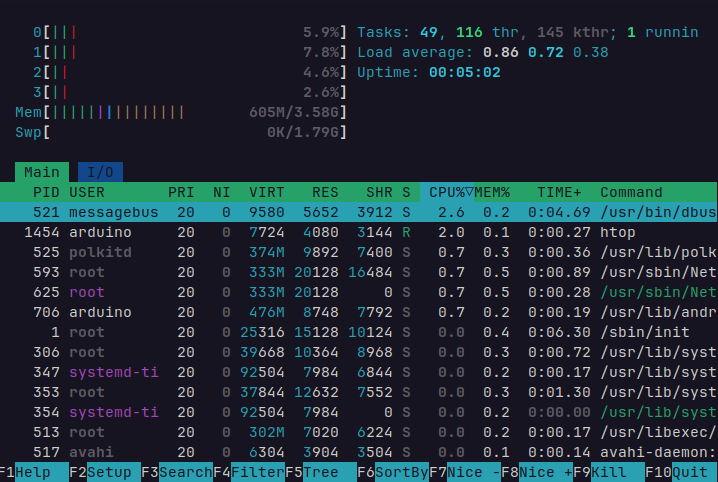
A machine that was actually doing something, thinking, responding, sometimes working hard enough to get warm, deserved better than a terminal window I had to remember to open.
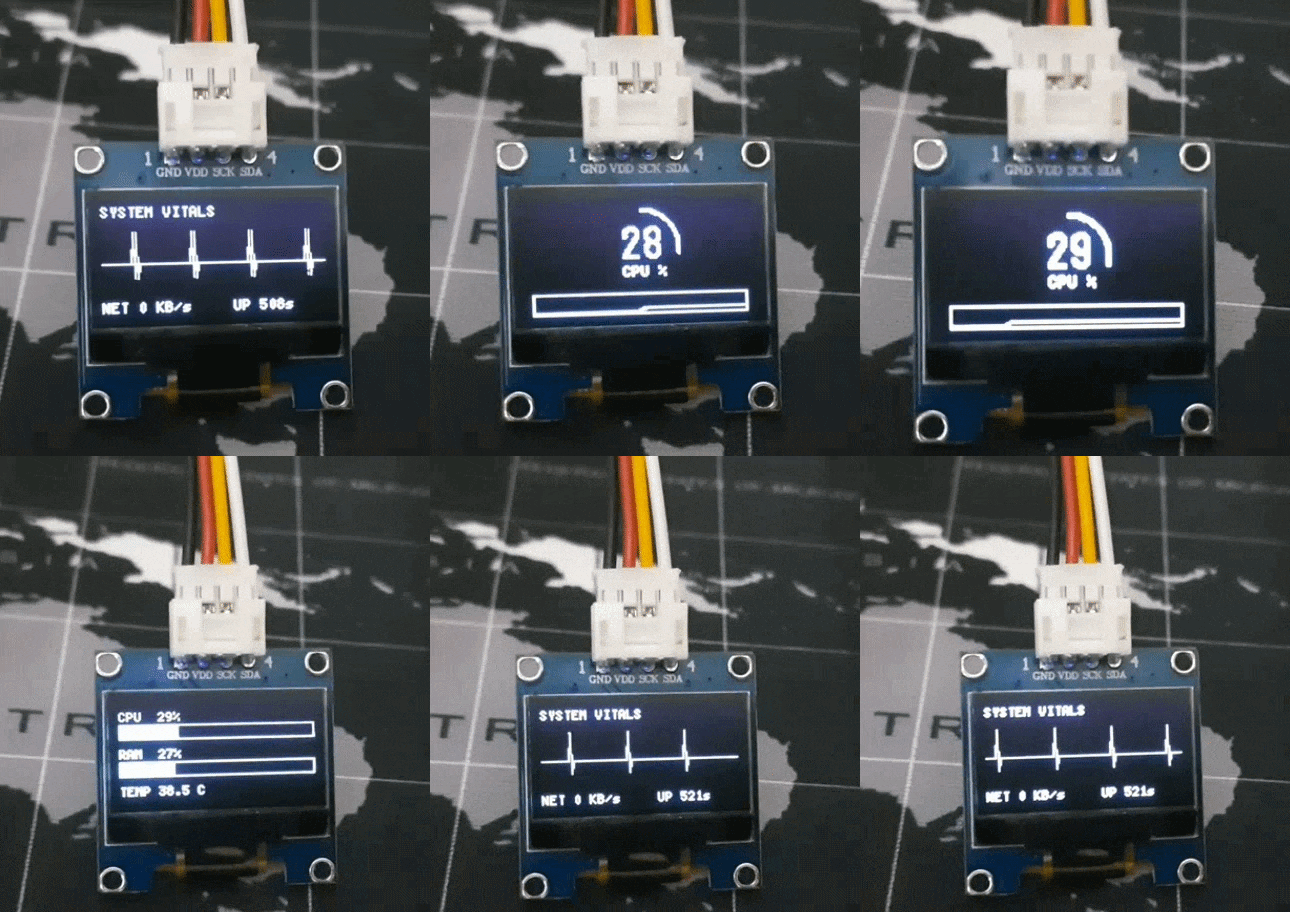
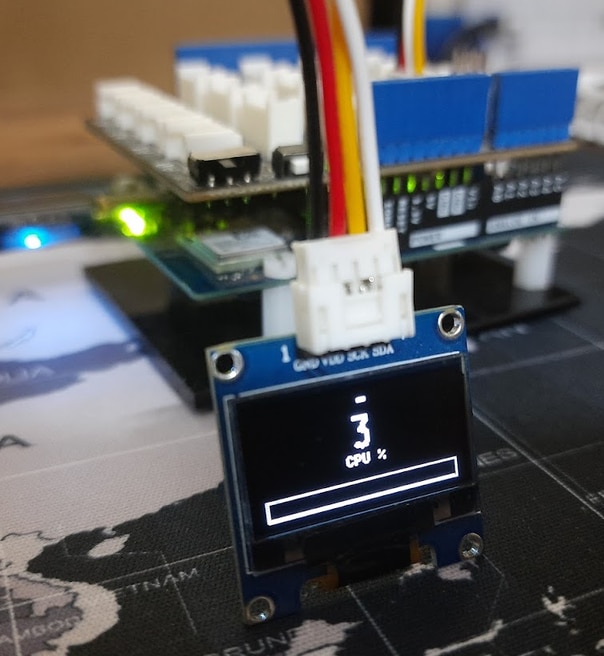
Hence, I added a small SSD1306 OLED display that was connected through I2C with the help of a Grove Base Shield and was in a position to show the CPU load, RAM, temperature, and network throughput on a rotating set of screens.
What made this project interesting, however, was not just the display but also coming up with a way of distributing the workload onto the two very different processors of an UNO Q as well designing user interface which does actually deserve a space on a 128x64 black and white screen.
Using the RPC Bridge
The UNO Q has the looks of any ordinary UNO board, yet hidden inside this usual form factor is a pair of controllers sharing a single PCB. One is Qualcomm’s Dragonwing QRB2210 SoC that is capable of running full Debian Linux, while the other is STM32U585 microcontroller functioning according to Arduino sketch model. Hermes exists on the Linux side and this side has a real filesystem built upon Linux allowing the use of Python and package management. The two sides communicate with each other over RPC layer Arduino calls Bridge - therefore one can call Bridge.call() in Python and this call will be caught in the sketch with the use of Bridge.provide().
Overall, the first real design question was which side should own the display. Driving the display directly from Python seems like the easiest path, because there are many libraries that work with display, direct I2C access and absence of any RPC layer to bother about. However, I did not want to go this route, because the Linux side of the board has real tasks to carry out. Whenever Hermes is busy on doing something with the aid of Python code, that Python
Thus, I changed the arrangement. The Linux's task is very clear: to poll psutil every second and tell it the values of the CPU, RAM, temperature, network throughput, and uptime.
def loop():
    cpu = psutil.cpu_percent(interval=None)
    ram = psutil.virtual_memory().percent
    temp = read_temp_c()
    net = net_kbps()
    uptime = int(time.time() - start_time)

    Bridge.call("update_stats", float(cpu), float(ram), float(temp), float(net), uptime)
    print(f"cpu={cpu:.0f}% ram={ram:.0f}% temp={temp:.1f}C net={net:.1f}KB/s")
    time.sleep(1.0)
The display is completely under the STM’s control, which is rendering whatever is on its mind as the latest known values. Therefore, even if the agent is lagging behind the Python cycle by one or two seconds, the on-screen animation will continue working because drawing the pixels does not depend on the agent's work.
In essence, the contract between the two processors is very simple: Bridge.call("update_stats", cpu, ram, temp, net_kbps, uptime) from Python and the handler that is registered through Bridge.provide_safe() on the other side. The _safe variant is important because it ensures that the callback runs in the main Python loop rather than some internal Bridge thread, so the handler can simply copy the values into some volatile global variables without worrying about possible race conditions. Everything that comes after that, the animation, the display rotation and the history, is up to the MCU only.
Building the OLED UI
Monochrome displays provide a different approach to design thinking than greyscale displays do. It does not include any shading or soft edges; pixels can either be on or off. Therefore, the solution lies not in some dithering tricks but instead in the good use of bold shapes and large white space instead of cramming in every single number into one dashboard.
The dashboard consists of three rotating screens that change every 4 seconds, with each screen having its own identity.
The Hero screen answers one question immediately: How much is the CPU currently working? A large table number displays the CPU usage percentage in the center.
void drawHeroScreen() {
  int cx = 64, cy = 26, r = 22;
  drawArcGauge(cx, cy, r, g_cpu);

  char buf[8];
  snprintf(buf, sizeof(buf), "%d", (int)g_cpu);
  u8g2.setFont(u8g2_font_logisoso18_tn);
  int w = u8g2.getStrWidth(buf);
  u8g2.drawStr(cx - w / 2, cy + 7, buf);

  u8g2.setFont(u8g2_font_5x7_tf);
  u8g2.drawStr(cx - 10, cy + 17, "CPU %");

  drawSparkline(4, 52, 120, 12);
}
The percentage is encircled with an arc that completes its rotation (clockwise) as load increases – the function works similarly to that of a battery indicator.
void drawSparkline(int x, int y, int w, int h) {
  u8g2.drawFrame(x, y, w, h);
  for (int i = 0; i < HIST_LEN - 1; i++) {
    int idx1 = (histIdx + i) % HIST_LEN;
    int idx2 = (histIdx + i + 1) % HIST_LEN;
    int x1 = x + (i * w) / HIST_LEN;
    int x2 = x + ((i + 1) * w) / HIST_LEN;
    int y1 = y + h - 2 - (int)(cpuHist[idx1] / 100.0 * (h - 3));
    int y2 = y + h - 2 - (int)(cpuHist[idx2] / 100.0 * (h - 3));
    u8g2.drawLine(x1, y1, x2, y2);
  }
}
There is also a 40-sample sparkline underneath, meaning users can see how recent CPU loads changed over time; for example, knowing the maximum number on the sparkline lets users distinguish between a momentary peak and prolonged load. An arc is created by a loop of cos()/sin() commands instead of looking for a lookup table, making it very cheap on a Cortex-M33 with an inbuilt FPU.
void drawArcGauge(int cx, int cy, int r, float pct) {
  float start = -HALF_PI;
  float end = start + TWO_PI * (pct / 100.0);
  for (float a = start; a <= end; a += 0.04) {
    u8g2.drawPixel(cx + (int)(cos(a) * r), cy + (int)(sin(a) * r));
    u8g2.drawPixel(cx + (int)(cos(a) * (r - 1)), cy + (int)(sin(a) * (r - 1)));
  }
}
The Vitals screen exchanges a simple interface with figures entailing the CPU and RAM levels along with a temperature reading underneath the bars.
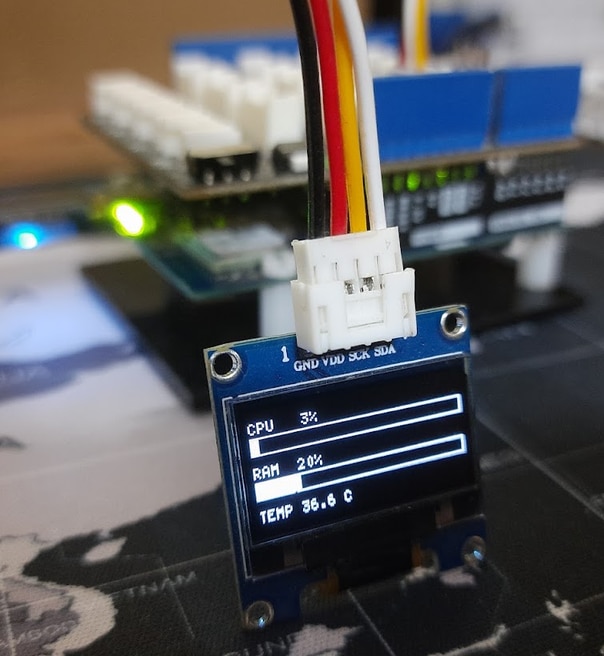
This would be his application is closest to htop but has been cleverly simplified into a format that one can read from afar.
void drawVitalsScreen() {
  drawBar(0, 14, 128, 10, g_cpu, "CPU");
  drawBar(0, 38, 128, 10, g_ram, "RAM");
  u8g2.setFont(u8g2_font_5x7_tf);
  char buf[24];
  snprintf(buf, sizeof(buf), "TEMP %.1f C", g_temp);
  u8g2.drawStr(0, 60, buf);
}
This is done intentionally as there is no need for any concepts with the features. A standard graph is a good enough idea and does the work well.
The Pulse screen is the most interesting and entertaining part of the whole project and connects the whole project with the purpose of what it does.
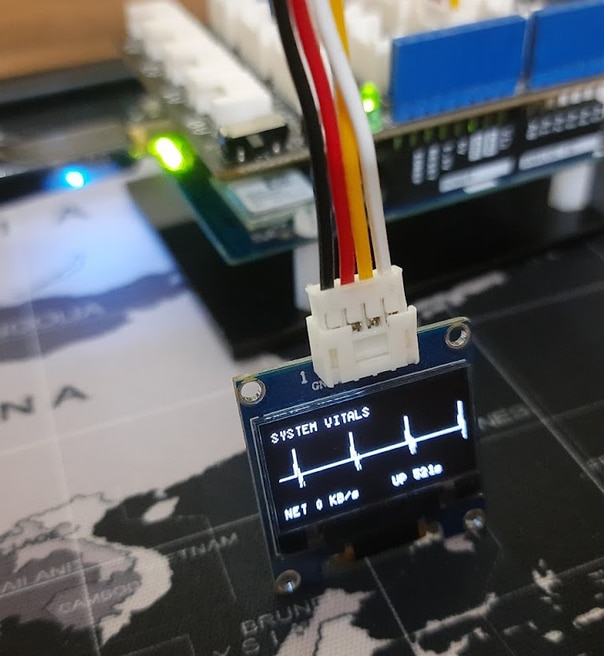
Unlike the previous screen, the Pulse uses ECG-style rolling wave features formed by a straight line with the peaks according to the CPU and RAM load. When idle, it beats slowly but speeds up in case of high-load situations.
void drawPulseScreen() {
  u8g2.setFont(u8g2_font_5x7_tf);
  u8g2.drawStr(0, 8, "SYSTEM VITALS");

  // Heartbeat speeds up as combined CPU+RAM load rises
  float load = (g_cpu + g_ram) / 2.0;
  int period = map((int)load, 0, 100, 40, 14);
  int scroll = (millis() / 20) % 4000;
  int baseline = 34;

  int prevX = 0, prevY = baseline;
  for (int x = 0; x < 128; x++) {
    int phase = (x + scroll) % period;
    int y = baseline;
    if (phase == period / 2) y = baseline - 18;
    else if (phase == period / 2 + 1) y = baseline + 8;
    u8g2.drawLine(prevX, prevY, x, y);
    prevX = x;
    prevY = y;
  }

  char buf[24];
  snprintf(buf, sizeof(buf), "NET %d KB/s", (int)g_netKbps);
  u8g2.drawStr(0, 62, buf);
  snprintf(buf, sizeof(buf), "UP %lus", (unsigned long)g_uptimeSec);
  u8g2.drawStr(74, 62, buf);
}
What's Next..
In this implementation of the project, simplicity in design has purposely been retained: on the Linux side of things, the software gathers available system information for utilization by the application while the STM32 takes care of all display and animation parts.
There remain a couple of ideas that need to be improved in the next iteration of the project.
One of them is storage monitoring. The fact that the UNO Q employs a container-based application architecture makes it impossible to guarantee proper measurement of the amount of storage used on the actual Debian system. The goal for the next incarnation of this idea would be reporting the usage of both the root and /home/arduino filesystems.
Another wish is to try to introduce more flexibility in configuring the dashboard. The existing four-screen rotation is perfectly convenient for a tiny 128×64 screen, but it would be quite interesting to provide the option to enable/disengage individual screens, change the rotation interval, or select statistics to be displayed.
All that said, here are the files needed if you wanna try this out using the Arduino App Lab
sketch.ino
// Runs on the UNO Q's STM32 (MCU) side. Receives system stats pushed
// by the Linux-side Python app over Bridge, and renders a rotating,
// animated dashboard on an SSD1306 OLED (128x64) via I2C.
//
// Wiring: SSD1306 Grove module -> any I2C port on a Grove Base Shield
// stacked on the UNO Q.
//   IMPORTANT: the UNO Q's I2C pins are 3.3V-only (not 5V-tolerant).
//   If the shield has a 3.3V/5V toggle switch, set it to 3.3V before
//   connecting anything: leaving it at 5V feeds 5V to the OLED's
//   SDA/SCL pull-ups and can damage the MCU.

#include "Arduino_RouterBridge.h"
#include <U8g2lib.h>
#include <Wire.h>

U8G2_SSD1306_128X64_NONAME_F_HW_I2C u8g2(U8G2_R0, /* reset=*/U8X8_PIN_NONE);

// Latest values pushed from the Linux side
volatile float g_cpu = 0, g_ram = 0, g_temp = 0, g_netKbps = 0;
volatile uint32_t g_uptimeSec = 0;

#define HIST_LEN 40
float cpuHist[HIST_LEN] = {0};
uint8_t histIdx = 0;

unsigned long lastFrame = 0;
unsigned long lastHistPush = 0;
unsigned long screenSince = 0;
uint8_t screen = 0;
const unsigned long SCREEN_MS = 4000;

// Called remotely by the Python side via Bridge.call("update_stats", ...)
void update_stats(float cpu, float ram, float tempC, float netKbps, uint32_t uptimeSec) {
  g_cpu = cpu;
  g_ram = ram;
  g_temp = tempC;
  g_netKbps = netKbps;
  g_uptimeSec = uptimeSec;
}

void setup() {
  u8g2.begin();
  u8g2.setBusClock(400000);

  Bridge.begin();
  Bridge.provide_safe("update_stats", update_stats);
}

void pushHistory() {
  cpuHist[histIdx] = g_cpu;
  histIdx = (histIdx + 1) % HIST_LEN;
}

// --- Drawing helpers ---

void drawArcGauge(int cx, int cy, int r, float pct) {
  float start = -HALF_PI;
  float end = start + TWO_PI * (pct / 100.0);
  for (float a = start; a <= end; a += 0.04) {
    u8g2.drawPixel(cx + (int)(cos(a) * r), cy + (int)(sin(a) * r));
    u8g2.drawPixel(cx + (int)(cos(a) * (r - 1)), cy + (int)(sin(a) * (r - 1)));
  }
}

void drawSparkline(int x, int y, int w, int h) {
  u8g2.drawFrame(x, y, w, h);
  for (int i = 0; i < HIST_LEN - 1; i++) {
    int idx1 = (histIdx + i) % HIST_LEN;
    int idx2 = (histIdx + i + 1) % HIST_LEN;
    int x1 = x + (i * w) / HIST_LEN;
    int x2 = x + ((i + 1) * w) / HIST_LEN;
    int y1 = y + h - 2 - (int)(cpuHist[idx1] / 100.0 * (h - 3));
    int y2 = y + h - 2 - (int)(cpuHist[idx2] / 100.0 * (h - 3));
    u8g2.drawLine(x1, y1, x2, y2);
  }
}

void drawBar(int x, int y, int w, int h, float pct, const char *label) {
  u8g2.drawFrame(x, y, w, h);
  int fillW = (int)(pct / 100.0 * (w - 2));
  u8g2.drawBox(x + 1, y + 1, fillW, h - 2);
  u8g2.setFont(u8g2_font_5x7_tf);
  char buf[16];
  snprintf(buf, sizeof(buf), "%s %3d%%", label, (int)pct);
  u8g2.drawStr(x, y - 2, buf);
}

// --- Screens ---

void drawHeroScreen() {
  int cx = 64, cy = 26, r = 22;
  drawArcGauge(cx, cy, r, g_cpu);

  char buf[8];
  snprintf(buf, sizeof(buf), "%d", (int)g_cpu);
  u8g2.setFont(u8g2_font_logisoso18_tn);
  int w = u8g2.getStrWidth(buf);
  u8g2.drawStr(cx - w / 2, cy + 7, buf);

  u8g2.setFont(u8g2_font_5x7_tf);
  u8g2.drawStr(cx - 10, cy + 17, "CPU %");

  drawSparkline(4, 52, 120, 12);
}

void drawVitalsScreen() {
  drawBar(0, 14, 128, 10, g_cpu, "CPU");
  drawBar(0, 38, 128, 10, g_ram, "RAM");
  u8g2.setFont(u8g2_font_5x7_tf);
  char buf[24];
  snprintf(buf, sizeof(buf), "TEMP %.1f C", g_temp);
  u8g2.drawStr(0, 60, buf);
}

void drawPulseScreen() {
  u8g2.setFont(u8g2_font_5x7_tf);
  u8g2.drawStr(0, 8, "SYSTEM VITALS");

  // Heartbeat speeds up as combined CPU+RAM load rises
  float load = (g_cpu + g_ram) / 2.0;
  int period = map((int)load, 0, 100, 40, 14);
  int scroll = (millis() / 20) % 4000;
  int baseline = 34;

  int prevX = 0, prevY = baseline;
  for (int x = 0; x < 128; x++) {
    int phase = (x + scroll) % period;
    int y = baseline;
    if (phase == period / 2) y = baseline - 18;
    else if (phase == period / 2 + 1) y = baseline + 8;
    u8g2.drawLine(prevX, prevY, x, y);
    prevX = x;
    prevY = y;
  }

  char buf[24];
  snprintf(buf, sizeof(buf), "NET %d KB/s", (int)g_netKbps);
  u8g2.drawStr(0, 62, buf);
  snprintf(buf, sizeof(buf), "UP %lus", (unsigned long)g_uptimeSec);
  u8g2.drawStr(74, 62, buf);
}

void loop() {
  unsigned long now = millis();

  if (now - lastHistPush > 250) {
    pushHistory();
    lastHistPush = now;
  }

  if (now - screenSince > SCREEN_MS) {
    screen = (screen + 1) % 3;
    screenSince = now;
  }

  if (now - lastFrame > 33) {
    lastFrame = now;
    u8g2.clearBuffer();
    switch (screen) {
      case 0: drawHeroScreen(); break;
      case 1: drawVitalsScreen(); break;
      case 2: drawPulseScreen(); break;
    }
    u8g2.sendBuffer();
  }
}
main.py
# Runs on the UNO Q's Linux (MPU) side.
# Polls system stats and pushes them to the STM32 MCU over Bridge.

# Runs on the UNO Q's Linux (MPU) side. Polls system stats and pushes
# them to the Arduino sketch (MCU side) over the Bridge RPC link.

from arduino.app_utils import *
import psutil
import time

start_time = time.time()
_last_net = psutil.net_io_counters()
_last_net_time = time.time()


def read_temp_c():
    """Best-effort SoC/CPU temperature in Celsius, 0.0 if unavailable."""
    try:
        temps = psutil.sensors_temperatures()
        for name in ("cpu_thermal", "soc_thermal", "coretemp"):
            if name in temps and temps[name]:
                return temps[name][0].current
        for entries in temps.values():
            if entries:
                return entries[0].current
    except Exception:
        pass
    return 0.0


def net_kbps():
    """Combined send+receive throughput in KB/s since the last call."""
    global _last_net, _last_net_time
    now_net = psutil.net_io_counters()
    now_time = time.time()
    dt = max(now_time - _last_net_time, 0.001)
    delta = (now_net.bytes_sent + now_net.bytes_recv) - (
        _last_net.bytes_sent + _last_net.bytes_recv
    )
    _last_net, _last_net_time = now_net, now_time
    return (delta / dt) / 1024.0


def loop():
    cpu = psutil.cpu_percent(interval=None)
    ram = psutil.virtual_memory().percent
    temp = read_temp_c()
    net = net_kbps()
    uptime = int(time.time() - start_time)

    Bridge.call("update_stats", float(cpu), float(ram), float(temp), float(net), uptime)
    print(f"cpu={cpu:.0f}% ram={ram:.0f}% temp={temp:.1f}C net={net:.1f}KB/s")
    time.sleep(1.0)


App.run(user_loop=loop)
