Inhale!!! Exhale!!
Inhale … Exhale ……
Take a deep breath, yeah you can feel it – air pumping in and pushing out from your lungs.
Wait… what if we could visualize it!! Like in terms of electrical signals
And here comes ‘Breathing AMP’ – an Impedance Pneumography based respiration monitor. Well, I am not looking forward for a full featured respiration monitor, which contains DAQ and Software too. Rather than today I’ll focus on the design of a Bio-impedance measurement amplifier which is the heart {analog front end] of the system. And as this design implements extensive use of Op-Amps in different configurations, I thought why not sharing it with you all in the Op-Amp-a-Palooza.
Background:
This design was a part of development of a respiration rate monitor at Biomedical Physics and Technology Department of University of Dhaka. I was the research engineer [hardware] of the team and designed it for measuring respiration rate. It can show the respiration pattern too. However, that’s a different topic, I am not going for the application – rather than I’ll get into the details of the design steps of the analog front end.
I have already posted blogs on the respiration rate measuring system before, but never got into the design details.
Well… before getting into the details, it’s better to briefly describe the technique - Impedance Pneumography.

Impedance Pneumography:
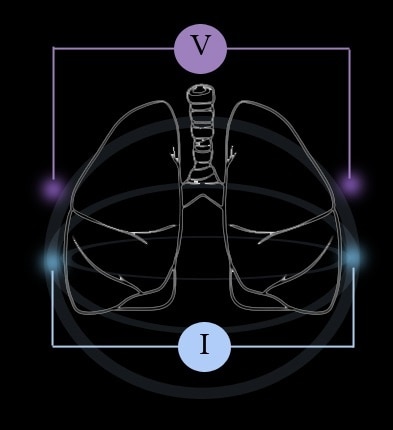
Impedance pneumography is a technique for measuring instantaneous lung aeration changes (breathing) as changes in the thoracic electrical impedance through skin electrodes.
IP is a commonly used technique for monitoring respiratory rate.
Leaving the physiological aspects apart, in short -
During inspiration as air gets in, the electrical impedance increases and during exhalation as air goes out, the electrical impedance of the lungs decreases. This change can be related to the changes in volume.

Basic principle –
The basic principle of this technique is pretty simple.
A limited current at certain frequency is passed through the body and the impedance is calculated by measuring the voltage output across the surface.

An alternating current of around 10KHz – 50 KHz is injected into the chest using surface electrodes. The current causes a potential difference that is measured between the electrodes.
The equivalent resistance = voltage in the receiving electrode(s) / the current applied to the tissue.
courtesy - Simple Wireless Impedance Pneumography System for Unobtrusive Sensing of Respiration
Mechanism:
Basically the overall system has four modules -
- Analog Front End
- Isolated Dual Rail Power Supply
- DAQ
- PC Software
Our interest will be on the Analog Front End and Dual Rail Power Supply.
- Current Source
- Sine wave generator
- Constant Current Source
- Voltage Measurement
- Bioamp - Instrumentation Amplifier
- Filter - Bandpass
- Rectifier
- Demodulator - Smoothing + High Pass with Gain
- Isolation
- Level Shifter + Opto Isolator
- Isolated Dual Rail Power Supply
A basic block diagram of the Analog Front End is presented below -

Analog Front End Circuit:


Wave Generator and Constant Current Source Voltage Measurement, Rectifier and Demodulator with Gain
Current Source:
The current source circuit has two parts -
- Sine Wave Generator
- Constant Current Source
Sine Wave Generator - [10KHz 1 - 2 Vp-p]
It can be produced in several ways. Most popular method would be using Wein Bridge Oscillator.

However, as I have used a microcontroller as a DAQ so I used a PWM signal from MCU at 10KHz square wave. Then passed it through a second order low pass filter to produce the almost sine wave.
I used 2nd order Salen key filter with butterworth response. -3dB at 10 KHz and -20dB at 40KHz. This produces clean sine wave out of the input square pulses. Output is passed through a buffer after that.


Constant Current Source - [Howland Constant Current Source at 1mA]
Using a potentiometer, 1v p-p sine wave was used as the input of the Howland Constant Current Source. Circuit was tuned to produce reasonable output at different loads.

Test Output of the Current Source
| {gallery}Current Source Test Output |
|---|
|
Wave generator input: 10KHz square pulse from MCU through Optocoupler |
|
Wave generator output: 10KHz almost sine wave |
|
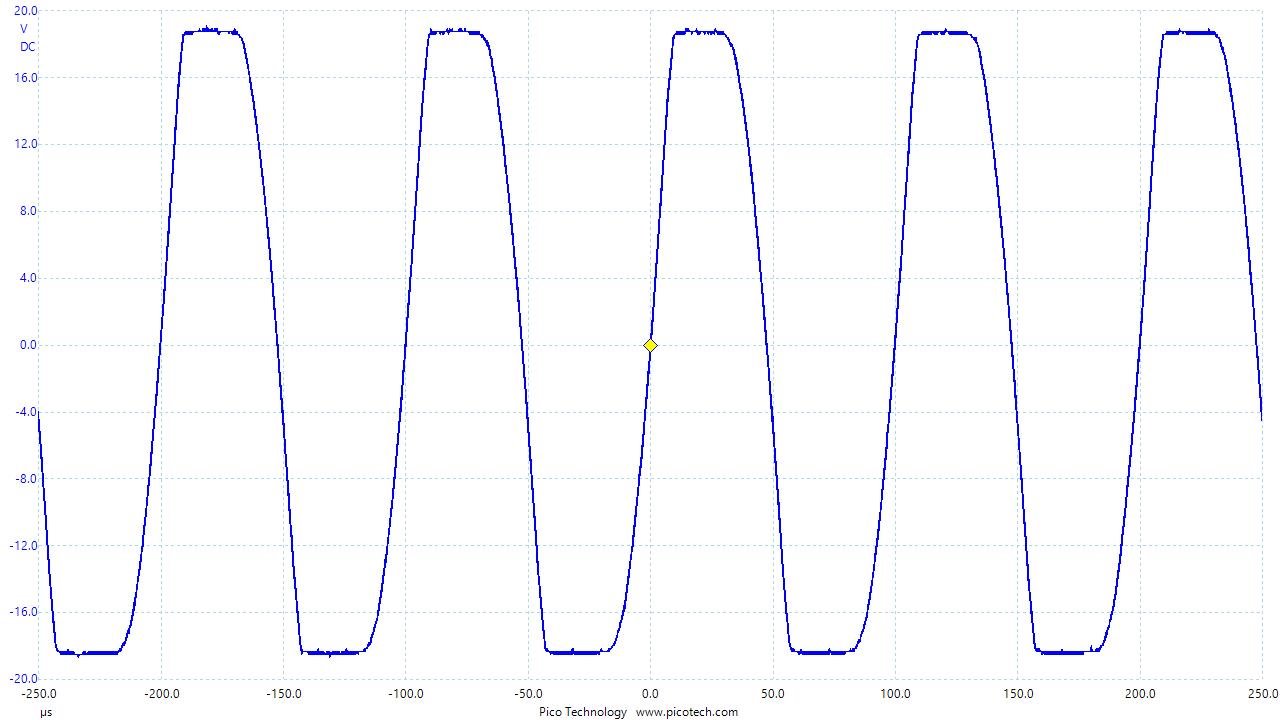
CC source output at no load: Output reached rail to rail |
|
CC source output at 1KOhms load: maintain almost 1mA output |
|
CC source output at 10KOhms load: maintain almost 1mA output |
Voltage Measurement:
The voltage measurement circuit has four parts -
- Bioamp - Instrumentation Amplifier
- Filter - Bandpass
- Rectifier
- Demodulator - Smoothing + High Pass with Gain
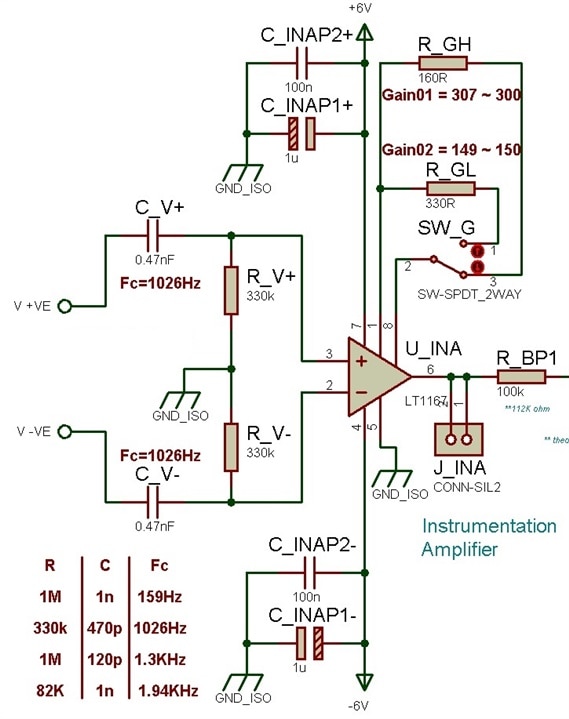
Bioamp - [Instrumentation Amplifier]
It measures the voltage induced due to the current source from the body electrodes. Instrumentation amplifier with high CMRR is necessary to reduce the 50Hz mains noise and to amplify the differential signal amplitude.
A high pass filter with Fc = ~ 1KHz is used at the inputs to reduce the bio-electrode potential and other low frequency components. First stage gain is selectable either 150 or 300.
Bandpass Filter - [Fc = 10KHz]
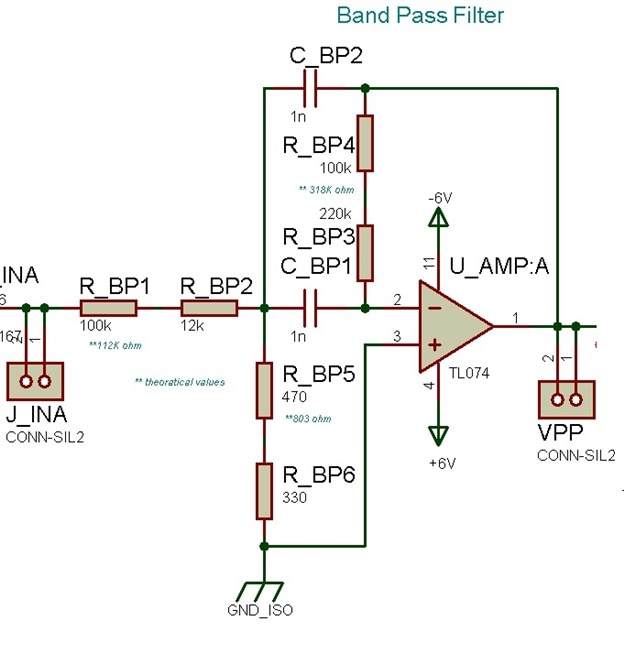
It removes signals with unwanted frequencies and emphasis the 10KHz carrier frequency.
filter parameters - Multiple Feedback Topology with Butterworth response
Center frequency = 10KHz with 1KHz narrow bandwidth.
+3dB at 10KHz
-3dB at 9.5K to 10.5KHz
-20db at 40 KHz

Rectifier and Smoothing - [DC average] 
The output of the Bandpass filter is passed through an active rectifier circuit which produces a modulated respiration signal at the carrier frequency of 10KHz.
A smoothing circuit produces a DC average output which carries the superimposed respiration signal.

High Pass Filter with Gain - [Fc = 0.7Hz]
DC average output which contains the respiration signal within the window is then passed through a High pass filter following a buffer amp. 0.7 Hz cutoff high pass filter removes the DC part. A second stage gain emphasis the window out of the rectified DC average output which gives a suitable representation of the demodulated respiration signal.

Test Output of the Voltage Measurement
| {gallery}Voltage Measurement Test Output |
|---|
|
Test Input: Sample 10KHz 1mV input at INA from external signal generator |
|
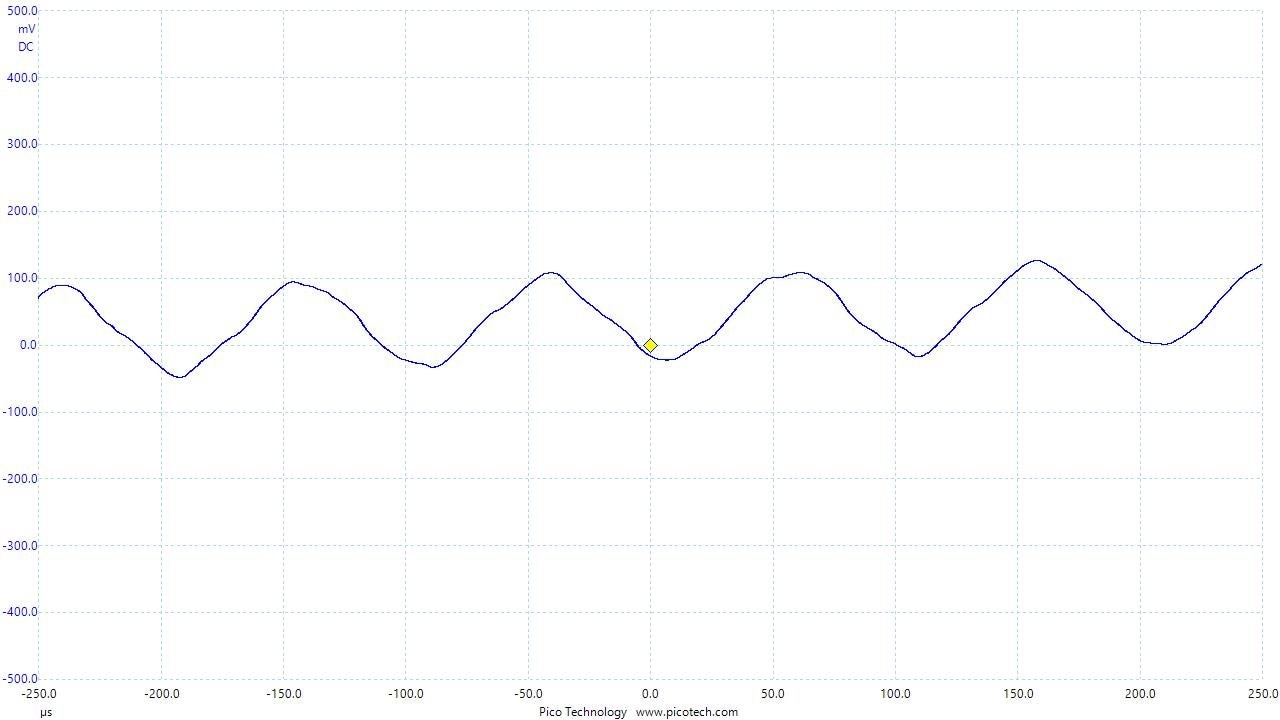
INA output: 10KHz output from INA with first stage gain of 150 - signal includes little bit 50Hz mains noise too |
|
Bandpass output: 10KHz clean output from the bandpass filter. Amplitude reduced. |
|
Rectified DC average output: DC output from the rectifier with smoothing filter. carries the modulated respiration signal within the window. |
|
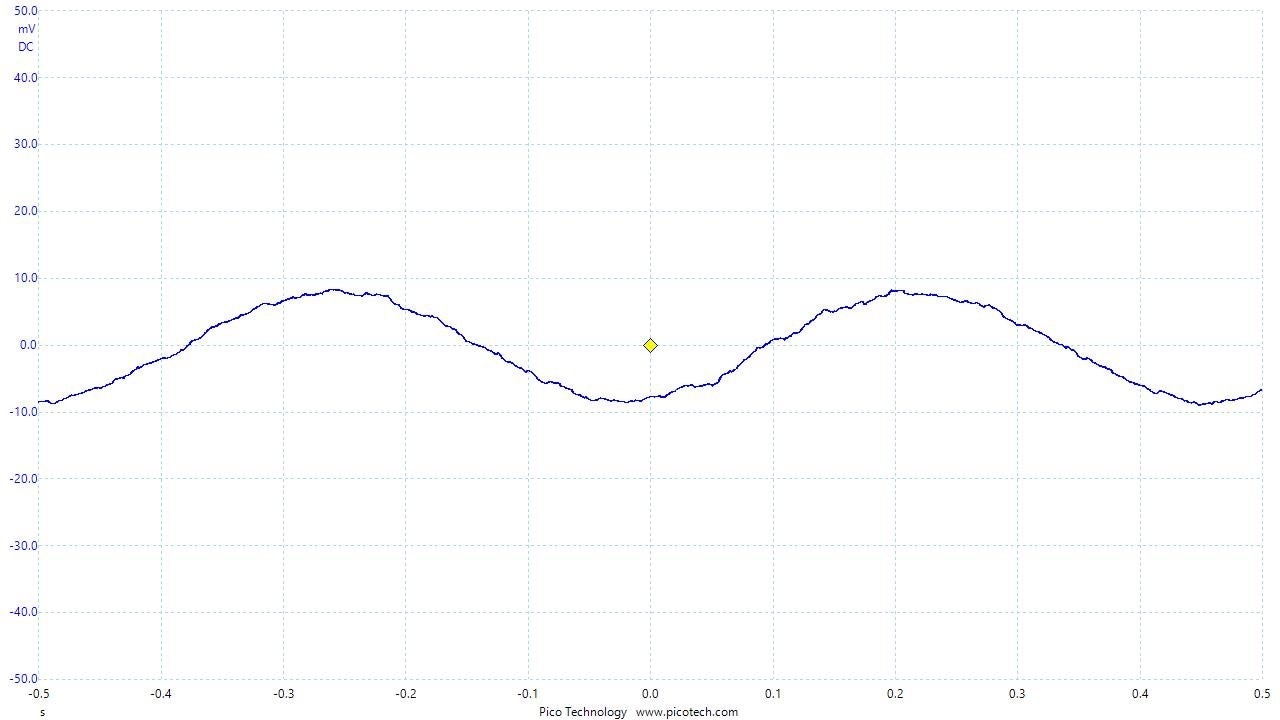
High pass filter output: 0.7Hz high pass filter removes the DC part. Output shows the demodulated respiration signal of about 2Hz and only about 16mV. |
|
Final output with gain: Second stage gain of about 100 provides a suitable respiration signal of about 1.5v peak to peak. |
Isolation:
There are a couple of sections to provide isolation to both power and signal -
- Level Shifter + Opto Isolator
- Isolated Dual Rail Power Supply
I have used op-amps in both sections.
Opto Isolator - [with Level Shifter]
To observe the final output on oscilloscope or to send the signal to the DAQ we need optoisolator. Oscilloscope has ground terminal directly connected to mains ground and DAQ is connected to the PC's ground through USB.
It reduces the noise and also provides the safety to the human body.
Optocoupler also provides certain amount of gain, I need to operate it within specific region by controlling the drive current. I have used a summing amplifier using op-amp with a certain gain to drive the optocoupler.
But the signal has negative part too. Therefore, I need to use a level shifter so that the negative part of the signal remains at the positive side to drive the optocoupler effectively.
One important part to mention that the input signal is inverted at this stage. This is because, optocoupler produces an inverted signal by itself.
The output of the optocoupler goes to the ADC of the MCU. Or it can be used to check the output using an oscilloscope.

Isolated dual rail power supply
A powerbank is used to provide the isolated power supply. But I need dual rail [+/- 6v].
A boost converter can increase the output voltage up to 12v. A voltage divider splits the supply in half. The midpoint is then feed to the buffer amp which provides the isolated ground terminal for the rest of the circuit.
The overall circuit draws very low current and the buffered output of the opamp is sufficient enough to drive the circuitry.

Output - [on PC software]
I have used a PC software to observe the output signal using the DAQ. Oscilloscope can be used too.
This software was developed by the research team of the Department of Biomedical Physics and Technology, University of Dhaka. It plots the impedance graph which gives the respiration pattern. There is a built-in respiration rate calculator.

Final Device
| {gallery}Final Device |
|---|
|
PCB 3D view: 3D view of the PCB design |
|
PCB design: PCB layout design |
|
Device within the chassis: Ready device within the chassis |
|
Device with palm electrode: palm electrode mostly used for babies |
|
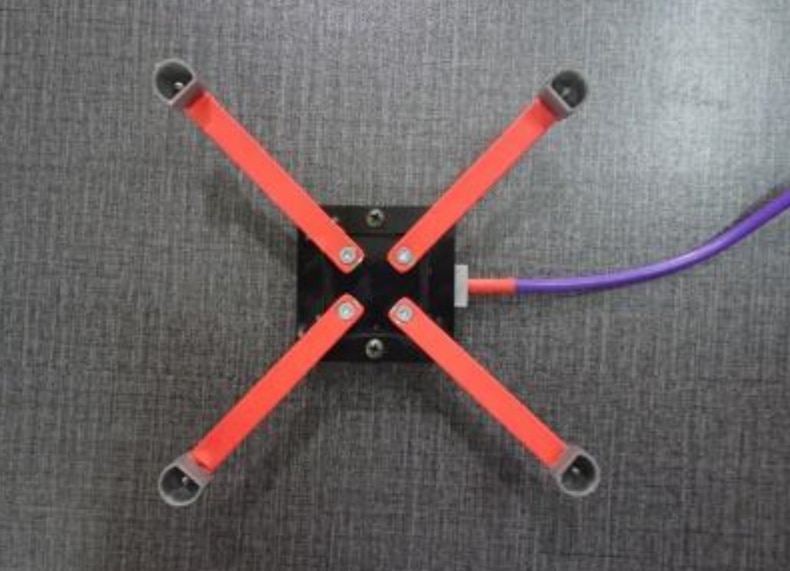
Eelctrode probe: Electrode with four probes [Tetra Polar]. |
|
Electrode in action: Electrode probe placed on the chest |
In this blog I have described all the modules in brief. These modules have used opamps and there are equations and design considerations, which are beyond this write-up.
However, if I get feedback from the community members, then I can try to post more blogs to describe the design considerations in details.
Well that's all for now. This project exclusively includes opamps. That's why I shared it in Op-Amp-a-Palooza.
Update: [5th May 2022]
Here is a video describing the mechanism and design of the Breathing AMP analog front end circuit.
Acknowledgment:
I worked on this project when I was a research engineer in BMPT, University of Dhaka. I designed the hardware with the help of my supervisor - Dr. Siddique-e Rabbani, I learned the basic mechanism in detail from him.
The PC software to visualize the respiration signal was developed by Ahmed Imtiaz, who was also a research engineer there. Another team member Moniruzzaman Monir improved the electrode later on.


