My project idea is to create an affordable Spectrophotometer for chemical analysis.
Block Diagram of the project

Brief Explanation of the Project
Chemical samples are analyzed through the photodiode and light source, The photodiode signals are fed to the amplifier circuit(MCP6292) to amplify the signal. The amplified signal is then filtered through an RC filter. after filtering the signal the analog signal is sent to the analog to digital converter pin of Arduino Nano. the microcontroller collects the converted data and processes the results and then transfers the data to the computer over the USB and Parallelly displays the data on the OLED Display.
I am following The Beer-Lambert Law to create this Spectrophotometer.
The Beer-Lambert Law
The Beer-Lambert Law (also called Beer’s Law) is a relationship between the attenuation of light through a substance and the properties of that substance. In this blog post, the definitions of transmittance and absorbance of light by a substance are first introduced followed by an explanation of the Beer-Lambert Law.
What are transmittance and absorbance?
Consider monochromatic light transmitted through a solution; with an incident intensity of I0 and a transmitted intensity of I (Figure 1).
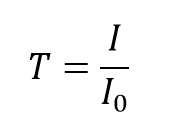
The transmittance, T, of the solution is defined as the ratio of the transmitted intensity, I, over the incident intensity, I0,
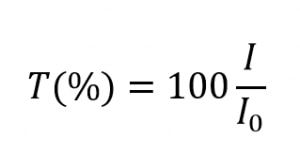
and takes values between 0 and 1. However, it is more commonly expressed as a percentage transmittance:
The absorbance, A, of the solution is related to the transmittance and incident and transmitted intensities through the following relations:

The absorbance has a logarithmic relationship to the transmittance; with an absorbance of 0 corresponding to a transmittance of 100% and an absorbance of 1 corresponding to 10% transmittance. Additional values of transmittance and absorbance pairings are given in Table 1. A visual demonstration of the effect that the absorbance of a solution has on the attenuation light passing through it is shown in Figure 2, where a 510 nm laser is passed through three solutions of Rhodamine 6G with different absorbance.
Example Table 1: Absorbance and Transmittance Values:
| Absorbance | Transmittance |
|---|---|
| 0 | 100% |
| 1 | 10% |
| 2 | 1% |
| 3 | 0.1% |
| 4 | 0.01% |
| 5 | 0.001% |
Example Figure 2: Attenuation of a 510 nm laser through three solutions of Rhodamine 6G with different absorbance values at 510 nm. The yellow glow is the fluorescence emission at ~560 nm.

Note: here ABS Is a short form of Absorbance
Absorbance is a dimensionless quantity and should, therefore, be unitless. However, it is quite common to see units of AU stated after the absorbance which are to said to either stand for arbitrary units or absorbance units.
What is the Beer-Lambert Law?
The Beer-Lambert law is a linear relationship between the absorbance and the concentration, molar absorption coefficient, and optical coefficient of a solution:
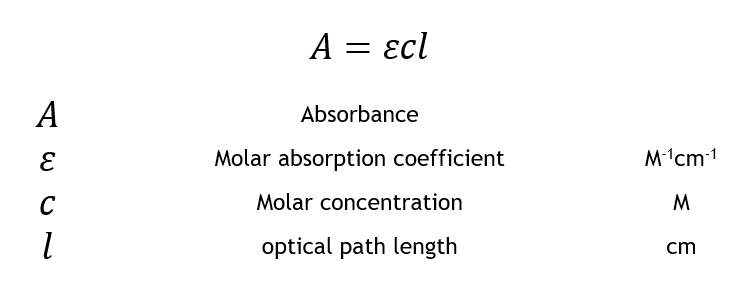
The molar absorption coefficient is a sample-dependent property and is a measure of how strong an absorber the sample is at a particular wavelength of light. The concentration is simply the moles L-1 (M) of the sample dissolved in the solution, and the length is the length of the cuvette used for the absorbance measurement and is typically 1 cm.
The Beer-Lambert law states that there is a linear relationship between the concentration and the absorbance of the solution, which enables the concentration of a solution to be calculated by measuring its absorbance.
The design
In this project to amplify the Photodiode signal, I have used A Op-amp mcp6292-e/ms along with the Arduino Nano and a led driver(PCA9533D). this device is powered through the USB cable which we normally use to program the Arduino nano. To place The liquid sample inside the device we need a cuvette, Here I am using Use and through Cuvettes.
To test the spectrophotometer working I have prepared different ratios of coomassie blue, Using these samples I will test the device and collect the data to make a final graph
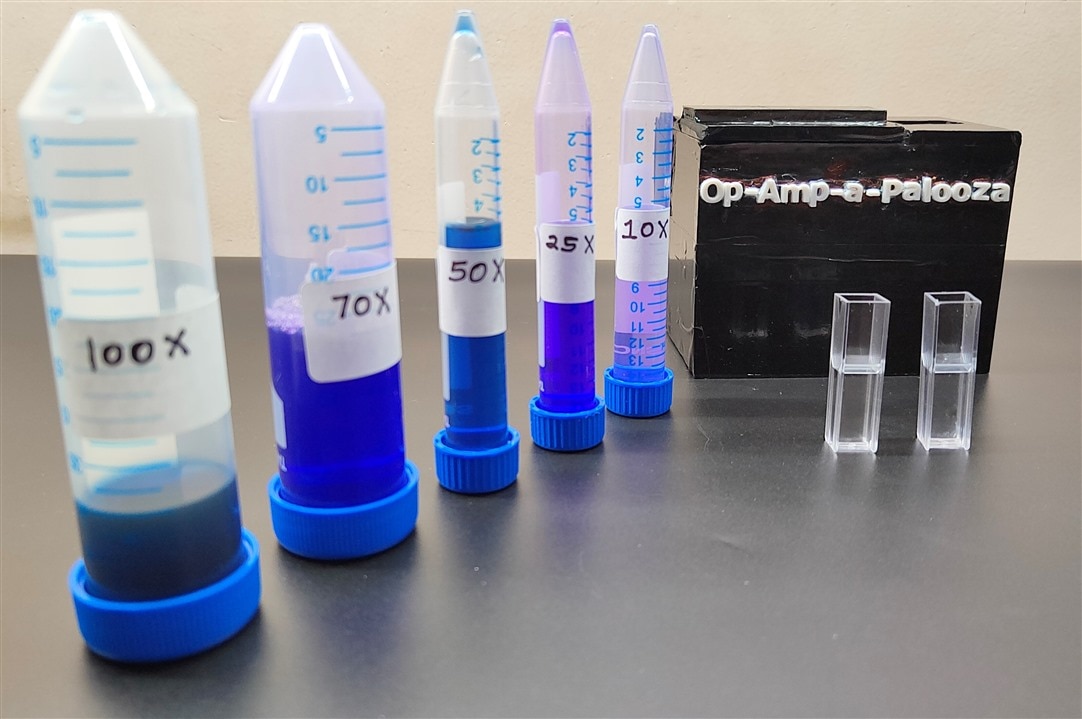
Fig. Finished Spectrophotometer

Fig. The Spectrophotometer

Fig. Top view of the spectrophotometer. In this, you can observe the results when there is no sample inside the cuvette.
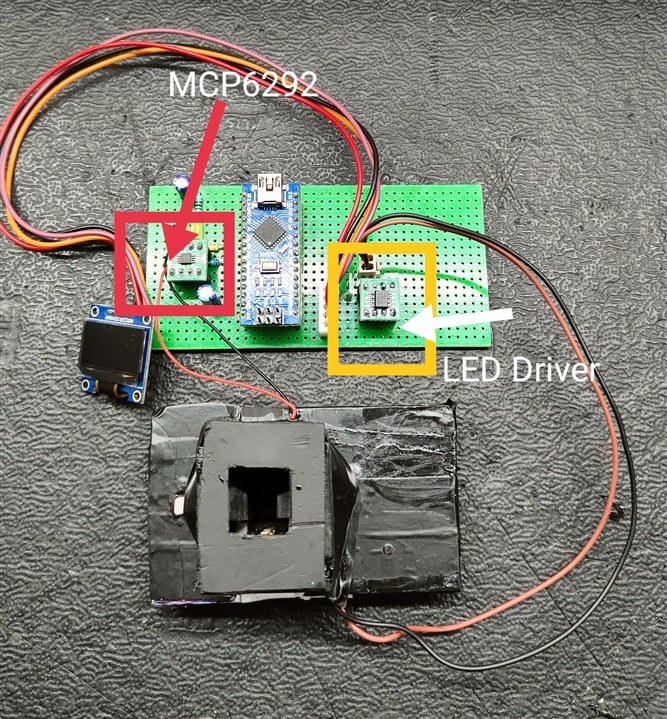
Fig. Components And PCB assembled inside the Box
in this project placing the source of light(LED Array) and Photodiode to test the liquid through the cuvette need to be more accurate, In the below images you can find the placements of the LED Array and Photodiode.
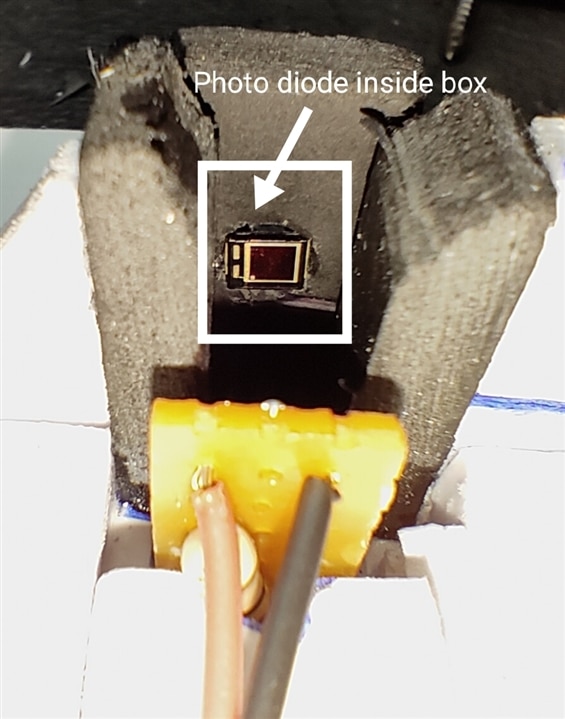
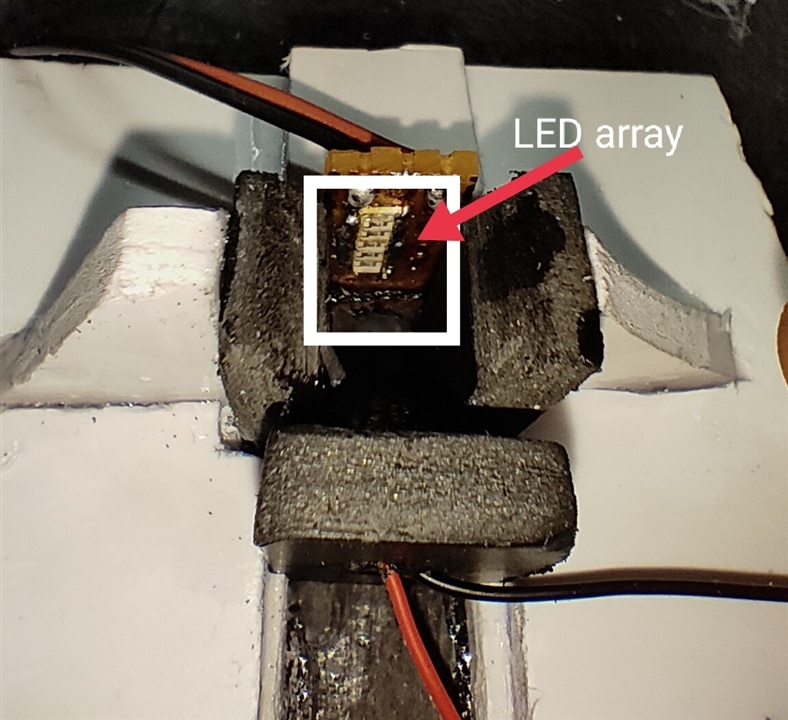
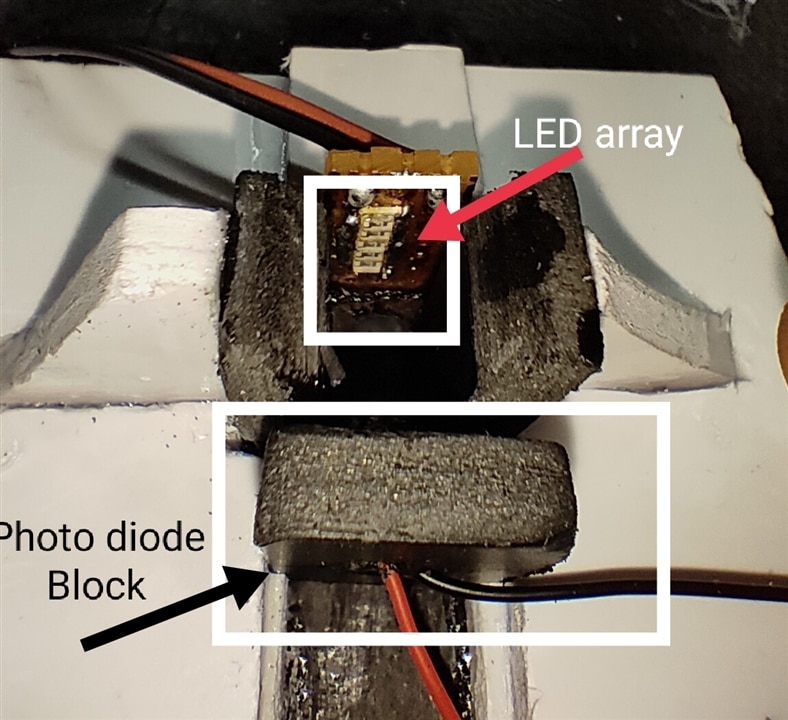
In the below images you can see the Open view of Cuvette and Photodetector with LED Array

In the below images you can see The arrangement of MCU, Photodetector, LED Array

In the below image you can see the cuvette is placed inside the holder and a blank No sample Test is running.

I tested the device using four liquid samples. These samples are The Coomassie Blue with 100x(Undiluted),75x(25% diluted), 50x(50% diluted),25x(75% diluted) samples . To see the testing of the device and to know about the results please watch the video completely.
The table below shows the results of the test


Circuit Diagram of the device

Programming Code
#include <math.h>
#include <Wire.h>
#include <Adafruit_GFX.h>
#include <Adafruit_SSD1306.h>
int opamp_pin = A0;
float opamp_data = 0;
float opamp_voltage = 0;
float supply_voltage = 5.0;
float difference_voltage = 0;
float transmittance = 0;
double a = 0;
double  b = 0;
#define SCREEN_WIDTH 128 // OLED display width, in pixels
#define SCREEN_HEIGHT 64 // OLED display height, in pixels
#define OLED_RESET     4 // Reset pin # (or -1 if sharing Arduino reset pin)
Adafruit_SSD1306 display(SCREEN_WIDTH, SCREEN_HEIGHT, &Wire, OLED_RESET);


void setup()
{
Serial.begin(9600);
if(!display.begin(SSD1306_SWITCHCAPVCC, 0x3C))
{
  Serial.println(F("SSD1306 allocation failed"));
  for(;;); // Don't proceed, loop forever
  }
  Wire.begin(0x62);   //I2C ADDRESS OF PCA9533
  delay(3000); // Pause for 2 seconds
}

void loop()
{
  PC9533();
 opamp_data = analogRead(opamp_pin);
 opamp_voltage = ((opamp_data * 5)/1024);
 a = log10(supply_voltage/ opamp_voltage);
 b = ((a)/(1*1.3));
 Serial.print("Op-amp Voltage:");
 Serial.print(opamp_voltage);
 Serial.println();
 difference_voltage = ((supply_voltage * 20) - (opamp_voltage * 20));
 transmittance = (100 - difference_voltage);
 Serial.print("transmittance:");
 Serial.print(transmittance);
 Serial.print("%");
 Serial.println();
 Serial.print("difference_voltage:");
 Serial.print(difference_voltage);
 Serial.println();
 Serial.print("a:");
 Serial.print(a);
 Serial.println();
 Serial.print("Concentration:");
 Serial.print(b);
 Serial.println();
 display.display();
 display.clearDisplay(); // Clear display buffe
 display.setTextSize(1); // Draw 2X-scale text
 display.setTextColor(SSD1306_WHITE);
 display.setCursor(0, 0);
// display.print("Op-Amp Voltage:");
// display.print(opamp_voltage);
 display.print("Transmittance:");
 display.print(transmittance);
 display.print(" %");
// display.setCursor(0, 10);
// display.print("Diff Voltage:");
// display.print(difference_voltage);
// display.print(" %");
 display.setCursor(0, 20);
// display.print("Concentration:");
// display.print(b);
  display.print("Absorbance:");
  display.print(b);
 display.display();      // Show initial text
 delay(1000);
}

void PC9533()
{
  Wire.beginTransmission(0x62);//I2C ADDRESS OF PCA9533
  Wire.write(0x11);      // PSC0 subaddress + Auto-Increment
  Wire.write(0x97);      // Set prescaler PSC0 to achieve a periodd
  Wire.write(0x80);      //Set PWM0 duty cycle to
  Wire.write(0x00);      //Set prescaler PCS1 to dim at maximum frequency
  Wire.write(0x99);      // Set PWM1 output duty cycle to
  Wire.write(0x30);  // Set LED0 on, LED1 off; LED2 set to blink at PSC0, PWM0; LED3 set to blink at PSC1, PWM1

  delay(1000);          // WAIT FOR 1SEC
 Wire.endTransmission(); // END TRANSMISSION
}
Working Video Of the Project
