


Introduction
Following on from the prod from Tariq that was sent in my goodies bag, this is my rather basic entry into the Project14 RF competition, which will allow me to check for the presence of partial discharge in high voltage apparatus by detecting the RF emitted during the discharge. Detection of partial discharge is a very complex subject and subject to many errors and utilising RF for monitoring is no exception to this. The methodology employed for RF monitoring is similar to that utilised for acoustic, transient earth voltage and radio frequency current transformer methodologies.
- Initial monitoring rapidly covering multiple apparatus to check for activity with the potential to find false positives
- Slow time consuming data capture and analysis to identify pulse rates, shapes and length with the intention to verify activity found in the initial method as genuine partial discharge
PDTect_RF is a detector that fits firmly into the first category. It allows large areas of switchgear and plant to be quickly monitored but will be subject to picking up noise around the area emitted by other RF apparatus. It can also be utilised alongside another detection methodology to give further indication that the activity may be genuine and warrants further investigation. As a guide, using apparatus that works to methodology 1, I can sweep a 20 bay high voltage distribution board within one to two hours using multiple methodologies. If I were to go straight ahead with the second methodology, that 20 bay board would probably take me a couple of days to collect data and analyse it.
Therefore the general methodology is to sweep apparatus rapidly with method 1 to identify potential areas that warrant further investigation using method 2.
There are numerous papers researching the RF wavelengths from partial discharge activity. The vast majority of my research for this project has come from the University of Strathclyde in Scotland in conjunction with a paper from The European Electromagnetics Conference in January 2019.
Partial discharge activity emits RF from in a wide spectrum from low Mhz up into multiple GHz, dependent upon the type of apparatus and the type of discharge activity. Predominantly, I am interested in partial discharge activity in air insulated apparatus which puts my detection needs between 50 MHz and 900 MHz. At the higher end of this bracket, around 700 to 900 MHz the discharge tends to be surface discharge, usually referred to as corona. Below the 700 MHz band, the activity tends to be more representative of discharge within solid insulation systems. Above the 900 MHz, the discharge activity tends to be within gas insulated switchgear, as I do not cover much GIS apparatus, this current model of PDTect_RF will not include this band.
Construction
The construction of the detector is relatively simple, I plan to have to bandpass filters, one to cover 50 to 700 MHz and the other to cover 700 to 900 MHz. These will each feed into an RF detector, that will rectify the signals received. Each rectified signal will be fed into a signal amplifier to output a higher, more easily detectable voltage. The voltage will be read by an Arduino, that will display the reading in a graph format.
I had planned to utilise some of the antennae that Tariq had sent to me, but I am a little concerned that these do not have a wide enough bandwidth and would limit the response of the detector. I will carry out some trial with these antennae and may look for some wider bandwidth units to test alongside.

The unit will be powered by an 18650 lithium cell and I will utilise a remanufacture combined voltage boost and cell charger board I have in my collection action of parts. As partial discharge activity is greatly affected by ambient conditions, especially humidity, I am going to build own a DHT11 sensor unit into the device. AN Arduino Mega and 2.1" TFT screen will be used to display the data in a bar-graph style. To finish with, I have a nice carrytec case from OKW to try and squeeze it into. The basic concept is shown below.

I did carry out some design work for some bandpass filters as I have struggled to find pre-manufactured bandpass filters with the frequency bands that I desired. These were all 7 stage Butterworth filters. I did find a 600 to 900 MHz standard bandpass filter from Mini-Circuits, so opted to utilise this to ease the build process a bit with the added bonus that it has RF shielding, that I will struggle to manufacture. Below is the schematic of the 50 to 750 MHz bandpass filter connected to the amplifier and then Arduino.

The following pictures show the build of the unit.
| {gallery} PDTect_RF Build in Pictures |
|---|
|
Switch and DC Jack Fitted to Case |
|
Battery holder, charging circuit, RF Filter and humidity sensor fitted |
|
Antennae fitted to rear of baseplate |
|
Baseplate fitted inside case |
|
RF Filters, detectors and amplifiers fitted |
|
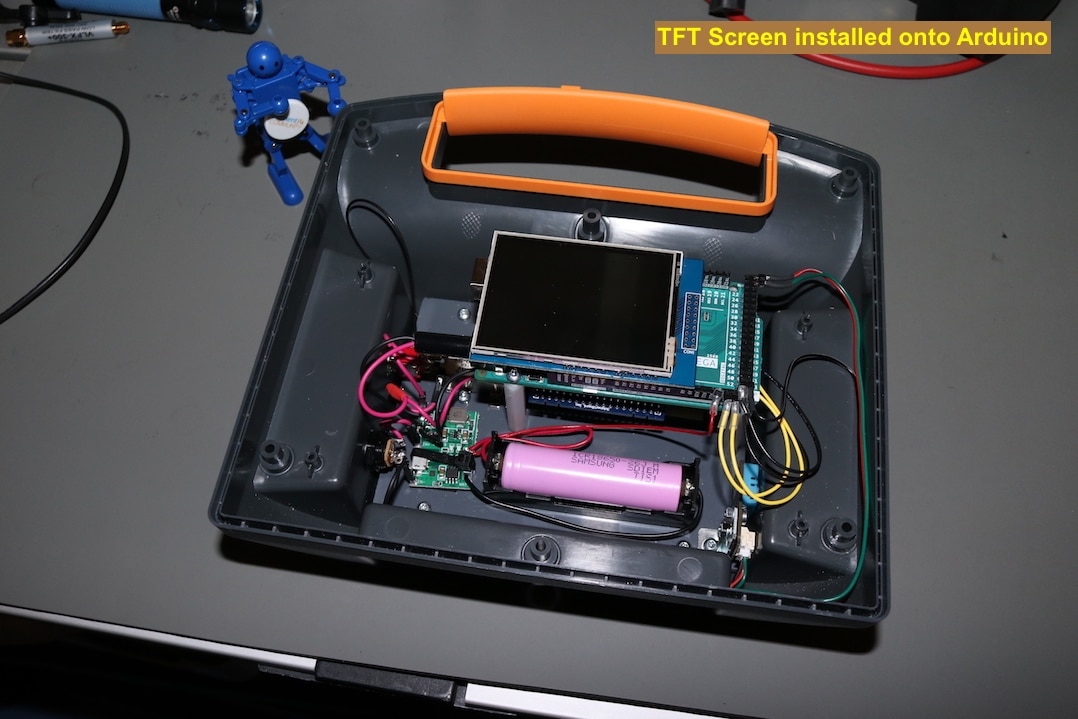
Arduino fitted |
|
TFT Screen fitted |


Arduino Code
The majority of the code for the Arduino came from a blog on the Arduino Project Hub - TFT Graphing: Bar Charts. The code is very clever and is basically a module that allows a bar chart to be personalised by modifying a few elements of the code and the module will do the rest. I have tweaked this to add in the code for the humidity and temperature sensor. At the moment this sensor is only read once just after the detector has started up.
//
// PDTect_RF
// Original Graph Code from Andrei FLorian 9/JUN/2018 - 10/JUN/2018


// NOTE - This sketch only supports 4 blocks in the chart


#include <Elegoo_GFX.h>    // Core graphics library
#include <Elegoo_TFTLCD.h> // Hardware-specific library
#include "Universum_TFTColours.h" // Universum library for colours
#include "dht11.h"


#define LCD_CS A3
#define LCD_CD A2
#define LCD_WR A1
#define LCD_RD A0
#define LCD_RESET A4
#define DHT11_PIN 23


Elegoo_TFTLCD tft(LCD_CS, LCD_CD, LCD_WR, LCD_RD, LCD_RESET);


dht11 DHT11;


// Global Variables
  int valueBlock[4];
  int posBlock[4];
  int prevPosBlock[4];

// Editable Variables
  bool proDebug = 0;                          // TODO - Debugging? 0 = No, 1 = Yes
  bool displayValues = true;                  // EDIT - Display Value of Blocks?

  uint16_t graphColor = BLUE;                 // EDIT - Prefered Colour of Graph
  uint16_t blockColor = GREEN;                // EDIT - Prefered Colour of Blocks

  String graphName = "RF PD Activity";             // EDIT - Title of Graph
  String graphBlock[] = {"400 MHz", "900 MHz"};   // EDIT - Names of Blocks

  int graphRange = 60;                      // EDIT - Max possible number of block, eg Potentiometer = from 0 to 1024, so 1024
  int numberOfBlocks = 2;                     // EDIT - Number of Blocks to display


// calculate values
  const int numberOfMarks = (numberOfBlocks * 2); // calculates amount of lines that mark x axis
  const int originX = 45; // the origin of the graph on the x axis
  const int originY = 200; // the origin of the graph on the y axis
  const int sizeX = 270; // the size of the chart on the x axis (lenght)
  const int sizeY = 150; // the size of the chart on the y axis (height)

  int boxSize = (sizeX / numberOfMarks); // calculates the size between the marks
  int mark[] = {boxSize, (boxSize * 2), (boxSize * 3), (boxSize * 4), (boxSize * 5), (boxSize * 6), (boxSize * 7), (boxSize * 8)}; // calculates the position of the marks


  const int minorSizeY = (originY + 10); // calculates the y origin of the marks
  const int minorSizeX = (originX - 10); // calculates the x origin of the numbers

  int numberSize = (sizeY / 6); // calculates the size between the numbers
  int number[] = {numberSize, (numberSize * 2), (numberSize * 3), (numberSize * 4), (numberSize * 5), (numberSize * 6)}; // calculates the position of the numbers


  int numberValue = (graphRange / 6); // calculates the value per number
  int val[] = {graphRange, (numberValue * 5), (numberValue * 4), (numberValue * 3), (numberValue * 2), numberValue}; // calculates the value of each number


void drawHome()
{
  tft.fillScreen(BLACK);
  delay(500);

  tft.setCursor(10, 10); // set the cursor
  tft.setTextColor(BLUE); // set the colour of the text
  tft.setTextSize(5); // set the size of the text
  tft.println("Universum");

  tft.setCursor(10, 80);
  tft.setTextColor(CYAN);
  tft.setTextSize(3);
  tft.println("0 to 750 MHz");


  tft.setCursor(30, 110);
  tft.setTextColor(CYAN);
  tft.setTextSize(3);
  tft.println("600 to 900 MHz");

  tft.setCursor(10, 160);
  tft.setTextColor(WHITE);
  tft.setTextSize(2);
  tft.println("RF PD Detector");
  delay(4000);


  tft.fillScreen(WHITE);
  delay(500);
}


void drawGraph()
{
  // draw title
  tft.setCursor(10, 10);
  tft.setTextColor(BLUE);
  tft.setTextSize(2);
  tft.println(graphName);


  // add humidity title
  tft.setCursor(75,35);
  tft.setTextColor(BROWN);
  tft.setTextSize(1.5);
  tft.println("Humidity - ");
  // add humidity value
  int chk = DHT11.read(DHT11_PIN);
  tft.setCursor(142,35);
  tft.println(DHT11.humidity);
  tft.setCursor(155,35);
  tft.println("%RH");


  // add temperature title
  tft.setCursor(185,35);
  tft.setTextColor(BROWN);
  tft.setTextSize(1.5);
  tft.println("Temperature - ");
  // add temperature value
  // int chk = DHT11.read(DHT11_PIN);
  tft.setCursor(265,35);
  tft.println(DHT11.temperature);
  tft.setCursor(280,35);
  tft.println((char)247);
  tft.setCursor(287,35);
  tft.println("C");


  // lcd.setCursor(0,0);
  // lcd.print("Temp: ");
  // lcd.print(DHT.temperature);
  // lcd.print((char)223);
  // lcd.print("C");

  // draw outline
  tft.drawLine(originX, originY, (originX + sizeX), originY, graphColor);
  tft.drawLine(originX, originY, originX, (originY - sizeY), graphColor);


  // draw lables
  for(int i = 0; i < numberOfMarks; i++)
  {
    tft.drawLine(mark[i], originY, mark[i], minorSizeY, graphColor);
  }


  // draw lable names
  for(int i = 0; i < numberOfMarks; i += 2)
  {
    tft.setCursor((mark[i] + 6), (originY + 10));
    tft.setTextColor(graphColor);
    tft.setTextSize(2);
    tft.println(graphBlock[i / 2]);
  }


  // draw numbers
  for(int i = 0; i < 6; i++)
  {
    tft.drawLine(originX, (originY - number[i]), minorSizeX, (originY - number[i]), graphColor);
  }


  // draw number values
  for(int i = 0; i < 6; i++)
  {
    tft.setCursor((minorSizeX - 30), (number[i] + numberSize));
    tft.setTextColor(graphColor);
    tft.setTextSize(1);
    tft.println(val[i]);
  }
}


void graph()
{
  // get the values of the sensors
  valueBlock[0] = analogRead(A14)* (60 / 1023);
  valueBlock[1] = analogRead(A15)* (60 / 1023);

  if(proDebug)
  {
    Serial.println(valueBlock[0]);
    Serial.println(valueBlock[1]);
    Serial.println("");
  }

  // map the sensor values to the graph size
  for(int i = 0; i < numberOfBlocks; i++)
  {
    posBlock[i] = map(valueBlock[i], 0, graphRange, originY, (originY - sizeY));
  }


  if(proDebug)
  {
    Serial.println(posBlock[0]);
    Serial.println(posBlock[1]);
    Serial.println("");
  }


  // draw the blocks - draw only if value differs
  for(int i = 0; i < numberOfBlocks; i++)
  {
    if(posBlock[i] > (prevPosBlock[i] + 2) || posBlock[i] < (prevPosBlock[i] - 2))
    {
      prevPosBlock[i] = posBlock[i];
      tft.fillRect((mark[i * 2] + 1), (originY - sizeY), (boxSize - 1), sizeY, WHITE);
      delay(10);
      tft.fillRect((mark[i * 2] + 1), posBlock[i], (boxSize - 1), (originY - posBlock[i]), blockColor);
    }
  }


  // display values of sensors if mode selected
  if(displayValues)
  {
    for(int i = 0; i < numberOfMarks; i += 2)
    {
      tft.setCursor((mark[i] + 5), (originY - 20));
      tft.setTextColor(BLACK, WHITE);
      tft.setTextSize(2);
      tft.println(valueBlock[i / 2]);
    }
  }
}


void setup()
{
  if(proDebug)
  {
    Serial.begin(9600);
    while(!Serial) {};
  }

  tft.reset(); // reset the screen
  delay(500);
  uint16_t identifier = tft.readID();
  identifier=0x9341;


  tft.begin(identifier);
  tft.setRotation(3);


  drawHome(); // draws the intro - Optional
  drawGraph(); // draws the graph
}


void loop()
{
  graph(); // graphs the values on the graph
  delay(200);
}
At the moment I haven't made any really alterations to the code from the original other than to change the titles and the range to suit my application. The screen is actually very nice and clear when it is all booted up.

I have not had chance to set up a high voltage test and do some measurements, these take quite a while to arrange. I had tried some of the lower frequency meters that I have transmitting around it, but these did not produce any reaction so I may have some calibration to do with the amplifiers. I do need to set up some tests with the 3 Series MDO on high voltage cables, so I will hopefully be able to test with PDTect_RF at the same time.
Improvements
I was going to add in the battery voltage to the start-up screen but I found out that the Arduino analogue inputs will leak current and back feed into the PCB and try to power up the Arduino. So that has been temporarily disconnected until I fit a circuit to disconnect the battery from the analogue input whilst the power is off.
There is also code available for time-based plots from the same author, it would be nice to add this as an alternative screen.
I would like to have some proper PCBs made up for the filters and amplifiers after I have carried out further testing. I may also choose to add in a third channel for higher frequencies. I already have the filter work completed for this, but want to test the existing boards and different antennae before committing too much.
I feel as though I need to secure the battery within the holder somehow, especially as this is intended as a handheld device to take around sites.
I want to make up a label for the front and another one for the side that has the DC Input and on/off switch.
Conclusions
There is still much to do with PDTect_RF, but in principle it loos as though a reasonably useful tool can be built up at a reasonably cost to enhance initial partial discharge monitoring utilising RF detection alongside the other sensors already available to me.
Top Comments