

This module is a guide to debugging, including concepts, approaches, and tool sets.

Programmable Devices V: A Guide to Debugging
Sponsored by
1. Introduction | 2. Objectives | 3. Debugging Concepts | 4. Analysis: An Example of Hardware Debugging | 5. Summing Up the Debugging Process | Related Components | Test Your Knowledge
One of the most exciting stages of a project is when we get the hardware back from the assembler for the first time. It is at this stage that we get to see our designs, which have previously only existed in simulation or on development boards, come to life. However, this stage can be nerve-wracking; for the first time, we are integrating not only the hardware design, but also the software and programmable logic designs. If the system is particularly complex and consists of several circuit boards, we need to check that each board works individually, ensure that it is safe to integrate with the rest of the boards, and verify that the system performs its function correctly. Of course, there will inevitably be issues that arise during integration and testing that need to be addressed.
This element14 ESSENTIALS learning module explores the mindset, approach, and tools sets that can be used to help us discover issues in our designs and ensure a successful delivery.
2. Objectives
Upon completion of this module, you will be able to:
 Gain an understanding of the debugging process
Learn about hardware debugging tools
See examples of software debugging tools and techniques
Become familiar with techniques and resources that can be helpful in debugging your application
Successful debugging has several overriding concepts:
1. Think about test access, debugging, and commissioning requirements from day one of the design. This needs to include relevant test points and access in the design, along with a test plan and expected results that indicate pass or fail. Additionally, identify any required test equipment (e.g., oscilloscopes, spectrum analyzers, debuggers), along with any custom type test equipment that must be developed.
2. Consider defensive design. For example, ensure power supplies can be isolated from downstream components on the first boards. This enables the power solution to be checked and verified without risking the downstream components.
3. For any issue that arises, the root cause of the problem must be identified to enable corrective action and ensure that the correction is not just masking the failure.
4. Focus on breaking the issue down into several smaller tasks that can be investigated.
5. Change only one parameter at a time. This helps identify the root cause.
6. Have multiple units for test. This will help identify a one-off issue versus an issue related to the entire production batch. An odd number of boards, like three, five, or seven works well.
7. Take detailed notes on the steps taken to create the issue so that it can be easily repeated.
8. Expect to find something. If you don’t find anything, ask yourself what you may have missed.
Think About Debugging from Day One
The best time to think about how you will debug a specific system is not when the need arises. You should be thinking about it on day one, when the system is being defined, long before a schematic is drawn or a line of code is written.
Thinking about test and debug access from the start means that we have identified how we might test and debug areas of the design, should the need arise. For an embedded system, this early planning may include:
1. Allocation of test points on voltage rails, resets, clocks, and other key signals.
2. For an external test, consider what signals might need access once the unit is assembled. For example, think about which test signals need to be accessible when the equipment is in a test chamber or on a vibration or shaker table.
3. Test access for tools, such as JTAG Pods and debuggers. These tools can be used to program and test not only programmable logic and processors, but also the board itself by using boundary scan technology. One thing to keep in mind, however, is that boundary scan technology requires significant preplanning in the design process to provide sufficient test coverage.
4. Are there any built-in test requirements for the system? Built-in test requirements can aid testing significantly; however, the built-in test system itself may need to be tested to ensure that it accurately reports health status.
No matter if we are integrating several boards or just a single board solution, we need to have a plan for testing and debugging. This plan needs to determine which element of the design is verified at each stage of the test program.
Documentation, Documentation, Documentation!
The ability to successfully debug an issue requires the capability to inspect and review the design. This means that accurate and detailed documentation is required, describing at least the following:
1. Requirements – The functional requirements the system is required to achieve.
2. Architecture of the Design – The features implemented in each system / subsystem.
3. Interface Definition – What are the internal and external interfaces being used, and what protocols and data rates are they using? Are custom / bespoke interfaces being used, and if so, do we understand how they are defined?
4. Register Descriptions – Detailed descriptions of the registers and their bits used in the design.
5. Test Requirements / Plans – These describe not only the expected result, but also any techniques and equipment used for specific tests.
6. Schematics – Schematics capture the hardware design. Reviewing the schematics will show the available test points in the design. These can be very helpful to find design issues that crept past your design reviews.
7. Layout – Describes the tracking of the hardware design. Layouts are useful for identifying the location of components and analyzing the tracking of the design in case there are issues (e.g. shorts and incorrectly placed components).
8. Datasheets – All of the datasheets and erratas from components used on the project should be in a central and accessible location.
9. Assembly Diagrams – These can be used to ensure components are fitted correctly.
Documentation is not only about design information; it’s also used to record issues (bugs) found during testing. As issues are identified, they need to be classified (e.g., hardware, software, electronics), and described with as much information as possible (scope plots, register settings, etc.). Issues should also be classified by importance and impact. Ideally, a specialist tool, such as Bugzilla or Github, can be used to create and monitor these reports.
While this process may seem onerous, it provides good metrics about the maturity of the design. The number of issues still considered open can be used to help the program management. Documentation also demonstrates due diligence. Each open issue should only be closed when the root cause and corrective action have been identified and agreed on by all stakeholders.
It’s also important that issues are closed by a relevant review board to provide independence from the design engineer.
Get into the Debugging Mindset
You will find bugs once you start testing. How we address them determines how stressed we might become as we try to determine the root cause. Debugging is a mindset; approaching it the right way can significantly reduce the stress and time spent investigating the issue.
If a bug arises, work through the following steps:
1. List the possible causes of the issue
2. Rank the possible causes from most likely to least likely
3. Investigate each cause in order of rank
Debugging Complex Problems
It is often best to include several members of the team on more complex problems, and, if possible, people independent of the project. For each issue, a list of possible causes should be developed. The next step is determining a hypothesis about how each potential cause could result in the issue being observed.
Once the hypothesis has been created, tests can be performed and data gathered. The engineering team reviews the data to determine the validity of the hypothesis. If valid, then corrective action can be taken in an attempt to rectify the issue. Changes should be made one at a time, after which the tests are rerun. If the hypothesis is not valid, then the next thing on the list can be investigated, and so on.
As data is gathered during debugging, it is critical to keep referring to the list of initial causes. This new information may provide more data that will steer the investigation in a specific direction.
As we are investigating an issue, it is critical to only change one parameter at a time. Changing multiple factors will result in confusion. If an issue is resolved with a change of more than one parameter, it is difficult to determine which parameter change had the impact.
What Do We Need to Debug?
Along with a plan and all the documentation outlined above, we will also need several tools and instruments to investigate the issue. These can be split between electronic debug tools and software / programmable logic debug tools.
Let’s first focus on the most used electronic debugging tools, which include the following:
Bench Power Supply – This is used to provide power to the unit under testing (UUT) with current limits and voltages accurately configured to ensure the safety of the UUT. When combined with an accurate digital multimeter, powering up with a low current limit set can identify if the power rails have any short circuits.
Digital Multimeter (DMM) – A digital multimeter is used to measure the voltage, current, and resistances. This can be used to measure circuit parameters while in operation (e.g., voltage and current), or be used to measure resistances in the circuit when powered off.
Oscilloscope – Oscilloscopes enable engineers to be able to visualize signals in the time domain in order to make more accurate measurements. For example, when measuring a DC supply voltage over a long period of time, the minimum and maximum voltages can be observed, instead of just the instantaneous voltage indicated by a DMM. An oscilloscope also provides the ability to view AC signals and data protocols. Modern oscilloscopes can be used to decode many protocols like UART, SPI, and I2C.
Logic Analyzer – Similar to an oscilloscope, a logic analyzer enables engineers to be able to trigger and observe digital signals. An example would be monitoring the address and data buses of a memory chip.
Spectrum Analyzer – Spectrum analyzers are very useful when working with mixed / analogue and RF systems, and they provide visualization of the signals in the frequency domain.
Vector Network Analyser – VNAs enable engineers to measure electrical networks. Typically, a VNA will measure the S-parameters of a system, which define the transmission and reflection of the network.
Signal Generator – A signal generator enables the generation of analog and RF signals. This supports the generation of test scenarios.
Pattern Generator – A pattern generator enables engineers to generate digital patterns, such as mimicked I2C or SPI transactions on a bus. This allows engineers to create custom scenarios that can be used to help prove or disprove a hypothesis.
Boundary Scan – Boundary scan uses JTAG-capable devices that are located on a board to test the connections between devices on a board. As a result, it can identify open and short circuits, in addition to identifying if connected memory is working correctly.
At this point, it is important to mention that all test equipment must be calibrated to ensure the most accurate measurements.
We are also seeing that it is possible to include debugging IP cores within the device itself when programmable logic devices are used. This can provide the engineer with more test access than what might be available on the board. However, inserting test logic in the device may disguise the issue at hand or introduce other issues, such as issues with timing. The use of these IP resources also requires the availability of spare logic resource capability within the device, because Lookup Tables (LUTs) and block RAM (BRAM) are used to capture the desired signals. Typical on-chip debugging resources include:
In-chip logic analyzers can be used to observe signals inside the device. They can also be useful for debugging internal issues, such as IP blocks not working together correctly.
Bus bridges enable AXI / Wishbone commands, among others, to be inserted over the JTAG network, allowing developers to configure registers without the need of a full software stack.
Virtual IO connects between the IO and the IP core, enabling the state of the input to be changed by the developer of JTAG. This allows the developer to change the inputs or outputs without the necessary action actually being taken in the system. This can be useful in simulating situations that might be hard to recreate at the hardware level.
Eye Diagram – Modern programmable logic devices use multiple high-speed interfaces that need good signal integrity (e.g., DDR3/4 and gigabit serial links). On-chip eye diagrams enable the developer to measure the signal eye on the board at run time to determine the signal integrity of the solution.
In-chip Bit Error Rate Tester (IBERT) – All communication links will experience errors. IBERTs enable external links to be tested and the bit error rate for the link established. This helps developers identify poor links quickly in order to investigate the root causes.
Software Debugging
If the application involves software, we will also need the ability to connect, download, and debug the software application in addition to the board and programmable logic test equipment. Typically, this is performed using a JTAG or a serial wire connection. Debugging tools are able to connect to the processor, reset it, download applications to its memory space, and of course, execute programs. During debugging, the execution of the program can be halted either under the command of the developer, or when specific lines of code or conditions are achieved in the code.
Software development tools provide their own debugging environments; however, a popular debugger application is GNU DeBugger (GBD). This application provides all of the necessary capabilities to connect to and debug a target.
Key concepts in software debugging include:
Breakpoint – Intentional pause of the program when a line of code is reached.
Watch Points – Interrupts the execution of the program when the watched variable changes value.
Disassembly – Enables compiled assembly code to be viewed during the debugging process.
Register & Memory View – Enables the content of registers and memories to be observed and changed as the program is paused.
One aspect that is very convenient in software debugging is the ability to single step through lines of code as they are executed. This allows us to view the contents of variables and memory as the program executes, showing any changes or unexpected values that might help with debugging.
When it comes to debugging software, there are differences between operating systems, whether it be bare metal or something more complex. In the case of a simple OS such as FreeRTOS, the debugger is able to stop the processor, and download the application and simple operating system. Once downloaded, the application will be executed and any debugging performed.
With a more complex operating system such as Linux, the debugger must be able to connect to a running target to download and debug the application. Typically, connecting to a running target requires a Wi-Fi or Ethernet link.
What is Bare Metal? Even simpler than an RTOS is Bare Metal. A Bare Metal device generally refers to a device with no operating system or other abstractions. Bare Metal programming takes place at the hardware level.
Reuse of Simulation
You will, of course, have performed a simulation as you developed your system at the hardware, programmable logic, and software levels. These simulations can also be important during debugging, because simulations can be updated appropriately as data is gathered. This enables the simulation to be more reflective of the real-world system and, hopefully, enable it to reproduce the error seen in the field. Being able to reproduce errors in the simulation is a significant benefit because it typically provides much more visibility of the overall system, versus what the board undergoing testing on the bench will do – and in a much faster timeframe.
In this example, a recent IoT board had been developed with several I2C and SPI sensors connected to a Xilinx Zynq® -7000 device. Before applications can be developed on the hardware, it must be proven. This includes ensuring that the sensors can communicate over the I2C or SPI bus.
Engineers can see which sensors are connected to each bus by using the I2C Tools Package in PetaLinux.
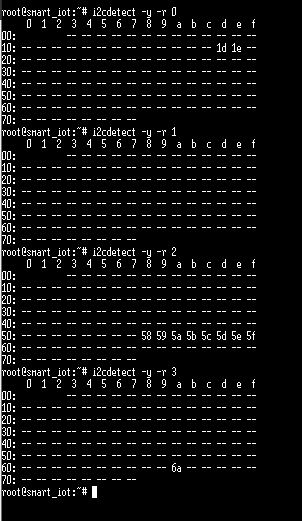
Figure 1: Running Test of I2C temperature sensor
However, when this test was initially run, it was expected that Bus 1 would have an I2C temperature sensor responding to address 0x70. A quick check of the board shows that the sensor was populated.
A few reasons why the sensor might not be responding came to mind:
1. The I2C termination resistors were not fitted or enabled in the FPGA IO.
2. The I2C device was incorrectly fitted on the board because the device is small.
Testing the first hypothesis would also provide information that may have helped us understand the second hypothesis.
By using an oscilloscope, the following (serial data) SDA and (serial clock) SCL lines were observed:
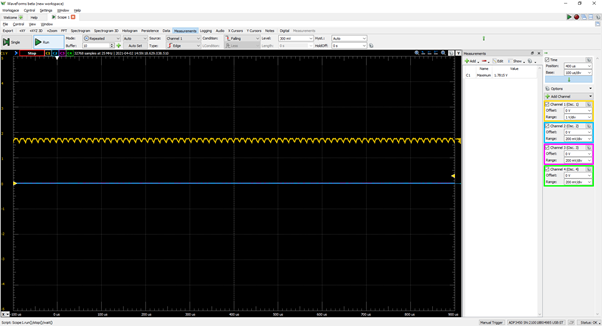
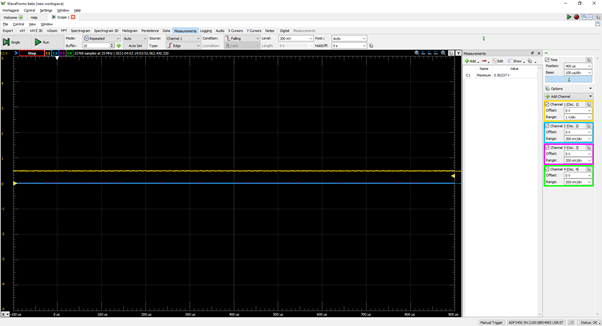
Figure 2: Observing SDA and SCL lines with Oscilloscope
This indicated that the SCL was sitting at the correct voltage, while the SDA line was lower at about 0.6 volts. We concluded that the SCL and SDA lines were correctly pulled up; however, something was pulling down the SDA line.
This was where the second hypothesis was considered. If the device was rotated incorrectly for placement, the SDA pad on the board would be connected to power, which would result in a situation similar to the one observed.
We confirmed this by looking at the layout and marking it up appropriately.
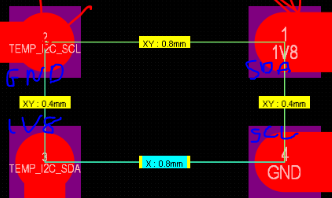
Figure 3: PCB Layout of Temperature Sensor and Checking SDA/SCL lines
To correct the issue at this point, the engineer would have to recommend removing the temperature sensor component, and rechecking the SDA and SCL lines, before rotating and fitting the component correctly.
Following the rotation and refit, the device was found to behave correctly.
Debugging Issues: You Are Probably Not Alone
As you are going through the debugging process, it may seem like you are the first person to stumble upon any issue. This is probably not the case, however, and there is a wealth of information available at our fingertips thanks to the Internet. I would recommend joining and contributing to electronics forums at element14, as well as manufacturer-specific forums with dedicated support. These forums provide a wealth of information and solutions that can often help address issues or provide tips and pointers for similar issues.
Debugging can be challenging. When things aren’t going your way, it can feel like you will never find the issue, much less fix it and ship the product. However, the root cause of the issue can be identified and corrected through a logical and focused approach of evaluating potential causes, doing various tests, and analyzing the data.
At times, it may feel a little like whack-a-mole; as one issue is fixed, another will pop up. Eventually, however, you will fix the final issue and the system will work flawlessly, and the feeling of accomplishment will make you forget all of the pain in the debugging process.
*Trademark. Xilinx is a trademark of Xilinx Inc. Other logos, product and/or company names may be trademarks of their respective owners.
Related ComponentsBack to Top
This element14 ESSENTIALS of Debugging learning module explores the mindset, approach, and toolsets that can be used to help us find issues in our design and ensure a successful delivery. To extend the knowledge covered in the main module, this supplementary guide discusses the types of related components used for debugging or product development.
Debuggers
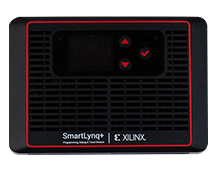
HW-SMARTLYNQ-PLUS-G Debugger / Programmer, Versal ACAP, ARM Cortex-A72 Microcontroller
Buy Now
The SmartLynq+ module is built for high-speed debug and trace, primarily targeting designs using the Versal platform. The SmartLynq+ modules provide up to 28X faster Linux download time via high-speed debug port and much-improved configuration throughput performance over previous debug products to accelerate the development cycle. The SmartLynq+ module supports both serial and parallel trace, with up to 14GB of trace memory to capture a detailed picture of design execution history. The SmartLynq+ module is fully compatible with Versal ACAP evaluation boards so that users have full visibility to the Versal architecture, including AI Engines, programmable network on chip, DDR memory controller, and 100G multirate Ethernet cores. The SmartLynq+ module features various host and target connectivity options, making it the most flexible debug product in the portfolio.
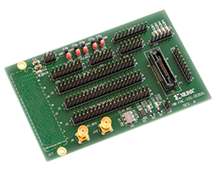
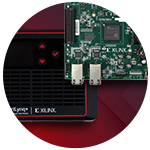
HW-FMC-XM105-G Debug Card, FMC Connector Adapter for Xilinx Spartan-6, Virtex-6 FPGA Mezzanine Cards
Buy Now
The FMC XM105 debug card is designed to provide access to many of the pins on the FMC connector found on Xilinx FMC-supported boards including the SP601, SP605 and ML605. The FMC XM105 debug card provides a number of multi-position headers and connectors which break out FPGA interface signals to and from the board interface. A serial I2C bus re-programmable LVDS clock source and a pair of SMA connectors provide differential clock sources to the FMC-supported board FGPA. A 2Kb serial IIC EEPROM provides non-volatile storage.
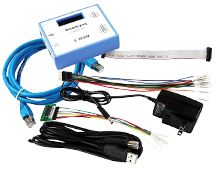
HW-SMARTLYNQ-G SMARTLYNQ Data Cable, Debug/Programmer
Buy Now
The SmartLynq Data Cable is a complete, all-in-one solution for programming and debugging Xilinx devices. The cable includes:
Supports JTAG rates up to 40 Mb/s with a voltage range of 1.2V to 3.3V.
Offers Ethernet and USB host-side connections.
Leverages industry standards, including JTAG boundary-scan IEEE Standard 1149.1 - Test Access Port and Boundary-Scan Architecture [Ref 1].
Supports all UltraScale, UltraScale+, and 7 series families as well as Zynq®-7000 SoCs and Zynq UltraScale+ MPSoCs.
Indirectly programs selected serial peripheral interface (SPI) flash memory or parallel flash memory devices via the device’s JTAG port.
Offers a 3.3V 8-bit general purpose I/O (GPIO) port.
Optimized for use with Xilinx® Vivado® design tools.
Development Boards
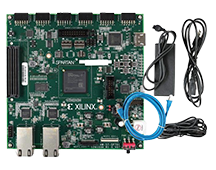
EK-S7-SP701-G EVALUATION BOARD, SPARTAN-7 FPGA
Buy Now
The SP701 evaluation kit, equipped with the best-in-class performance-per-watt Spartan®-7 FPGA, is built for designs requiring sensor fusion such as industrial networking, embedded vision, and automotive applications. The SP701 features high I/O availability and I/O expansion capability via Pmods and FMC connectors, making it the largest IP development canvas for Spartan-7 FPGA users. The included XC7S100 FPGA is the highest density device of the Spartan-7 family. With 102K logic cells and 400 I/O pins, the XC7S100 pairs expandable connectivity with high processing capability, all in a form factor ideal for edge applications.
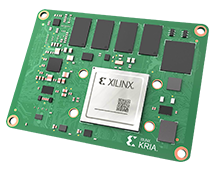
SM-K26-XCL2GI SYSTEM-ON-MODULE, ZYNQ ULTRASCALE+MPSOC
Buy Now
The Xilinx® Kria K26 system-on-module (SOM) is a compact embedded platform that integrates a custom built Zynq® UltraScale+ MPSoC that runs optimally (and exclusively) on the K26 SOM with DDR memory, nonvolatile storage devices, a security module, and an aluminum thermal heat spreader. The SOM is designed to be plugged into a carrier card with solution-specific peripherals. Key target applications include smart city, machine vision, industrial robotics, and AI/ML computing.
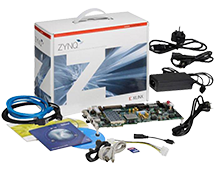
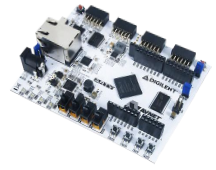
EK-Z7-ZC706-G Evaluation Kit, XC7Z045 FFG900 -2 AP SoC, Vivado® Design Suite, FPGA Mezzanine Card Interface
Buy Now
The EK-Z7-ZC706-G from Xilinx is a Zynq®-7000 all programmable SoC ZC706 evaluation kit. This kit includes all the basic components of hardware, design tools, IP and pre-verified reference designs including a targeted design, enabling a complete embedded processing platform. The included pre-verified reference designs and industry standard FPGA Mezzanine Connectors (FMC) allow scaling and customization with daughter cards. It is optimized for quickly prototyping embedded applications using Zynq-7000 SoCs and demonstrates an embedded design that targets video pipelines.
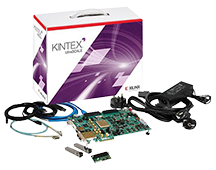
EK-U1-KCU105-G Evaluation Kit, XCKU040-2FFVA1156E FPGA, 10GBPS SFP+ modules, FMC Loopback Card
Buy Now
The EK-U1-KCU105-G from Xilinx is a Kintex® UltraScale FPGA KCU105 evaluation board. The KCU105 evaluation board for the Xilinx® Kintex® UltraScale FPGA provides a hardware environment for developing and evaluating designs targeting the UltraScale XCKU040-2FFVA1156E device. The KCU105 evaluation board provides features common to many evaluation systems, including a DDR4 component memory, a high definition multimedia interface (HDMI), two small form-factor pluggable (SFP+) connectors, an eight-lane PCI Express® interface, an Ethernet PHY, general purpose I/O and two UART interfaces. Other features can be added by using VITA-57 FPGA mezzanine cards (FMCs) attached to the low pin count (LPC) FMC and high pin count (HPC) FMC connectors. The Kintex UltraScale family delivers ASIC-class system-level performance, clock management and power management for next generation systems at the right balance of price, performance and power.
410-319 ARTY EVAL BOARD , ARTIX-7 FPGA
Buy Now
Arty is a ready-to-use development platform designed around the Artix-7 Field Programmable Gate Array (FPGA) from Xilinx. It was designed specifically for use as a MicroBlaze Soft Processing System. When used in this context, Arty becomes the most flexible processing platform you could hope to add to your collection, capable of adapting to whatever your project requires. Unlike other Single Board Computers, Arty isn't bound to a single set of processing peripherals: One moment it's a powerhouse chock-full of UARTS, SPIs, IICs, and an Ethernet MAC, and the next it's a meticulous timekeeper with a dozen 32-bit timers.
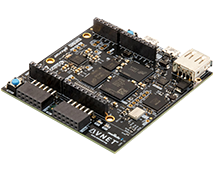
AES-MINIZED-7Z007-G Development Board, Zynq 7Z007S System-on-Chip (SoC)
Buy Now
The AES-MINIZED-7Z007-G from Avnet is a MiniZed single core Zynq 7Z007S development board. It targets entry level Zynq developers with low cost prototyping platform. This compact design features on-board connectivity through USB, Wi-Fi and Bluetooth. Peripherals can be plugged into dual Pmod compatible connectors, the Arduino compatible shield interface/USB 2.0 host interface. JTAG circuitry is incorporated onto a MiniZed base board, so with a single microUSB cable to your laptop, you are already up and running. MiniZed provides for an efficient hardware reference design, while it is also an inexpensive board that can be used to run workshops and tutorials. It aims to showcase the power of Zynq, where Cortex-A9 processor core integrates seamlessly with programmable fabric to provide signal processing and control solutions. The on-board digital microphone serves as an input for variety of illustrations of how to implement FIR filters, FFT’s and direct memory access.
Test Your KnowledgeBack to Top
Are you ready to demonstrate your knowledge of Debugging? Then take a quick 10-question multiple choice quiz to see how much you've learned. To earn the Programmable Devices V Badge, read through the learning module, attain 100% on the Quiz, and leave us some feedback in the comments section, and give the learning module a rating.
Top Comments