

Electromagnetic (EM) radiation consists of a broad spectrum of different wavelengths of light, both visible and invisible to the human eye. This spectrum can be analyzed using optical spectroscopy. An optical spectrometer breaks up light into a higher number of bands, and these spectral components of light can be used to analyze the characteristics of a wide range of materials. Spectrometers are key test instruments in multiple fields, from industrial to scientific research. They play crucial roles in several applications, including Process Control and Monitoring, Environmental Quality Analysis, Medical Diagnostics, Quality Control, Chemical Analysis, and Material and Polymer Analysis. In this learning module, we discuss different kinds of spectrometers, the basic concepts underlying the operation of an optical spectrometer, and various use cases.
2. Objectives
Upon completion of this module, you will be able to:
 Explain the different types of spectrometers
Understand the basic concepts and workings of an optical spectrometer
Discuss Broadcom’s Q-series (Qwave, Qmini, Qneo) spectrometers
Discuss applications using spectrometers
3.Scope
A spectrometer is an instrument that measures the variance of physical characteristics over a provided spectrum range. For example, a mass spectrometer measures the mass-to-charge ratio spectrum, and an NMR spectrometer measures the contrast of nuclear resonant frequencies.
One common application for spectrometers is analyzing food and agricultural samples. Near-infrared (NIR) spectrometers use light at NIR wavelengths to penetrate food samples, allowing the analysis of the composition inside the sample without causing any damage.
Different types of spectrometers are available, with common ones being optical spectrometers, nuclear magnetic resonance (NMR) spectrometers, and mass spectrometers. Optical spectrometers measure the characteristics of light and materials identified through variation in light intensity absorption and emission, along with wavelength. NMR spectrometers observe and evaluate the interplay of nuclei spins of a sample placed in a strong, sustained magnetic field. Mass spectrometers measure the mass-to-charge ratio of one or more molecules present in a sample and identify its composition of elements. Mass spectrometers have an ionization source that produces ions from the sample chemical substance under analysis, after which molecular weight can be determined using electric and magnetic fields.
The scope of this learning module is limited to optical spectrometers, the different types, their working principles, and Broadcom Q-series spectrometers, including Qwave, Qmini, and Qneo, along with their use case applications.
4. Basic Concepts
An optical spectrometer measures a sample's intensity of absorption, scattering, reflection, or emission of radiation in the spectrum's ultraviolet, infrared, or visible region (as illustrated in Figure 1). Materials in the sample can be recognized with changes in the absorption and emission of the light intensity at different wavelengths. All optical spectrometers share a common aspect: a wavelength selection mechanism.
Click below to enlarge image:

Figure 1: Electromagnetic Spectrum
Figure 2A illustrates the technological process of the optical spectrometer. Light enters through a narrow entrance slit. The slit size limits the amount of light to be measured and influences the spectrometer's optical resolution; a smaller slit size equals better resolution. The beam starts to spread, or becomes divergent, after it proceeds through the slit. A first mirror is used to collimate the beam, or to make the beam’s rays parallel. The collimated rays are then directed towards a grating, which separates the light into different wavelengths.

Figure 2A: The inside / technology of the optical spectrometer.


Figure 2B & C: Spectrometer measurement set up
A diffraction grating separates different wavelengths of light by reflecting them at different angles. The light reflected off the diffraction grating becomes divergent once again, and must be collimated, again using a collimating mirror. The collimated rays are then directed towards a detector, which measures the intensity of light for each of the wavelengths. The resulting data can be uploaded to a computer for further analysis. Contemporary spectrometer systems interact with computers via USB, Ethernet, or RS-232. Technological advances have enabled newer systems to transfer data wirelessly, via Bluetooth and Wi-Fi.
- 4.1 Optical Spectrometer Types
Wavelength
Ultraviolet (UV) Spectrometers
A UV spectrometer measures light absorption spanning the electromagnetic spectrum's ultraviolet range (between 180-400 nm) to determine the composition of the sample. The molecules in the sample absorb the energy from the UV light, exciting their electrons. The level of excitement is proportional to the wavelengths that each type of molecule can absorb, and these levels are used to determine the types of molecules present in the sample. A standard UV Spectrometer typically uses a deuterium arc, tungsten halogen, or xenon arc lamp as a light source. The detector can be a PMT, CCD, photodiode, or photodiode array. UV spectroscopy is employed by analytical chemists for quantitative diagnosis of different analytes, like transition metal ions, biological macromolecules, and highly conjugated organic compounds.
Visible (VIS) Spectrometers
A VIS spectrometer works in a similar fashion as a UV spectrometer; however, light in the electromagnetic spectrum's visible region (380-750 nm) is used instead. VIS and UV spectrometers share common applications and, by extension, industries as well. Many spectrometers are UV-VIS spectrometers, which cover both spectrums.
Near Infrared and Infrared (NIR & IR) Spectrometers
Near infrared and infrared spectrometers use infrared (750 nm to 1 mm) radiation to induce vibrations in the molecules of a sample. Because different molecules absorb specific frequencies that are characteristic of their structure, measuring the absorption of the sample for a range of wavelengths can successfully identify its chemical composition. NIR & IR spectrometers are used in various applications such as protein characterization, nanoscale semiconductor analysis, space exploration, and compound identification.
Light Interaction
Spectrometers work on different principles, taking advantage of the behavior of light in order to make their measurements. These are some examples of how spectrometers function.
Absorption Spectrometers
Absorption spectrometers measure the radiation absorption of a given sample. In any sample, the absorption intensity changes with the frequency of the light, and this variation is used to generate an absorption spectrum. The absorption spectrum is effective at determining the concentration of compounds present within a sample. Absorption spectrometers are found in remote sensing, atomic and molecular physics, and astronomy. The UV, VIS, and NIR spectrometers previously discussed have been described as absorption spectrometers.
Reflectance Spectrometers

Figure 3: The operating principle of reflectance spectrometers
Reflectance spectrometers measure the quantity of scattered or reflected light from a sample. Figure 3 illustrates the scattering of light reflected from or passing through a sample after it has arrived from the light source. A detector, usually a CCD or photodiode, measures the light reflected throughout the spectrum, enabling a reflectance versus wavelength plot to be generated. Reflectance spectrometers are widely used in the medical industry to offer information related to tissue concentration. They are also used in environmental science and geology.
Transmittance Spectrometers

Figure 4: The operating principles of transmittance spectrometers
Transmittance spectrometers measure the amount of light that a sample lets flow through it unaffected. Figure 4 illustrates the typical setup of a transmittance spectrometer. The wavelengths where the sample absorbs the least will have the highest amount of transmission, and vice versa. Transmittance spectrometers are frequently used in pharmaceutical analysis.
Scattering Spectrometers
Scattering spectrometers measure the amount of light that is scattered when it passes through a sample. While most light continues on its original path when passing through a material, some photons change course. This is caused by the light’s energy exciting the vibrational modes of the molecules in the material, and scattering it at a diminished energy level. This is known as Raman Scattering or the Raman Effect. The vibrational change in the sample can be analyzed to determine properties like chemical composition, crystallinity, and molecular interactions. Scattering Spectrometers are commonly used in the chemical and pharmaceutical industries, where they help with tasks such as identifying molecules, investigating chemical bonding, and discovering counterfeit drugs inside packages.
Raman Spectrometers
Raman spectrometers take advantage of the way light interacts with the chemical bonds in a sample. A Raman spectrometer uses a filter designed to remove light scattered by other methods (such as Rayleigh scattering) in order to limit the measurements to Raman scattered light. The filtered light is then used to generate the Raman spectrum of the sample. The light source in Raman spectrometers is a continuous-wave laser. Raman spectrometers analyze the material and produce data related to chemical structure, impurity, contamination, phase and polymorphism, and intrinsic stress/strain.
- 4.2 Broadcom’s Optical Spectrometer Range
Broadcom’s range of compact modular spectrometer devices include the Qwave, Qmini, and Qneo series for UV–VIS–NIR measurements ranging from 190 nm to 1700 nm. Based on the Czerny-Turner configuration, these spectrometers lack moving parts, which avoids optical misalignment and ensures reliable and stable long-term performance. All devices have good thermal stability and are factory-calibrated. Broadcom spectrometers are used in applications such as process control and monitoring, biomedical applications, chemical research, environmental analysis, medical and pharma applications, forensic analysis, and more.
Qwave Series: this series is fitted with a high-resolution 3648-pixel linear CCD detector featuring optimal resolution down to 0.2 nm, a focal length of 75 mm, a high dynamic range of up to 1500:1, and spectral coverage ranging from 220 to 1030 nm covered by three wavelengths configurations. The Qwave series can cope with most setups, while maintaining a relatively small size of 89.5 × 68 × 19.5 mm. This series is intended for more critical spectral analysis, where the high resolution and throughput of the spectrometer are required. AFBR-S20W2VI is a good example from this series.
Qmini Series: The Qmini Series covers a wide spectral range, starting at 220 nm up to 1100 nm. Its compact size (64 x 42 × 14.5 mm) allows it to be easily integrated into space-constrained applications, making it an appropriate solution for mobile analysis. Onboard processing capabilities save the processing cycles of the host controller, making it possible to use them in IoT setups or similar MCU or MPU-driven applications. Despite their size, these spectrometers deliver a variety of functionalities and connectivity options common to all Q-series spectrometers. AFBR-S20M2VI and AFBR-S20M2WU are some examples from the Qmini series.
Qneo Series: The Qneo series is a pocket-sized NIR spectrometer designed for sensitive measurements between 950 and 1700 nm. The compact form factor of 60 x 40 x 19 mm provides versatility in integrating the spectral sensor in a process analyzing system (PAT) or handheld device for point-of-care diagnostics (POC). The thermal stability of the electro-optical system is important to spectrometer performance over the full temperature range -15°C to +55°C (5°F to 131°F). This series features a spectral resolution of 8 nm [FWHM], integrated electronics with full system calibration, and serial interfaces (USB, SPI, and UART). In addition, they are equipped with an uncooled 256-pixel InGaAs array in an ultra-compact design. AFBR-S20N1N256 is an example of this series.
- 4.3 Application Software
All Q-series spectrometers can be used with Broadcom’s complimentary Waves Spectrometer software, which simplifies data acquisition and spectra evaluation. This software features:
Capture and display series of spectra
Automatic exposure control with dark spectrum interpolation
Ability to import and export ASCII based files
Comprehensive tools for displaying and analyzing spectra
Strip charts for comparing characteristic values between multiple spectra, including peak follower in real-time
Transmission, absorption, and reflection measurements
The Waves Software is a useful tool for evaluation. For OEM integration, a software development kit (SDK) with several device commands is online to start the implementation.

Figure 6: Waves Main Interface Window
5. Analysis
Optical spectrometers are used for material analysis in a wide variety of fields in engineering and science. We will now analyze some specific optical spectrometer use case applications.
Spectral Analysis of Water with the Qmini UV Spectrometer
Dissolved nitrate in water is difficult to detect without testing, as it is odorless, tasteless, and colorless. Nitrate-nitrogen contaminated drinking water causes harm when the nitrate changes into nitrite within the digestive system. Nitrite causes the iron component of the RBC hemoglobin to oxidize, forming methemoglobin. The latter cannot carry oxygen like hemoglobin and creates a condition termed methemoglobinemia (aka "blue baby syndrome"), where oxygen absence in the individual body cells causes the skin and veins to appear blue. A lab water test for nitrate is essential for families with infants, nursing mothers, pregnant women, or the elderly.
Ultraviolet-visible (UV-Vis) spectroscopy can effectively detect contaminant quality and quantity in an aqueous environment. The Qmini UV (AFBR-S20M2UV) and Qmini WIDE UV (AFBR-S20M2WU) spectrometers can be a good fit for online detection of nitrite and nitrate content in waste and freshwater. They can also effectively measure turbidity within the VIS range. The lower UV range (< 200 nm) absorbance spectroscopy determines the nitrite/nitrate concentration. The Qmini spectrometer with adjusted starting wavelengths at approximately 189 nm enables real-time monitoring in line and at the line without taking samples.

Figure 7: Detection of nitride and nitrate content in waste and fresh water using the Qmini spectrometer
Detection of Pathogens in Food and Feed with the Qwave Spectrometer
Optical spectroscopy can also detect harmful pathogens contaminating food and feed in a processing line. Spectroscopy is very effective in the bioanalysis of samples, and can perform this analysis without destroying the sample. With absorbance spectroscopy, the Qwave AFBR-S20W2XX series spectrometer can detect the existence and concentration of labeled pathogens. The Qmini WIDE (220 -1000 nm) can also be used, due to its broad spectral range and the fact that it covers various measurement tasks with a single device in an analyzer system.

Figure 8: Detection of pathogens in food and feed using Qwave or Qmini spectrometers
Environmental Analysis with Qneo Spectrometer
The spectral analysis of environmental and geological irradiance is a spectrometer application where optical spectrometers are used to identify spectrally and physically distinctive features of different surface materials and rock types. Environmental analysis includes environmental moisture, solar radiation, and temperature. Qneo NIR (AFBR-S20N1N256) and Qmini (AFBR-S20M2XX) spectrometers are ideal for such applications, because they can measure the amplitude and wavelengths of light emitted in the near-infrared and visible range, and are easily integrated into handheld solutions. Broadcom provides the SDK that guides communication with the spectrometer using various digital interfaces, programming languages for software development, and facilitates communication with embedded microcontrollers.

Figure 9: Spectrometer in geological and environmental applications using Qmini or Qneo spectrometers
Charge Coupled Device (CCD): a light sensitive integrated circuit capable of converting light into electronic data.
Diffraction Grating: a type of monochromator that separates light into a range of individual wavelengths, using a number of parallel, closely spaced slits.
Electromagnetic (EM) Radiation: a form of energy traveling in waves at the speed of light, spanning a broad spectrum.
Infrared (IR): the range of frequencies of radiant energy or light invisible to the human eye, but able to be felt as heat. Infrared is divided into 3 spectral regions: near-infrared (750 – 1300 nm), mid-infrared (1300 – 3000 nm), and far-infrared (3000 – 1mm).
Monochromator: an optical device that separates light into a range of individual wavelengths. Examples of monochromators are prisms and diffraction grating.
Nuclear Magnetic Resonance (NMR): a phenomenon where molecules react to a magnetic field by producing an electromagnetic signal with a frequency characteristic of the magnetic field at its nucleus.
Photon Multiplier Tube (PMT): a type of vacuum tube capable of detecting light in the UV, visible, and near-infrared ranges of the electromagnetic spectrum.
Serial Peripheral Interface (SPI): a synchronous communication interface for short distance communication, typically used to send data between microcontrollers and small peripherals.
Spectrometer: an optical instrument used to measure the variation of physical characteristics over a frequency range in a given spectrum of light.
Visible (VIS): refers to the range of frequencies of light visible to the human eye. The range starts at around 380 nm (violet) and extends to approximately 750 nm (red).
Ultraviolet (UV): the range of frequencies of radiant energy or light that falls between the visible spectrum and X-rays. UV is generally divided into 3 spectral regions: UVA (315-400 nm), UVB (280-315 nm), and UVC (180-280 nm).
Universal Asynchronous Receiver/Transmitter (UART): a hardware communication protocol that provides asynchronous communication between devices.
Universal Serial Bus (USB): an industry standard for connectors and communication protocols, widely used for connecting peripherals to computers.
*Trademark. Broadcom is a trademark of Broadcom Inc. Other logos, product and/or company names may be trademarks of their respective owners.
Related ComponentsBack to Top

The element14 ESSENTIALS of Optical Spectrometers discusses different kinds of spectrometers, the basic concepts underlying the operation of optical spectrometers, and various use cases. To extend the knowledge covered in the main module, this supplementary guide discusses the types of Broadcom Q-Series spectrometers.
Spectrometers
The Qneo AFBR-S20N1N256 Near NIR spectrometer is designed for industrial integration. Equipped with an uncooled InGaAs sensor array, the Qneo enables professional measurement between 950 nm and 1700 nm. On a footprint smaller than a credit card, the Qneo features a rugged setup that combines high resistance in industrial environments and high optical performance.
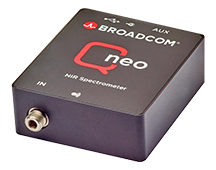
Wavelength range: 950-1700 nm
Spectral resolution (FWHM): 8nm
Dynamic Range: 12000:1
Detector: 256 pixel linear uncooled InGaAs sensor
Dimensions: 60.0 x 50.0 x 19.0 mm
This is a miniature USB spectrometer with on-board electronics and communication interfaces for UV–VIS–NIR measurements. The Qmini spectrometer offers a small design to enable tight integration to suit a large number of OEM requirements.

Six wavelength configurations from 190 nm–1100 nm
Spectral resolution from 0.3–1.5 nm
Miniature size
Powerful on-board electronics with processing and evaluation
Customizable wavelength range, sensitivity, resolution and interfaces
Application software and Software Development Kit
Dimensions: 64.0 x 42.0 x 14.5 mm
Qmini AFBR-S20M2XX is a Miniature Spectrometer with Onboard Processing for Mobile Applications and Industrial Integration. Its compact design enables tight integration in applications where space is limited, like mobile analysis devices. The Qmini includes a powerful electronics board that enables:
Full processing of spectra in the device (offset, nonlinearity, dark spectrum, and spectral sensitivity)
Averaging and smoothing
Binning and buffering of spectra
A replaceable entrance slit, reduced stray light, and lower power consumption.
Within a very small design, the Qmini delivers technical specifications that are unprecedented at this size. Its compact design enables tight integration in applications where space is limited, like mobile analysis devices. The Qmini includes a powerful electronics board that enables:
Wavelength range: 220 nm to 400 nm
Spectral Resolution: 0.3 nm
Full processing of spectra in the device (offset, nonlinearity, dark spectrum, and spectral sensitivity)
Averaging and smoothing
Binning and buffering of spectra
A replaceable entrance slit, reduced stray light, and lower power consumption.
Within a very small design, the Qmini delivers technical specifications that are unprecedented at this size. Its compact design enables tight integration in applications where space is limited, like mobile analysis devices. The Qmini includes a powerful electronics board that enables:
Wavelength range: 730 nm to 1080 nm
Spectral Resolution: 0.7 nm
Full processing of spectra in the device (offset, nonlinearity, dark spectrum, and spectral sensitivity)
Averaging and smoothing
Binning and buffering of spectra
A replaceable entrance slit, reduced stray light, and lower power consumption.
Spectrometer Accessory
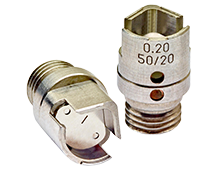
AFBR-S20SK-V2 is a Slit Evaluation Kit for Broadcom spectrometers, simplifying the spectrometer evaluation process with interchangeable slits. This kit enables the quick changing of slit sizes when evaluating the spectral performance of Qmini or Qwave in the field.
For more available products
Test Your KnowledgeBack to Top

Are you ready to demonstrate your knowledge of Optical Spectrometers? Then take a quick 10-question quiz to see how much you've learned. To earn the Tools & Test Equipment III Badge, read through the learning module, attain 100% on the Quiz, leave us some feedback in the comments section, and give the learning module a star rating.
| Tools&TestEquipment3.pdf |


Sponsored by
1. Introduction | 2. Objectives | 3.Scope | 4. Basic Concepts | 5. Analysis | Related Components | Test Your Knowledge

Top Comments
-

meera_hussien
-
Cancel
-
Vote Up
0
Vote Down
-
-
Sign in to reply
-
More
-
Cancel
Comment-

meera_hussien
-
Cancel
-
Vote Up
0
Vote Down
-
-
Sign in to reply
-
More
-
Cancel
Children