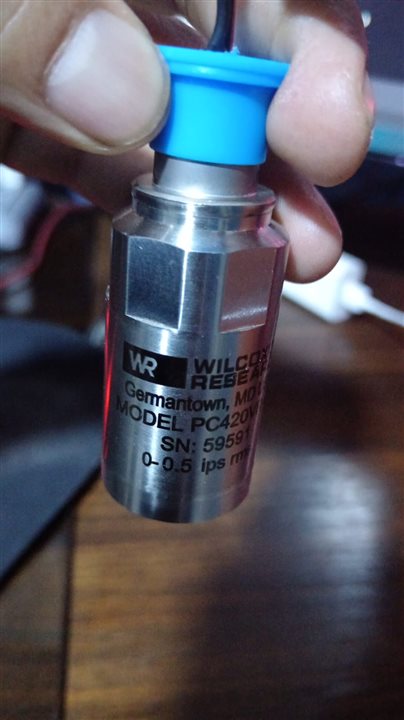
Vibration analysis is important for any industrial process, as it provides us with a lot of information about the mechanical state of the machines we use. It also allows us to use their signals as interlocks in PLC programming, etc. Therefore, one of my motivations for creating this small blog was to use a Wilcoxon sensor and adapt it to a Raspberry Pi with the idea of being able to view RMS measurements on the screen and log them in a .csv file.
Table of specifications:
| Parameter | Specification |
|---|---|
| Sensitivity | 100 mV/g |
| Measurement Range | 0 to 0.5 ips (inches per second) |
| Frequency Response | 2.5 to 15,000 Hz (±3 dB) |
| Resonance Frequency | >25 kHz |
| Transverse Sensitivity | <5% |
| Power Requirement | 18-30 VDC |
| Output Signal | 4-20 mA |
| Operating Temperature | -40 to 85 °C |
| Case Material | Stainless Steel |
| Weight | 145 grams (5.1 oz) |
| Mounting | 1/4-28 UNF |
| Connector | 2-pin MIL-C-5015 |
Pics:
Image 1;

Project Comments:
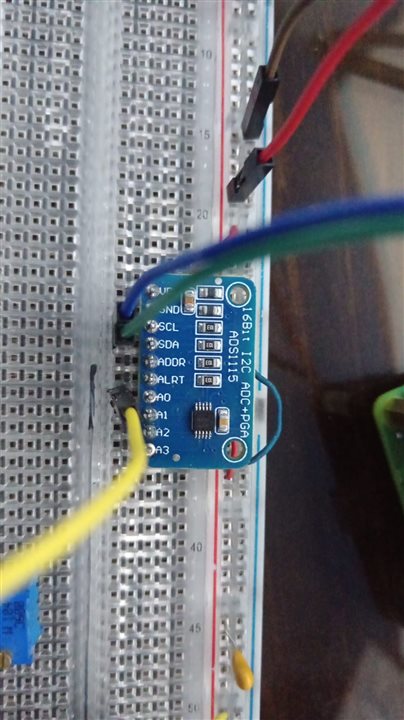
- The Raspberry Pi 5 does not have an ADC, so I had to adapt an ADS1115 (I2C), which has a 16-bit ADC. (Image 2)
- The Wilcoxon sensor operates at 12 volts and has a current output of 4 to 20mA. Its datasheet provides a diagram of how to integrate it with a PLC, and using that idea, it is possible to integrate it with the Raspberry Pi 5. (Image 3)
Image 2

Image 3

Before processing the vibration signal, calibration tests were conducted between the ADS1115 and a reliable multimeter.


Example Code to Anaconda Rsbaerry pi5:
|
import time adc = Adafruit_ADS1x15.ADS1115(address=0x48, busnum=1) root = tk.Tk() speed_label = tk.Label(root, text="Velocidad (mm/s):", font=('Helvetica', 16)) fig = Figure(figsize=(8, 6), dpi=100) canvas = FigureCanvasTkAgg(fig, master=root) speed_values = [] start_time = time.time() csv_file = open('vibration_data.csv', 'w', newline='') def calculate_rms(voltage_values): def current_to_speed(current_ma): def update_values(): update_values() |
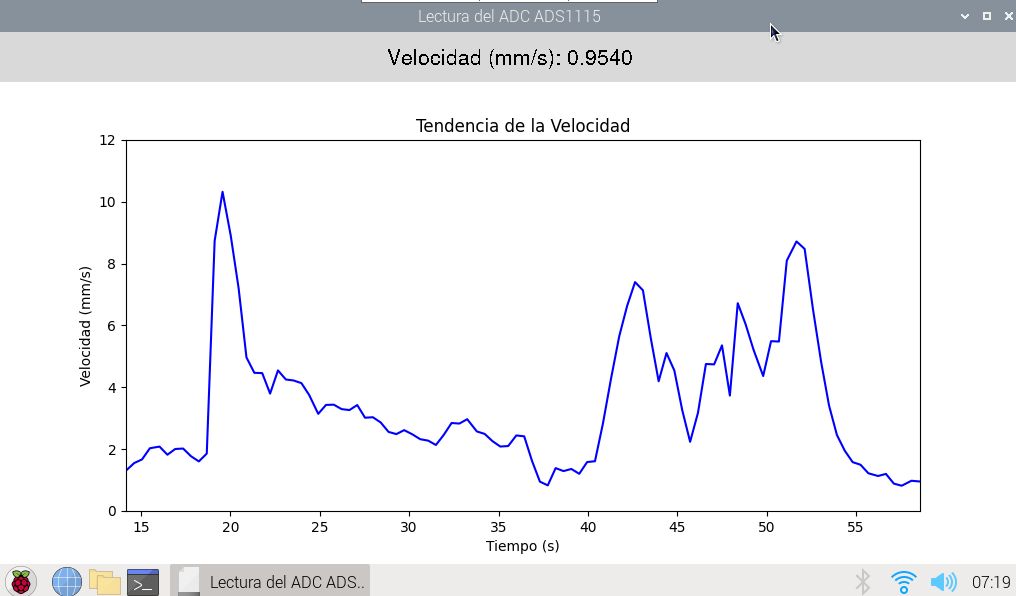
Results:
Image 2

Rasberry Pi Screen:

I hope you found this blog entertaining.
Regards
Martin


Top Comments
-

michaelkellett
-
Cancel
-
Vote Up
0
Vote Down
-
-
Sign in to reply
-
More
-
Cancel
Comment-

michaelkellett
-
Cancel
-
Vote Up
0
Vote Down
-
-
Sign in to reply
-
More
-
Cancel
Children