


A hands-on look at what it does well, where the automatic measurements can mislead you, and whether it makes sense as a first oscilloscope or portable troubleshooting tool.
The tests completed in this review is not of 100% calibrated equipment and was done on purpose. I just had fun playing around with the unit and thought I would share. Using tools that a maker would have on hand not specifically an electronics engineer. I wouldn't want to compare it to my equipment at work it would be like a dirt bike racing a jet plane.
|
Figure 1. Actual characterization bench. The FNIRSI is shown beside the Multicomp Pro reference meter with the Hanmatek scope in the background. |

The short version
The FNIRSI 2C53T is a useful portable troubleshooting instrument, but it is not a measurement reference and I would not blindly trust every automatic number it puts on the screen.
After using it as an actual tool instead of just running through the spec sheet, I ended up somewhere in the middle with it. That is not necessarily a bad thing. There are parts of the 2C53T that genuinely surprised me, especially the DC multimeter performance and how convenient it is when I just want to know whether a signal is present.
Where I lost confidence was in some of the automatic measurements. I was able to create repeatable conditions where the waveform itself was telling one story while the automatic frequency readout was telling another. In the strongest example, a known 400 Hz square wave could still look like roughly 400 Hz on the display while the automatic frequency measurement jumped to values over 22 kHz.
That does not make the scope useless. It changes how I would use it. For quick checks, portable troubleshooting, Arduino and Raspberry Pi work, audio checks, sensors, PWM, power rails and general electronics, I can see a real place for it. For engineering validation or anything where the number has to be trusted without a second opinion, I would reach for a proper bench scope.
|
Final position: I would keep it as a portable secondary instrument. I would not use it as a replacement for my Hanmatek DOS1102 bench scope. |
Review map
-
Why I tested it this way
-
Test equipment and methodology
-
Multimeter results: DC voltage
-
Multimeter results: AC voltage and frequency-dependent behavior
-
Oscilloscope results: basic waveform display and timebase behavior
-
The 400 Hz automatic frequency failure
-
Real-world amplifier testing and why I isolated the problem
-
FFT and extra functions
-
Built-in signal generator characterization
-
Usability, interface quirks and portability
-
Who this is for, especially beginners?
-
What I would trust it for and what I would not
-
Final verdict and appendix data
1. Why I tested it this way
I did not want this to turn into a review where I read the box, repeat the bandwidth number and then say the screen looks nice. If I am going to recommend a piece of test equipment, I want to know what happens when I actually use it at the bench.
My main question was not whether the FNIRSI could draw a waveform. Almost any modern digital scope can do that under friendly conditions. I wanted to know when I could trust it, when I needed to slow down and verify something, and whether a new person in electronics could reasonably learn on it without being sent in the wrong direction by the instrument itself.
That meant comparing it with instruments I already know, moving through normal electronics and audio frequencies, deliberately changing timebase and waveform type, and following up whenever something looked wrong instead of immediately blaming the FNIRSI or the signal source.
When I first got the 2C53T, I was hoping it would become the reliable portable instrument I could use at home, at work and when I was away from either bench. A three-in-one scope, multimeter and signal generator always sounds a little sketchy because every extra function creates another place for compromises to appear. FNIRSI has been making this kind of instrument for a while though, so I wanted to see whether the idea had matured into something I could actually depend on.
That was really the reason for this test program. If I am working away from my home lab, the attraction of carrying one compact instrument instead of several separate tools is obvious. Putting all three sections through their paces showed me a mixture of genuinely good results and some things that still make me hesitate.
2. Test equipment and methodology
The main gear used during the characterization was:
-
FNIRSI 2C53T portable oscilloscope / multimeter under test.
-
Hanmatek DOS1102, 110 MHz / 1 GSa/s bench oscilloscope as the primary waveform reference at home.
-
Multicomp Pro MP730026 True-RMS multimeter as the main meter reference in the home bench comparisons.
-
Fluke 117 True-RMS multimeter for additional workbench checks.
-
FG-100 DDS function generator for controlled sine and square-wave tests.
-
tinySA spectrum analyzer / RF signal source, using its LOW output for controlled high-frequency test points from 1 MHz through 50 MHz.
-
Kanto YU6 powered speaker system and resistive dummy loads for a real-world audio-amplifier test.
I treated this as practical bench characterization, not calibration-lab certification. The goal was repeatability and useful comparison. When a result looked questionable, I changed one variable at a time and checked it against another instrument before drawing a conclusion.
2.1 How I separated source behavior from meter behavior
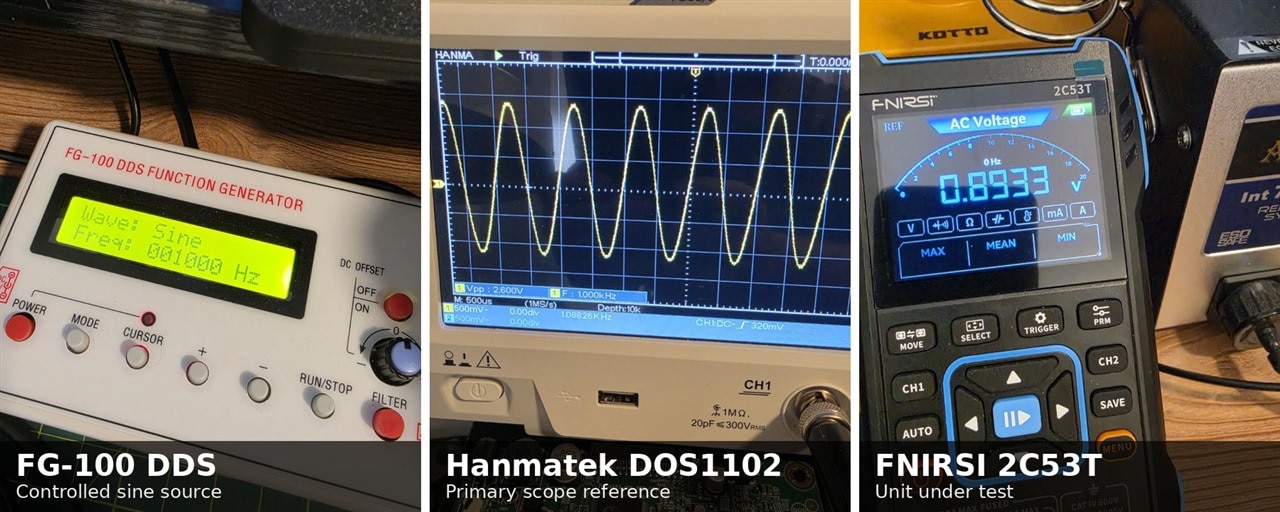
The biggest change I made as the testing progressed was to stop treating every handheld reading as the reference. For the AC-frequency sweep, the Hanmatek scope became the source-amplitude check. The generator was held on a sine wave while the scope continued to show about 2.60 to 2.62 Vpp from 1 kHz through 4 kHz. That let me separate a falling handheld AC reading from an actual collapse of the generator output.
For a sine wave I used Vrms = Vpp / (2 x sqrt(2)) to convert the scope-observed peak-to-peak value into a useful RMS comparison. A 2.600 Vpp sine corresponds to about 0.919 V RMS, and 2.620 Vpp corresponds to about 0.926 V RMS. These are derived comparison values, not separately calibrated RMS measurements from the scope.
For the later RF endpoint checks I switched to the tinySA LOW output because the FG-100 could not cover the full oscilloscope bandwidth. I used the tinySA as the high-frequency source and the Hanmatek DOS1102 as the independent reference at each fixed test frequency. That arrangement let me confirm that the 2C53T could acquire and identify signals through 50 MHz, while also showing why the amplitude data should not be treated as a calibrated -3 dB bandwidth measurement without a properly controlled 50-ohm fixture.
|
Instrument |
Role in this review |
What I used it to establish |
|
FG-100 DDS |
Controlled source |
Waveform type and commanded frequency |
|
Hanmatek DOS1102 |
Primary waveform reference |
Signal present, waveform shape, Vpp, approximate frequency |
|
Multicomp Pro MP730026 |
Comparison DMM |
Independent DC and AC readings |
|
FNIRSI 2C53T |
Device under test |
Scope behavior, automatic measurements, DMM behavior |
|
Kanto YU6 + dummy load |
Real-world stress case |
Whether odd behavior seen on a more complex amplifier output could be reproduced on a clean source |
|
tinySA |
High-frequency RF source |
Fixed RF test points from 1 MHz to 50 MHz for the dual-channel endpoint checks |
Confidence grading used in this review: DC agreement, the 2859/2860 Hz AC-mode boundary, and the direct 400 Hz false-frequency captures are high-confidence observations because they were repeated or independently cross-checked. The long-timebase 100 Hz behavior is useful but more dependent on sampling and display settings. The YU6 output captures are context only and are not used by themselves to claim an instrument fault.
|
Figure 2. Core test instruments used for the repeatable source, reference waveform and FNIRSI checks. |
3. Multimeter results: DC voltage
The multimeter section was one of the better surprises. Across the DC checks I ran, the FNIRSI stayed very close to the Multicomp Pro reference meter.
The exact value from the bench supply is less important here than the agreement between the two meters. The FNIRSI was not wandering around or showing the sort of large offset that would make me avoid it for everyday low-voltage electronics work.
|
Nominal test point |
Multicomp Pro |
FNIRSI 2C53T |
Observed difference |
|
~1 V |
0.998 V |
1.0002 V |
~+2.2 mV |
|
~2 V |
1.997 V |
2.001 V |
~+4 mV |
|
~5 V |
4.996 V |
5.003 V |
~+7 mV |
|
~10 V |
9.999 V |
10.009 V |
~+10 mV |
|
~15 V |
14.99 V |
15.015 V |
~+25 mV |
|
~20 V |
19.98 V |
19.98 V |
essentially matched |
|
~25 V |
24.98 V |
24.98 V |
essentially matched |
|
~30 V |
29.98 V |
29.97 V |
~10 mV low |
Values above are transcribed from the characterization photos and rounded for readability. This is a comparison table, not a calibration certificate.
3.1 Derived DC agreement
|
Reference (V) |
FNIRSI (V) |
Signed error (mV) |
Absolute error (mV) |
Difference (%) |
|
0.998 |
1.0002 |
+2.2 |
2.2 |
+0.220% |
|
1.997 |
2.001 |
+4.0 |
4.0 |
+0.200% |
|
4.996 |
5.003 |
+7.0 |
7.0 |
+0.140% |
|
9.999 |
10.009 |
+10.0 |
10.0 |
+0.100% |
|
14.99 |
15.015 |
+25.0 |
25.0 |
+0.167% |
|
19.98 |
19.98 |
+0.0 |
0.0 |
+0.000% |
|
24.98 |
24.98 |
+0.0 |
0.0 |
+0.000% |
|
29.98 |
29.97 |
-10.0 |
10.0 |
-0.033% |
Across these eight captured points, the mean absolute difference was 7.3 mV and the largest observed difference was 25.0 mV. The mean absolute percentage difference was 0.108%, with the largest percentage difference 0.220% near the 1 V point. I call these agreement statistics rather than accuracy specifications because neither handheld meter was used as a traceable calibration standard.

Data Chart 1. Signed FNIRSI DC error relative to the Multicomp Pro readings. The scale is in millivolts so the small differences are visible.
|
My take on DC: For normal electronics troubleshooting, I would be comfortable using the 2C53T DC-voltage function. The DC meter performance was better than I expected from an inexpensive all-in-one instrument. |
|
Figure 3. Representative DC-voltage comparisons. The 2C53T tracked the reference meter closely across the tested range. |

4. Multimeter results: AC voltage and frequency-dependent behavior
The AC side is where the story becomes more complicated. At low audio frequencies the FNIRSI gave sensible readings and was close to the reference meter. Around 1 kHz, for example, I recorded roughly 1.00 V on the Multicomp Pro and about 0.995 V on the FNIRSI.
As I increased frequency, the indicated AC voltage on both handheld meters began to change even though the Hanmatek continued to show the generator waveform present. That is an important point. The falling meter reading does not automatically mean the generator stopped producing the waveform. It tells us that the AC measurement chain and its frequency response have become part of the test.
The FNIRSI also has another behavior layered on top of that. Once the indicated AC level dropped to about 0.8 V during this sweep, the unit began falling back into its automatic mode instead of continuing to hold the AC-voltage display. I narrowed that handover down with a short one-hertz-at-a-time check rather than repeating the whole sweep. In this setup the transition was around 2.86 kHz, with the FNIRSI showing roughly 0.800 V AC right at the edge before the next small frequency step pushed it back to AUTO.
I am not treating 2.86 kHz or 0.800 V as a hidden specification. It is simply the repeatable boundary I observed with this generator level, this waveform and this particular unit. The useful finding is the behavior itself: the AC-voltage mode has a practical frequency/level limit, and when that limit is reached the instrument can leave the measurement mode rather than just continue with a lower-confidence number.
|
Generator |
Hanmatek Vpp |
Scope-derived RMS |
Multicomp AC |
FNIRSI AC / state |
Technical note |
|
1.0 kHz |
2.600 Vpp |
0.919 V |
0.890 V |
0.8933 V |
|
|
2.0 kHz |
2.600 Vpp |
0.919 V |
0.880 V |
0.8656 V |
|
|
2.500 kHz |
2.620 Vpp |
0.926 V |
0.755 V |
0.8340 V |
|
|
2.750 kHz |
2.620 Vpp |
0.926 V |
0.705 V |
0.8114 V |
|
|
2.800 kHz |
2.600 Vpp |
0.919 V |
0.694 V |
0.8255 V |
|
|
2.859 kHz |
2.600 Vpp |
0.919 V |
0.681 V |
0.8001 V |
Last stable AC point in 1 Hz boundary test |
|
2.860 kHz |
2.600 Vpp |
0.919 V |
not captured |
AUTO |
First AUTO point in 1 Hz boundary test |
|
2.875 kHz |
2.600 Vpp |
0.919 V |
0.680 V |
AUTO |
|
|
2.900 kHz |
2.600 Vpp |
0.919 V |
0.671 V |
AUTO |
|
|
3.0 kHz |
2.600 Vpp |
0.919 V |
0.645 V |
AUTO |
|
|
4.0 kHz |
2.620 Vpp |
0.926 V |
0.3786 V |
AUTO |
4.1 What the final sweep shows
This final sweep is stronger than the earlier spot checks because the source amplitude was watched on the Hanmatek while frequency was changed. The scope remained at about 2.60 to 2.62 Vpp, so the large fall in handheld AC readings was not caused by the sine wave disappearing. The Multicomp also rolls off, which is a useful reminder that a True-RMS label does not automatically mean flat response at every frequency.

Data Chart 2. Final sine sweep. The scope-derived RMS line stays essentially flat while both handheld AC readings become frequency dependent. The FNIRSI stops returning an AC-voltage value at the 2860 Hz step.

Data Chart 3. Same sweep expressed as percentage of the RMS value derived from the scope Vpp. This makes the frequency-dependent response easier to compare across instruments.
At 1 kHz, the final-sweep FNIRSI reading was about 97.2% of the scope-derived RMS value. At 2 kHz it was about 94.2%. At 2.5 to 2.859 kHz it was roughly 87 to 90%, then the unit changed to AUTO between 2859 and 2860 Hz. The 1 Hz step size only tells me where the transition occurred in this setup; it does not turn that point into a guaranteed product specification.
The Multicomp data also became strongly frequency dependent: approximately 96.8% of the scope-derived value at 1 kHz, 70.2% at 3 kHz, and 40.9% at 4 kHz. I included this because it prevents the wrong conclusion that every disagreement above 2 kHz belongs to the FNIRSI alone.
|
Important limitation: I would describe the roughly 0.8 V / 2.86 kHz point as an observed transition in this setup, not as a published threshold specification. It was repeatable enough to document, but waveform, level, source impedance and unit-to-unit variation could move it. |
|
Figure 4A. Final AC-voltage boundary check. The bench scope still shows the source; the Multicomp is around 0.68 V AC; the FNIRSI is around 0.800 V at the edge and then falls back to AUTO. |

5. Oscilloscope results: basic waveform display and timebase behavior
For basic waveform viewing, the FNIRSI is more useful than the worst results in this review might make it sound. At sensible timebase settings it displayed low-frequency sine waves cleanly and the measured amplitude and frequency were often close to the reference scope.
A good example was the early 100 Hz testing. At useful timebases, the FNIRSI reported values around 98 to 101 Hz and roughly 1.00 Vpp while the Hanmatek was showing essentially the same signal. For the sort of job where I want to know whether an oscillator is alive and roughly where it should be, that is useful.
The problems started when I deliberately moved into timebase settings that were poor for the signal. At very long timebases the display became dense or aliased and the automatic frequency measurement could jump to values in the hundreds of hertz even though the generator was still around 100 Hz.
5.1 Why the 100 Hz long-timebase test matters
A 100 Hz waveform has a 10 ms period. On a typical ten-division screen, the timebase determines how many cycles must be compressed into the display. This is a useful way to separate a bad circuit from a bad viewing setup.
|
Timebase |
Approx. screen span |
100 Hz cycles across 10 div |
Observed usefulness |
|
2 ms/div |
20 ms |
2 cycles |
Useful, close look at waveform |
|
5 ms/div |
50 ms |
5 cycles |
Useful |
|
10 ms/div |
100 ms |
10 cycles |
Useful |
|
20 ms/div |
200 ms |
20 cycles |
Still interpretable |
|
50 ms/div |
500 ms |
50 cycles |
Dense; automatic reading can become unreliable |
|
100 ms/div |
1 s |
100 cycles |
Very dense / decimated view |
|
200 ms/div |
2 s |
200 cycles |
Aliasing risk becomes obvious |
|
500 ms/div |
5 s |
500 cycles |
Severe compression; misleading automatic results observed |
The important distinction is that I do not treat the long-timebase 100 Hz errors as the same failure as the 400 Hz test. At 50 to 500 ms/div, sampling, decimation and display compression are all legitimate contributors. The 400 Hz failure is more serious because it occurred with a timebase that clearly showed the correct fundamental period.
That is not unique to inexpensive scopes. Sampling and display choices matter on any digital oscilloscope. What I did not like was that the automatic measurement could continue presenting a confident-looking number even when the display should have been telling the user to question it.
|
Figure 4. The same low-frequency source viewed with a useful timebase and then a long timebase. The waveform becomes dense and the automatic frequency result becomes misleading. |

|
Lesson for beginners: Do not treat AUTO as a substitute for understanding time/div. If the screen shows a waveform that does not make sense, change the timebase before assuming the circuit is broken. |
6. The 400 Hz automatic frequency failure
This was the strongest negative result in the entire test program.
I set the FG-100 to a 400 Hz square wave and used a 500 microsecond-per-division timebase on the FNIRSI. A 400 Hz signal has a period of 2.5 ms, so at 500 microseconds per division one complete cycle should take about five horizontal divisions. That is exactly what the waveform on the FNIRSI looked like.
In other words, the acquisition and the picture on the screen were still giving me enough information to recognize the fundamental frequency. The automatic frequency number, however, was not always following the waveform.
During repeated captures I saw correct 400 Hz readings, then erroneous readings around 1.05 to 1.07 kHz, and in the most dramatic sequence the automatic measurement jumped to approximately 22.19 kHz, 22.32 kHz and 22.46 kHz while the displayed waveform still visually matched the 400 Hz source.
That is not a small accuracy error. A reading of 395 Hz on a 400 Hz source would be an accuracy discussion. A display that shows a roughly 400 Hz waveform while the automatic counter says 22 kHz is a reliability problem in the automatic measurement under those conditions.
6.1 Quantifying the automatic-frequency error
|
Capture |
Displayed frequency |
Error vs 400 Hz |
Error factor |
Percent error |
|
Correct capture |
400 Hz |
+0 Hz |
1.000x |
+0.0% |
|
Bad capture A |
1.05 kHz |
+650 Hz |
2.625x |
+162.5% |
|
Bad capture B |
1.07 kHz |
+670 Hz |
2.675x |
+167.5% |
|
High false A |
22.19 kHz |
+21,790 Hz |
55.475x |
+5,447.5% |
|
High false B |
22.32 kHz |
+21,920 Hz |
55.800x |
+5,480.0% |
|
High false C |
22.46 kHz |
+22,060 Hz |
56.150x |
+5,515.0% |

Data Chart 4. The incorrect 22 kHz captures were about 55 to 56 times the actual 400 Hz source frequency.
The three high false readings were not scattered randomly across the display range. They averaged 22.323 kHz, spanned only 270 Hz, and had a coefficient of variation of about 0.49%. My interpretation is that the automatic counter may have been repeatedly locking onto the same higher-frequency edge content or another repeatable feature of the square wave. That is a hypothesis, not proof of the internal algorithm. The important measured fact is that the displayed waveform period still matched the 400 Hz fundamental while the automatic number did not.
Sanity check from the graticule: 400 Hz has a period of 2.5 ms. At 500 us/div, one cycle should occupy 2.5 ms / 0.5 ms = 5 divisions. That is what the waveform showed. This is why I consider this a measurement-algorithm reliability issue rather than a simple source-frequency error.
|
Source |
FG-100 DDS |
|
Waveform |
Square |
|
Generator setting |
400 Hz |
|
FNIRSI timebase |
500 us/div |
|
Approx. FNIRSI amplitude |
400 mVpp |
|
Correct automatic examples |
~400 Hz |
|
Erroneous automatic examples |
~1.05-1.07 kHz; 22.19 kHz; 22.32 kHz; 22.46 kHz |
|
Figure 5. The 400 Hz square-wave test under conditions where both instruments report the source correctly. In the same direct-generator test series, the FNIRSI automatic counter was also captured at grossly incorrect values up to about 22 kHz while the waveform period still indicated the 400 Hz fundamental. |

How I would word the finding: The automatic frequency measurement is unreliable under at least some waveform, amplitude and timebase conditions. The scope can still display a waveform whose period is visibly consistent with the correct fundamental while the numeric frequency result locks onto something else.
7. Real-world amplifier testing and why I isolated the problem
One useful part of this project was that the strange behavior did not first appear in a clean laboratory test. I was using the FNIRSI on the output of a Kanto YU6 powered speaker while feeding the speaker from the FG-100. At some timebase settings the FNIRSI showed dense comb-like or pulse-like waveforms and automatic frequency values far above the audio tone I was feeding into the speaker.
That would have been an easy place to say the handheld scope was broken, but the YU6 output is a much more complicated test point than the output of a function generator. A modern powered speaker can use a class-D, bridge-tied output where high-frequency switching content is present along with the audio. That switching can confuse an automatic measurement and it also changes the grounding rules for bench equipment.
So I did not use the YU6 result as proof of a FNIRSI defect. I went back to the direct generator test and reproduced a much cleaner automatic-frequency failure there. That direct 400 Hz test is the one I consider review evidence.
7.1 Measurement caution on powered-speaker outputs
This part is worth spelling out for anyone trying to reproduce the test. A powered speaker output may be bridged or class-D, so the black speaker terminal cannot automatically be treated as earth or chassis ground. A battery-powered handheld scope can be useful on a floating output, but its probe ground and BNC shell are still common inside the instrument. Connecting an earth-grounded bench-scope ground clip to the wrong side of a bridged output can create a short circuit.
For that reason I treated the YU6 work as a real-world observation, measured across the load, and then moved back to a direct generator connection for the claim that matters. That evidence chain is stronger: complex amplifier output produced strange readings, clean generator test reproduced an automatic-frequency failure, and the direct test removed the amplifier topology as the main explanation.
|
Test-method note: The amplifier test was useful because it showed how easily an automatic measurement can be confused in a real circuit. The direct-generator retest was important because it separated instrument behavior from amplifier switching behavior. |
|
Figure 6. Real-world audio-amplifier test hardware: resistive dummy load and the Kanto YU6 passive-speaker output test point. I verified the 6ohm speakers through the output before passing a signal through the active speaker to the dummy load on the passive side. dummy load was only 4ohms I was being lazy and not adding the other 2ohms. |

8. FFT and extra functions
The FFT function technically works, but it was one of the least convincing parts of the 2C53T for me. The presentation is limited, the markers and readout are not as clear as I would like, and I did not find it comfortable enough that I would buy the instrument specifically for FFT work.
For a quick look at whether a fundamental and some harmonic content exist, it can still be interesting. I would treat it as a bonus diagnostic view, not as a substitute for a spectrum analyzer and not as a feature I would base the purchase decision on.
8.1 Temperature function: useful, but not a precision thermometer
I also checked the temperature input because it is listed as one of the multimeter functions and it is exactly the kind of extra feature a new electronics hobbyist may actually use. I used the supplied thermocouple in two simple scenarios: room temperature and a warm-contact check. I compared the result with the Multicomp Pro temperature input and with the room thermostat / analog room thermometer where useful.
|
Scenario |
FNIRSI 2C53T |
Reference / comparison |
Observed difference |
|
Room / bench |
~20 °C |
~23 °C |
about 3 °C low |
|
Warm-contact check |
~30 °C |
~34 °C |
about 4 °C low |
These were practical checks, not a calibrated environmental-chamber test. The contact method, probe placement and time allowed to stabilize all affect the result. I would therefore treat the temperature function as a useful electronics diagnostic input for things such as heatsinks, enclosures and relative temperature changes, not as a precision thermometer. The important result for this review is that the function works, but the simple checks showed a noticeable low bias compared with the reference readings.

Figure. Temperature-function spot checks. The face photos from the original warm-probe experiment are intentionally not used in the review draft.
9. Built-in signal generator characterization
The built-in signal generator ended up being one of the stronger parts of the 2C53T. I tested it independently with the Hanmatek DOS1102 rather than looping the generator back into the FNIRSI and asking the instrument to grade itself. The box specifies a 1 Hz to 50 kHz generator range and 0.1 to 3.0 V amplitude setting, so those were the limits I tried to verify.
9.1 Frequency range and accuracy
|
Programmed |
Hanmatek result |
Approx. error |
Result |
|
1 Hz |
period visually consistent with ~1 Hz |
reference auto-counter not used |
Pass |
|
2 Hz |
2.00009 Hz |
+45 ppm |
Pass |
|
4 Hz |
4.00019 Hz |
+47.5 ppm |
Pass |
|
5 Hz |
5.00023 Hz |
+46 ppm |
Pass |
|
10 Hz |
10.0005 Hz |
+50 ppm |
Pass |
|
1 kHz |
1.00005 kHz |
+50 ppm |
Pass |
|
10 kHz |
10.0005 kHz |
+50 ppm |
Pass |
|
50 kHz |
~50.00 kHz |
within displayed resolution |
Pass |
The low-frequency reference counter itself became unreliable in scan mode at the very bottom of the range, so I did not turn the 1 Hz auto-counter number into a false precision claim. Instead I judged the waveform period from the graticule. From 2 Hz upward, the measured frequency tracked the programmed value extremely closely. The repeated roughly 45 to 50 ppm offset through several points is small enough that the generator is more than adequate for general troubleshooting and learning work.

Data Chart. Built-in generator frequency error. The 1 Hz point is excluded from the ppm plot because the bench scope auto-counter was not reliable in the slow scan condition.

Figure. Bottom and top of the advertised generator range: 1 Hz and 50 kHz.
9.2 Amplitude setting vs measured output
|
Generator setting |
Hanmatek measured Vpp |
Difference |
Percent high |
|
0.1 V |
0.126 V |
+0.026 V |
+26.0% |
|
0.5 V |
0.528 V |
+0.028 V |
+5.6% |
|
1.0 V |
1.008 V |
+0.008 V |
+0.8% |
|
2.0 V |
2.120 V |
+0.120 V |
+6.0% |
|
3.0 V |
3.120 V |
+0.120 V |
+4.0% |
Amplitude accuracy was not as impressive as frequency accuracy. The 1.0 V setting was very close in the captured test, while the 0.1 V setting showed the largest percentage error. The upper settings were consistently a little high. For ordinary circuit stimulation this is still useful, but I would verify the actual output with a scope or meter whenever the exact stimulus amplitude matters.

Data Chart. Programmed generator amplitude compared with the Hanmatek Vpp measurement. The dashed line represents a perfect 1:1 result.

Figure. Example amplitude checks captured at 1 kHz.
9.3 Waveform set
I also stepped through the available waveform shapes. The useful part here is not just that the menu contains several names, but that the outputs were visibly distinct on the independent scope. I confirmed sine, square, half-wave, full-wave, step and reverse-step outputs, along with the variable-symmetry ramp / sawtooth mode.

Figure. Representative built-in generator waveforms observed on the Hanmatek reference scope.
9.4 The sawtooth duty-cycle control is really a symmetry control
The sawtooth mode deserves extra explanation because the user interface calls the adjustable parameter duty cycle. At 50% the output becomes essentially a symmetrical triangle. Moving the setting away from 50% changes the relative rise and fall times, progressively turning the triangle into a rising or falling ramp. Moving to the opposite side of 50% reverses the direction. In practice this is more flexible than a fixed sawtooth output, although the menu wording does not make that behavior obvious.

Figure. Sawtooth / ramp symmetry behavior. Around 50% the output is triangle-like; moving the control to either side changes the slope relationship and ramp direction.
9.5 Generator verdict
This is one feature I would count as a real advantage of the 2C53T rather than a box-checking extra. The generator reached the advertised 1 Hz and 50 kHz endpoints in my testing, frequency accuracy was very good over the measured points, and the waveform selection is genuinely useful. The amplitude setting is not something I would treat as a calibrated voltage reference, but for learning, injecting a signal into a circuit, checking an audio path or creating a quick clock / test waveform without carrying another instrument, it adds real value.
10. Usability, interface quirks and portability
Portability is probably the strongest reason I still want to keep the 2C53T. The unit has enough weight that it does not feel like a toy, and the supplied case turned out to be more useful than I expected. There is enough room to keep the instrument together with a few adapters, connectors and short cables, which makes it much easier to grab the whole kit and go.
The BNC connectors are necessarily close together because of the small enclosure. In normal use that is fine, but when I tried using the T-cable arrangement to feed both channels I found the connectors a few millimetres closer than I would have liked and had to work around the physical clearance. That is a minor consequence of the form factor rather than a major fault.
The display itself was one of the better parts of the physical design. My bench lighting is bright enough to create reflections in photographs, but when I was actually looking at the screen those reflections were much less distracting than the camera made them appear. Even with two channels and measurements on screen the display remained usable, although everything naturally becomes tighter as more information is added.
The interface is where the experience becomes less polished. During testing I repeatedly found myself hunting for a setting, looking for a button that was not where I expected it to be, or working through menus to find a function that should have been more direct. Once I learned the layout I could fumble through it without much trouble, but the path to some settings feels like more work than it should be.
One of the clearest examples is FFT. I do not expect a handheld combination instrument to replace a spectrum analyzer, but the FFT presentation feels dated. The overlay is cramped, the controls are limited and it does not feel like a properly developed analysis mode. More than ten years ago I might have accepted that presentation more easily. Today I would expect FFT to have its own dedicated page with sensible frequency-span, scaling and measurement controls.
10.1 Does the three-in-one idea still make sense?
After living with it, I am less convinced that combining everything into one box is automatically better for me. I would rather carry several portable instruments that I trust than one three-in-one instrument that makes me question a result. My Multicomp meter already does the meter work very well, my inexpensive function generator and tinySA cover the signal-source jobs I normally need, and if I were spending money next I would probably look for another good portable scope rather than another combination instrument.
That does not mean the three-in-one concept has no value. For somebody starting with very little equipment, or for someone who values minimum bag space above everything else, having all three functions available is genuinely convenient. For my own lab, however, more features also mean more places for problems to appear, and I already own dedicated instruments that I trust.
10.2 Work use versus home-lab use
I did not have enough time at work to treat the 2C53T as my everyday instrument there, but the exercise helped clarify where it fits for me. At my workbench I already have a Fluke meter and an older HP function generator that still works perfectly for the fixed frequencies I normally use. What I am missing there is a scope.
Because of that, I would rather put money toward another dedicated scope similar to my DOS1102 for the workbench than replace instruments that are already doing their jobs. The FNIRSI remains most interesting when I need to leave the bench and want a compact battery-powered scope in my hand.
11. Who is this for, especially beginners?
This is the part of the review where I think the answer has to be more nuanced than yes or no.
Good fit
-
Hobbyists and makers who want a portable scope and meter in one unit.
-
Arduino, Raspberry Pi and microcontroller projects where the question is often whether a signal or PWM output is present.
-
Basic audio troubleshooting and low-voltage electronics.
-
Students who are actively learning how time/div, volts/div, period and frequency relate to one another.
-
Technicians who already have a bench scope and want a compact second instrument for quick checks.
Not the right tool
-
Engineering validation where measurements have to be defensible without a second instrument.
-
Precision frequency work.
-
High-speed digital signal-integrity work.
-
Serious FFT or spectrum analysis.
-
Situations where a wrong automatic result could cause an expensive or safety-critical decision.
Would I recommend it to a new person in electronics?
Yes, but I would teach the person to verify it rather than teaching them to trust every displayed number.
A beginner can learn a lot with this instrument because they can immediately see what voltage looks like instead of only reading a number. A 555 timer, Arduino PWM output, audio signal or sensor pulse becomes something visible. That is valuable.
The contradiction is that a beginner is also the person least likely to notice when the instrument is wrong. When my 400 Hz source suddenly produced a 22 kHz automatic measurement, I knew to stop and check the period, generator and reference scope. A brand-new user might assume the circuit is wrong and start debugging a problem that does not exist.
So I would still consider giving the 2C53T to somebody learning electronics, but I would teach them how to build their own references. Compare it with another meter when possible, use known voltages and components, and calculate the percentage difference when something appears slightly high or low. That is useful measurement practice, but it is also extra work that ideally should not be required just to have confidence in the instrument.
|
One sentence for a beginner: Use the automatic measurements as helpers, not as the final authority. |
12. What I would trust it for and what I would not
I am still on the fence about completely trusting the 2C53T after all of this testing. That may sound harsh after collecting so many good results, but trust in test equipment is not just about how many points pass. Once I have seen an instrument produce a number that clearly disagrees with the waveform in front of me, I naturally become more cautious about accepting later automatic measurements without a second look.
I would trust it for portable signal-presence checks, low-voltage DC work, looking at ordinary waveforms, comparing channels, checking whether a clock or PWM signal is present, and many normal hobby or service tasks where I can sanity-check the result. I would also use the built-in generator when I simply need a convenient source and its available range is appropriate.
I would be more cautious when an automatic measurement is the only evidence I have, when FFT or spectrum information matters, or when the decision depends on precision without an independent reference. The slow continuity response is usable now that I know about it, but it is noticeably slower than my Multicomp meter. Likewise, a secondary feature only has value if it works well enough that I do not immediately reach for another tool.
The later high-frequency testing did restore some confidence. Both channels continued to acquire and identify a signal all the way to the advertised 50 MHz endpoint in my test setup. That showed there is real capability here. It did not erase the earlier automatic-frequency failures, so my final position is not that the scope is untrustworthy. It is that I trust it best when I understand what it is doing and know when a result deserves verification.
|
Task |
My confidence |
Comment |
|
Basic DC voltage checks |
High |
Tracked the reference meter closely in the bench tests. |
|
Continuity / basic DMM troubleshooting |
Good |
Appropriate use for a portable electronics meter. |
|
Is there a waveform here? |
Good |
One of the strongest reasons to own it. |
|
Approximate low-frequency sine measurement |
Good with sensible setup |
Worked well when timebase and signal conditions were appropriate. |
|
Automatic frequency measurement |
Caution |
Can be dramatically wrong under some tested conditions. |
|
Long-timebase automatic measurement |
Caution |
Aliasing / sampling choices can produce misleading results. |
|
AC voltage at rising audio frequency |
Caution |
Frequency response and AUTO transition became significant in our test. |
|
FFT / spectrum work |
Low |
Useful as a bonus view, not a serious analyzer. |
|
Engineering reference measurements |
Low |
Use a proper bench instrument and verify. |
13. Final verdict
After putting the FNIRSI 2C53T through far more testing than I originally planned, I am still somewhere in the middle with it. There are parts of it that are genuinely impressive, and there are other parts that keep me from giving it the level of trust I would want from my main test equipment.
The physical package is good. It feels substantial in the hand, the screen is easy to use in normal viewing, the case is genuinely useful, and the battery endurance during this review was better than I expected. The DC meter results were strong, capacitance and other basic functions were useful, the built-in generator performed better than I expected in several tests, and both oscilloscope channels continued to acquire and identify the signal at 50 MHz.
The problem is that capability and trust are not the same thing. The 400 Hz automatic-frequency failures, awkward FFT implementation, slow continuity response and sometimes unnecessarily difficult menu navigation all chipped away at my confidence. None of those alone makes the instrument bad. Together they make me think twice before treating it as the one instrument I depend on.
I paid C$144.69 including tax for this unit. At the exchange rates used while finishing the review on August 16, 2026, that was roughly US$104 or GBP77. At that price the 2C53T is no longer so inexpensive that I automatically overlook the compromises. Knowing what I know now, I would spend more time comparing other portable scopes around the same price and somewhat above it before buying again.
Would I keep it? Portability is the strongest argument for doing so. For my home lab I already own separate meters, generators and a bench scope that I trust more, so the 2C53T does not replace them. Away from the lab, however, having a battery-powered scope, meter and generator in one small case remains genuinely useful.
Would I recommend it to a beginner? Yes, with guidance. I would teach them to check a measurement against a known reference, understand volts/div and time/div, calculate frequency from period, and compare against another meter when something seems wrong. That is good electronics practice anyway, although it is more work than I would ideally want a new user to need.
Would I buy it again without shopping around first? No. I would definitely look at the alternatives in this price range and a little higher. Build quality is good and having a long feature list is attractive, but a feature only adds value if it works well enough that I can rely on it.
My final position is therefore more cautious than a simple pass or fail: the FNIRSI 2C53T is a capable and very portable three-in-one instrument with excellent real-world endurance and more oscilloscope performance than its size suggests, but I would not choose it as my primary bench instrument. For me, it earns a place mainly because it is convenient to carry, not because it replaces the dedicated tools I already trust.
|
Bottom line: Keep it for portability and quick troubleshooting. Keep the bench scope for measurements that need to be trusted. |
Pros and cons at a glance
|
What I liked |
What I did not like |
|
• Good DC-voltage agreement in my testing |
• Automatic frequency can be spectacularly wrong |
|
• Portable, battery-powered scope + meter |
• AUTO behavior can get in the way |
|
• Useful for quick waveform presence checks |
• AC measurement becomes less useful as frequency rises in the tested setup |
|
• Good value as a secondary / field instrument |
• FFT is limited |
|
• Can be a useful teaching tool when the user understands the basics |
• Interface takes some learning |
|
• Not a replacement for a proper bench scope |
|
Figure 7. My final use case for the 2C53T: a compact portable companion, not a replacement for a trusted bench oscilloscope. |

14. Additional completed checks
Before calling the test program finished, I went back through the functions that are easy to leave as unchecked boxes on a spec sheet. These checks did not change the main verdict, but they closed several gaps in the earlier draft and made the coverage more representative of the instrument as a whole.
14.1 Resistance, capacitance, continuity and diode
Resistance was checked with the resistance box rather than just a single loose resistor. The useful result is that the FNIRSI tracked the comparison meter closely once the test moved out of the very-low-ohms region, where two-wire lead, clip and contact resistance become a meaningful part of the measurement.
|
Approx. point |
Comparison meter |
FNIRSI 2C53T |
Difference / note |
|
~50 Ω |
50.0 Ω |
48.58 Ω |
-2.84%; low-ohm setup sensitive to lead/contact resistance |
|
~100 Ω |
114.8 Ω |
116.55 Ω |
+1.52% |
|
~1 kΩ |
996 Ω |
999.0 Ω |
+0.30% |
|
~9.1 kΩ |
9.09 kΩ |
9.103 kΩ |
+0.14% |
|
~10 kΩ |
~9.95 kΩ |
9.952 kΩ |
essentially matched in the captured check |
The resistance box itself topped out at 9,999 Ω, so this was a practical low/kΩ-range comparison rather than a sweep of every advertised resistance range.
|
Nominal capacitor |
Comparison meter |
FNIRSI 2C53T |
Approx. difference |
|
100 nF |
112.4 nF |
113.3 nF |
+0.8% |
|
1 µF |
1.105 µF |
1.096 µF |
-0.8% |
|
10 µF |
9.23 µF |
9.182 µF |
-0.5% |
|
1000 µF |
1010 µF |
989.8 µF |
about -2.0% |
Continuity and diode modes were also exercised during the DMM pass. I am treating those as functional checks rather than accuracy tests because the working photo log does not preserve a clean numeric comparison worth publishing as a precision claim.
14.2 Dual-channel operation and secondary scope functions
Both channels were then run together from the same source. At 1 kHz the channels tracked one another closely in frequency and displayed amplitude. I also exercised the math menu, trigger modes, X-Y display and persistence instead of leaving those as untested menu items.
|
Function |
Observed result |
|
Dual channel |
Both channels acquired the same source together and tracked one another closely. |
|
X-Y |
With same-frequency in-phase inputs, X-Y produced the expected diagonal line rather than a time-domain waveform. |
|
Trigger |
Auto, Normal and Single modes were exercised; Single captured and stopped as expected. |
|
Persistence |
OFF, 500 ms, 1 s and infinite persistence options were present and persistence behavior was checked during repeated runs. |
|
Math |
Channel addition/subtraction and the other available math selections produced distinct calculated traces; subtracting closely matched channels collapsed toward zero as expected. |
|
Cursor / measurements |
The measurement menu exposes frequency, period, duty, Vpp, amplitude, Vmax, Vmin, Vrms and average; cursor controls were exercised as a practical interface check. |
14.3 Save, image viewer and USB file sharing
The save workflow turned out to be less obvious than I expected. A quick press of SAVE stores the current waveform image. A long press does not open a USB menu; it opens the Image Viewer. To copy the BMP file to a computer I had to reboot the 2C53T, enter the main settings screen, enable USB Sharing there, and then connect it to the PC. Once that was done the saved 1.bmp file opened normally in Windows.
That is a useful feature, but it is exactly the kind of workflow I would document for a new user because the front-panel SAVE button alone does not make the PC-transfer path obvious.
14.4 High-frequency endpoint test: what 50 MHz does and does not prove
For the high-frequency check I used the tinySA low output as the RF source and used the Hanmatek DOS1102 as the independent frequency reference. This let me step beyond the FG-100 limit and exercise the FNIRSI at 1, 5, 10, 20, 30, 40 and 50 MHz. The 2C53T continued to acquire both channels and its automatic frequency readout followed the source through the advertised 50 MHz endpoint.
I am deliberately not calling this a calibrated 50 MHz bandwidth verification. The tinySA output, the 50-ohm environment, adapters, tees/splits and cable losses were not held to a calibrated flat amplitude reference across the sweep. The source amplitude seen on the Hanmatek changed with frequency and setup, so using those Vpp values to calculate a -3 dB point would manufacture precision the setup does not support. What this test does establish is that this particular 2C53T could visibly acquire and correctly identify a 50 MHz sine-wave signal under the tested conditions.
I also tried using the tinySA sweep function as a quick visual stress test. The 2C53T followed the changing RF signal, but the continuously moving frequency made the trace and automatic measurements too unstable to use as a clean bandwidth plot. For the publishable data I therefore returned to fixed-frequency points at 1, 5, 10, 20, 30, 40 and 50 MHz.

Figure 8. tinySA LOW-output sweep/source setup used during the high-frequency portion of the characterization. The tinySA extended the test source well beyond the FG-100 range and made it possible to step the 2C53T through the advertised 50 MHz endpoint.
|
Reference frequency |
FNIRSI displayed frequency |
Observation |
|
1 MHz |
1.00 MHz |
Clean acquisition; both channels active |
|
5 MHz |
5.00 MHz |
Both channels acquired |
|
10 MHz |
10.00 MHz |
Both channels acquired |
|
20 MHz |
20.00 MHz |
Both channels acquired |
|
30 MHz |
30.00 MHz |
Both channels acquired |
|
40 MHz |
~39.99 to 40.00 MHz |
Both channels acquired |
|
50 MHz |
~49.99 to 50.00 MHz |
Advertised endpoint acquired on both channels |

Figure 8A. Hanmatek DOS1102 reference at 50 MHz during the RF endpoint test.

Figure 8B. FNIRSI 2C53T acquiring the same 50 MHz test point on both channels. The endpoint is demonstrated, but this is not a calibrated bandwidth-flatness measurement.
14.5 What is actually still missing?
After reconciling the earlier test log with the later feature checks, the list is much shorter than it looked. The main ordinary function that still lacks a controlled numeric comparison is current measurement. I also have not independently verified the 250 MS/s sampling-rate claim, the 1 kpt storage-depth claim, the exact 1 MΩ input impedance, or the high-voltage/CAT ratings. Those last items require a different class of test and are not necessary for the practical low-voltage review I am writing.
I would not add more testing just to chase every printed specification. The current review already has strong positive data, repeatable negative findings, real-world context, secondary-function coverage and a high-frequency endpoint check. The remaining unverified headline specifications should simply be identified as manufacturer claims rather than silently treated as measured facts.
Appendix A: Condensed engineering test log
This section preserves the main raw and derived observations behind the review so the conclusions can be checked against the recorded bench data. It is intentionally more technical than the main narrative.
|
Test |
Setup |
Observation |
Conclusion |
|
DC voltage comparison |
~1 to ~30 V DC |
FNIRSI generally tracked Multicomp Pro very closely, usually within a few mV to a few tens of mV in the captured points. |
Strong positive result. |
|
100 Hz sine, sensible timebase |
FG-100 ~100 Hz |
FNIRSI typically ~98-101 Hz and ~1.00 Vpp. Hanmatek around ~99-102 Hz depending generator setting. |
Basic low-frequency operation looked good. |
|
100 Hz sine, long timebase |
50-500 ms/div region |
FNIRSI waveform became dense / aliased and automatic frequency could report roughly 184-244 Hz while source remained ~100 Hz. |
Auto measurement not trustworthy under poor sampling/display conditions. |
|
400 Hz direct square wave |
500 us/div, ~400 mVpp |
Waveform period visibly consistent with 400 Hz. Automatic frequency sometimes correct, sometimes ~1.05-1.07 kHz and sometimes ~22.19-22.46 kHz. |
Strongest automatic-frequency failure evidence. |
|
YU6 amplifier output |
Audio tone into powered speaker / dummy load |
FNIRSI sometimes displayed comb / pulse-like switching content and high automatic frequencies. |
Not used alone as a defect claim because class-D / BTL output can contain switching energy. |
|
AC voltage vs frequency |
~1 kHz upward; final boundary check near ~2.86 kHz |
Low-frequency AC readings were sensible. As frequency rose, the handheld readings changed while the Hanmatek still showed the source waveform. In the final repeat the FNIRSI was near 0.800 V AC at the boundary, then fell back to AUTO on the next small step. |
Documented operating limitation / behavior, not treated as a universal specification. |
|
FFT |
Various sine tests |
Function available but limited presentation and practical usefulness. |
Bonus feature rather than a purchase reason. |
|
Interface / display |
General use |
Timebase control and mode changes required some learning; AUTO can be intrusive; at least one UI indicator behavior was confusing. |
Usable after learning, but not completely intuitive. |
Appendix A1: Raw and derived DC comparison
|
Nominal |
Multicomp Pro |
FNIRSI |
Signed error |
Error % |
|
1 V |
0.998 V |
1.0002 V |
+2.2 mV |
+0.220% |
|
2 V |
1.997 V |
2.001 V |
+4.0 mV |
+0.200% |
|
5 V |
4.996 V |
5.003 V |
+7.0 mV |
+0.140% |
|
10 V |
9.999 V |
10.009 V |
+10.0 mV |
+0.100% |
|
15 V |
14.99 V |
15.015 V |
+25.0 mV |
+0.167% |
|
20 V |
19.98 V |
19.98 V |
+0.0 mV |
+0.000% |
|
25 V |
24.98 V |
24.98 V |
+0.0 mV |
+0.000% |
|
30 V |
29.98 V |
29.97 V |
-10.0 mV |
-0.033% |
Appendix A2: Final controlled AC sweep
|
Freq |
Scope Vpp |
Derived RMS |
Multicomp |
FNIRSI |
FNIRSI state |
|
1000 Hz |
2.600 Vpp |
0.919 V |
0.890 V |
0.8933 V |
AC |
|
2000 Hz |
2.600 Vpp |
0.919 V |
0.880 V |
0.8656 V |
AC |
|
2500 Hz |
2.620 Vpp |
0.926 V |
0.755 V |
0.8340 V |
AC |
|
2750 Hz |
2.620 Vpp |
0.926 V |
0.705 V |
0.8114 V |
AC |
|
2800 Hz |
2.600 Vpp |
0.919 V |
0.694 V |
0.8255 V |
AC |
|
2859 Hz |
2.600 Vpp |
0.919 V |
0.681 V |
0.8001 V |
AC |
|
2860 Hz |
2.600 Vpp |
0.919 V |
n/c |
n/c |
AUTO |
|
2875 Hz |
2.600 Vpp |
0.919 V |
0.680 V |
n/c |
AUTO |
|
2900 Hz |
2.600 Vpp |
0.919 V |
0.671 V |
n/c |
AUTO |
|
3000 Hz |
2.600 Vpp |
0.919 V |
0.645 V |
n/c |
AUTO |
|
4000 Hz |
2.620 Vpp |
0.926 V |
0.3786 V |
n/c |
AUTO |
Appendix A3: 400 Hz automatic-frequency captures
|
Actual |
Displayed |
Multiplier |
Absolute error |
Interpretation |
|
400 Hz |
400 Hz |
1.000x |
+0 Hz |
Correct capture |
|
400 Hz |
1050 Hz |
2.625x |
+650 Hz |
Bad capture A |
|
400 Hz |
1070 Hz |
2.675x |
+670 Hz |
Bad capture B |
|
400 Hz |
22190 Hz |
55.475x |
+21,790 Hz |
High false A |
|
400 Hz |
22320 Hz |
55.800x |
+21,920 Hz |
High false B |
|
400 Hz |
22460 Hz |
56.150x |
+22,060 Hz |
High false C |
Data handling note: all values in these appendices are transcribed from the photos and test notes available from the characterization sessions. Derived values are calculated from those displayed readings. No uncertainty budget or traceable calibration chain was established, so the numbers are appropriate for a technical product review and comparative characterization, not formal instrument certification.
Appendix A4: Built-in generator data
|
Set frequency (Hz) |
Measured frequency (Hz) |
Error (ppm) |
|
2 |
2.00009 |
45.0 |
|
4 |
4.00019 |
47.5 |
|
5 |
5.00023 |
46.0 |
|
10 |
10.0005 |
50.0 |
|
1000 |
1000.05 |
50.0 |
|
10000 |
10000.5 |
50.0 |
|
50000 |
50000 |
0.0 |
|
Amplitude setting (V) |
Measured Vpp (V) |
Difference (V) |
|
0.1 |
0.126 |
+0.026 |
|
0.5 |
0.528 |
+0.028 |
|
1.0 |
1.008 |
+0.008 |
|
2.0 |
2.120 |
+0.120 |
|
3.0 |
3.120 |
+0.120 |
Appendix A5: Temperature spot checks
|
Scenario |
FNIRSI (°C) |
Reference (°C) |
FNIRSI minus reference |
|
Room / bench |
20 |
23 |
-3 °C |
|
Warm-contact |
30 |
34 |
-4 °C |
Appendix B: Test coverage and limits
What this review covers. The goal was practical characterization, not certification of every line on the specification sheet. The strongest conclusions are based on tests that were repeated or independently cross-checked with reference instruments.
|
Feature |
Coverage |
Review status / conclusion |
|
DC voltage |
Characterized |
Strong agreement with the reference multimeter across the tested low-voltage range. |
|
AC voltage |
Characterized in a controlled sweep |
Useful at lower frequencies in the tested setup; behavior changed near the observed ~0.8 V AC / ~2.86 kHz boundary. |
|
Temperature |
Spot-checked |
Function works, but simple room/warm-contact comparisons showed a noticeable low bias. Not a calibration-grade test. |
|
Oscilloscope waveform display |
Characterized |
Useful at sensible timebase settings for waveform presence, period and general shape. |
|
Automatic frequency measurement |
Characterized under failure conditions |
Known 400 Hz source produced incorrect automatic readings up to ~22 kHz while the displayed period still matched the source. |
|
Long-timebase behavior |
Characterized qualitatively |
Dense/aliased displays and misleading automatic frequency values were observed when settings were poorly matched to the signal. |
|
FFT |
Qualitative evaluation |
Works as a basic harmonic view but presentation and measurement workflow are limited. |
|
Built-in signal generator |
Characterized |
Advertised 1 Hz to 50 kHz range reached; measured frequency tracking was very good; waveform set and amplitude behavior documented. |
|
Real-world amplifier output |
Context test |
Useful for showing how complex class-D/BTL outputs can confuse automatic measurements; not used alone to claim an instrument fault. |
|
Resistance / continuity / diode |
Characterized / functional checks completed |
Resistance was compared with the resistance box across low-ohm and kΩ points; continuity and diode modes were also functionally checked. No traceable calibration claim is made for these secondary functions. |
|
Capacitance |
Characterized at several points |
Capacitance checks included approximately 100 nF, 1 µF, 10 µF and 1000 µF. Agreement with the comparison meter was generally close in the captured tests. |
|
Current ranges |
PARTIALLY CHARACTERIZED |
Low-current DC checks around ~5 mA and ~45 mA were captured against the comparison meter. The full advertised current ranges, AC current and high-current endpoints were not characterized. |
|
Dual-channel / X-Y / trigger / persistence / math |
Functionally characterized |
Both channels were exercised together; X-Y produced the expected diagonal response with in-phase signals; Auto, Normal and Single trigger modes were exercised; persistence options were checked; and math traces responded as expected. These were practical function checks rather than precision characterization. |
|
50 MHz bandwidth / 250 MS/s / 1 kpt depth |
50 MHz endpoint exercised; formal bandwidth not certified |
A tinySA low-output RF source, cross-checked on the Hanmatek DOS1102, was used through 50 MHz. The FNIRSI displayed and identified signals at 10, 20, 30, 40 and 50 MHz on both channels. Because the source level, 50-ohm loading and split/interconnect losses were not held to a calibrated flat reference, this is an endpoint/functionality test, not a -3 dB bandwidth certification. The 250 MS/s and 1 kpt claims were not independently measured. |
|
High-voltage / CAT ratings / maximum input |
Not tested |
Deliberately outside the scope of this practical low-voltage electronics review. Safety ratings should be treated as manufacturer specifications, not validated by this test program. |
|
Save / image viewer / USB file sharing |
Functionally characterized |
A short SAVE press stores a waveform image; a long press opens the image viewer. USB file sharing was verified after rebooting to the main settings and enabling USB Sharing; the saved BMP was opened successfully on a Windows PC. |
|
Current ranges |
Still not formally characterized |
No controlled current-source comparison has been added to this review. This remains the main ordinary DMM function not characterized with numeric comparison data. |
-
Product identification used in this review: FNIRSI 2C53T, 50 MHz dual-channel oscilloscope / multimeter with built-in signal generator, as marked on the tested unit and packaging.
-
All numerical results are comparative characterization data from the tested unit, not a traceable calibration certificate.
-
The ~0.8 V AC transition and the automatic-frequency failures are reported only under the tested conditions and should not be read as universal limits for every unit or setup.
-
The 400 Hz automatic-frequency failure is the strongest negative result because the source and waveform period remained consistent while the numeric automatic reading became incorrect.
-
The built-in generator is one of the strongest positive results and was independently observed on the Hanmatek reference scope rather than self-tested by the FNIRSI.
Appendix D: Master verification checklist and review audit
This appendix reconciles the original test plan against the measurements, photos and observations completed during the August 2026 characterization. It is intended to prevent repeated testing and to separate three things clearly: features that were actually characterized, features that were functionally demonstrated, and specifications that were not independently certified.
|
Area |
Status |
What we actually established |
Recommendation |
|
Safety / ground topology |
PARTIAL |
Common channel-ground behavior was treated conservatively during powered tests, but a formal DMM continuity map of DMM COM, CH1/CH2 grounds, generator ground and USB shield has not yet been completed. |
Worth doing once. High value for safety documentation. |
|
DMM DC voltage |
COMPLETE |
Compared against Multicomp from about 1 V through 30 V; largest captured difference about 25 mV; very strong agreement. |
No more testing needed. |
|
DMM AC voltage |
COMPLETE FOR REVIEW |
Controlled sine sweep documented frequency-dependent response and repeatable AUTO transition around 2.859-2.860 kHz in the tested setup. |
Do not expand AC sweep further. |
|
DMM resistance |
COMPLETE FOR PRACTICAL RANGE |
Decade box used as nominal source; Multicomp used as comparison reference. Points captured from ~50 ohm through ~10 kohm. Kilohm-range agreement was very close; low-ohm results more affected by leads/contacts. |
Box maxed at 9,999 ohm, so high-megohm range not characterized. |
|
DMM continuity |
COMPLETE |
Multicomp responded almost immediately; FNIRSI required about 1.5-2 seconds before continuity indication. |
Strong usability negative; no repeat needed. |
|
DMM diode / LED |
COMPLETE AS USABILITY TEST |
Two R2007 silicon diodes gave ~0.599 V and ~0.587 V on Multicomp; red LED ~1.670 V and illuminated. No obvious usable diode mode or Vf reading was found on FNIRSI. |
Record as claimed function not practically accessible in testing, not as proof of electrical impossibility. |
|
DMM capacitance |
COMPLETE |
Same capacitors compared on both meters at ~0.1 uF, 1 uF, 10 uF, 100 uF and 1000 uF. Most points were within about 1%; 100 uF was roughly 3% different. |
Strong pass. |
|
DMM DC current |
PARTIAL |
~5 mA point: FNIRSI ~4.950 mA vs Multicomp settling ~4.91 mA. ~45 mA point: FNIRSI ~45.13 mA vs Multicomp ~43.89 mA. |
Optional final ~90 mA point was planned but not completed. |
|
DMM AC current |
NOT TESTED |
No controlled AC current test completed. |
Skip unless specifically desired; low review value. |
|
Temperature |
COMPLETE AS SPOT CHECK |
Ambient/warm-contact tests showed FNIRSI following temperature changes but a few degrees below comparison readings in informal testing. |
No calibrated bath; do not claim precision accuracy. |
|
Scope basic waveform display |
COMPLETE |
Low-frequency sine/square signals displayed correctly at sensible timebases; frequency and Vpp often close to references. |
No more basic waveform testing needed. |
|
Scope long-timebase behavior |
COMPLETE |
100 Hz and later very slow tests showed dense/aliased display behavior and unreliable automatic frequency readings at poor timebase choices. |
Important limitation already well documented. |
|
Scope automatic frequency |
COMPLETE |
400 Hz square-wave test repeatedly produced correct readings, ~1.05-1.07 kHz errors, and ~22.19-22.46 kHz false readings while waveform period remained ~400 Hz. |
Headline negative finding; no more reproduction needed. |
|
Scope channel matching |
COMPLETE |
Same signal on CH1/CH2 gave closely matched frequency and amplitude from low frequency through RF tests. |
Strong positive result. |
|
Scope absolute amplitude |
CHARACTERIZED, NOT CALIBRATED |
At some low-frequency conditions FNIRSI Vpp was higher than Hanmatek; high-frequency comparative response was non-monotonic due RF fixture/source/loading limits. |
Describe observations, avoid universal gain-error claim. |
|
Scope AC/DC coupling |
COMPLETE |
Intentional DC offset preserved in DC coupling and removed/recentered in AC coupling; waveform required manual repositioning after switching. |
Pass with usability note. |
|
Trigger modes |
COMPLETE |
AUTO, NORMAL and SINGLE demonstrated. SINGLE captured and stopped; Normal remained stably triggered. |
Pass. |
|
Trigger edge |
COMPLETE |
Rising- and falling-edge triggering demonstrated on square/sine waveforms. |
Pass. |
|
Cursor measurement |
COMPLETE |
X1-X2 manually positioned one period apart on 1 kHz signal; dX = 1.00 ms and reciprocal = 1.00 kHz. |
Pass; control method was not intuitive. |
|
Parameter measurements |
COMPLETE |
Freq, Vpp, Vrms and Duty+ checked on 1 kHz sine/square. Square duty measured ~49.93-50.00%; RMS behavior was sensible. |
Pass with known auto-frequency exceptions. |
|
Persistence |
COMPLETE |
OFF and persistence-enabled behavior photographed multiple times; previous traces visibly retained after signal changes. |
Pass; do not test again. |
|
X-Y mode |
COMPLETE |
After settings were normalized, identical in-phase channel signals produced the expected clean positive-slope diagonal line. |
Pass. Earlier fragmented display was setup/persistence related and should not be framed as a defect. |
|
Math functions |
COMPLETE |
CH1+CH2, CH1-CH2, multiply and divide demonstrated. Sum/difference behaved as expected; multiply showed doubled-frequency structure; divide showed expected spikes near zero crossings. |
Functional pass; math scaling/presentation is not elegant. |
|
FFT |
COMPLETE FOR REVIEW |
FFT operates but presentation is cramped/limited and not suitable as a serious spectrum-analysis replacement. |
No more FFT testing needed. |
|
Screenshot / save |
COMPLETE |
Quick SAVE stores BMP; long press opens Image Viewer. |
Pass. |
|
USB image export |
COMPLETE |
Required leaving normal operation/rebooting to Settings -> USB File Sharing; BMP successfully accessed on Windows. |
Functional but cumbersome workflow. |
|
Y-T / Roll / X-Y display claim |
PARTIAL |
Y-T and X-Y explicitly selectable. No dedicated Roll selection found. At slow timebases the trace behavior changed but did not present as a clean conventional chart-recorder Roll mode. |
Keep as partial/unclear; enough evidence already. |
|
Timebase endpoints |
MOSTLY DEMONSTRATED |
Very fast settings used for 50 MHz work and very slow settings used for long-timebase tests. |
No need to certify every 10 ns-20 s step. |
|
Vertical sensitivity endpoints |
NOT FORMALLY VERIFIED |
A broad range of V/div settings was used, but the full 10 mV/div to 10 V/div claim was not systematically endpoint-tested. |
Low value unless one-minute menu check desired. |
|
50 MHz acquisition |
COMPLETE AS ENDPOINT DEMONSTRATION |
tinySA Low Output and Hanmatek reference used from 1 to 50 MHz. Both FNIRSI channels continued to display and report ~50 MHz at the advertised endpoint. |
Strong positive result. |
|
Formal -3 dB analog bandwidth |
NOT VERIFIED |
RF amplitude ratios were non-monotonic because the improvised source/cabling/high-impedance fixture was not a controlled 50-ohm measurement chain. |
Do not manufacture a bandwidth number. State test limitation. |
|
250 MS/s sample-rate claim |
NOT VERIFIED |
No independent sample-rate verification performed. |
Skip; requires deeper instrumentation/reverse engineering. |
|
1 Kpts record depth |
NOT VERIFIED |
No independent memory-depth verification performed. |
Skip unless menu/file export exposes it directly. |
|
1 Mohm input impedance |
NOT VERIFIED |
Not independently measured. |
Could be checked with a resistor divider, but low review value. |
|
Maximum +/-400 V scope input |
NOT TESTED |
Intentionally not stress-tested. |
Do not test for a hobby review. |
|
High-voltage DMM ranges / CAT safety |
NOT TESTED |
No mains/high-voltage validation performed. |
Explicitly leave unverified for safety. |
|
Built-in generator frequency |
COMPLETE |
1 Hz endpoint visually checked; 2,4,5,10 Hz and 1 kHz,10 kHz,50 kHz measured against Hanmatek. 2 Hz upward showed very small frequency error. |
Strong pass. |
|
Built-in generator amplitude |
COMPLETE |
0.1,0.5,1,2,3 V settings checked at 1 kHz. Low-level 0.1 V showed largest relative error; higher settings closer. |
Characterized, not a calibrated source. |
|
Built-in generator waveforms |
COMPLETE |
Sine, square, half-wave, full-wave, step, reverse-step and variable-symmetry ramp/sawtooth behavior captured. |
Strong feature. |
|
Generator duty/symmetry behavior |
COMPLETE FOR OBSERVED MODES |
Sawtooth control acts as symmetry control: 50% triangle-like, moving either side changes ramp direction/slope. |
Document UI terminology clearly. |
|
Battery runtime / charging |
QUALITATIVELY CHARACTERIZED |
No timed rundown was performed, but repeated multi-hour use throughout the review required only two or three proactive charges and never interrupted a test session. |
Strong real-world portability result; exact runtime not claimed. |
|
USB grounding/noise behavior |
NOT CHARACTERIZED |
USB file sharing works, but effect of USB connection on scope grounding/noise was not systematically measured. |
Worth one safety/usability check if easy. |
|
Scope input noise floor |
NOT CHARACTERIZED |
No deliberate shorted-input/no-signal Vpp/RMS noise test at sensitive vertical ranges was recorded. |
Quick optional test; useful if final completeness is desired. |
|
Firmware / update experience |
PARTIAL |
Firmware version observed earlier, but update availability/process was not a major part of the characterization. |
Optional contextual note only. |

