


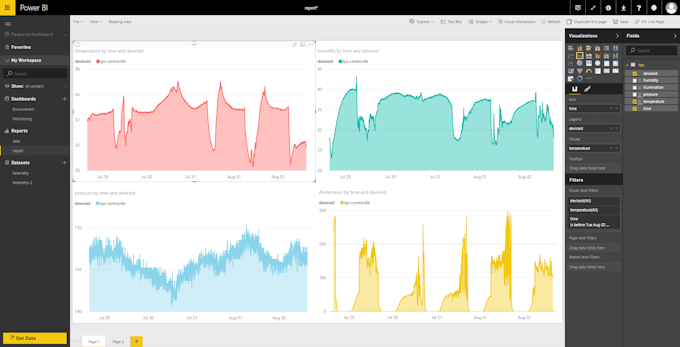
Сollect environmental data with Tibbo Project System devices, process it with Azure Stream Analytics and visualize using Power BI.
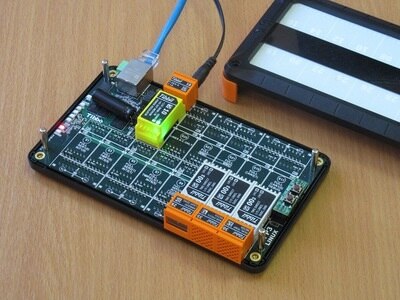
Configure and Assemble the TPS
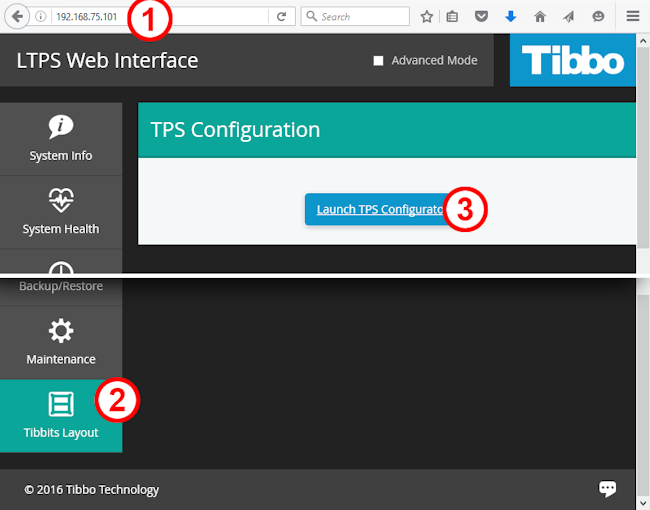
- Open LTPS Web Interface by simply entering its IP address in your browser, select the "Tibbits Layout" tab, and push the "Launch TPS Configurator..." button.
- Setup Tibbits Layout as shown on the screenshot below and click File/Save
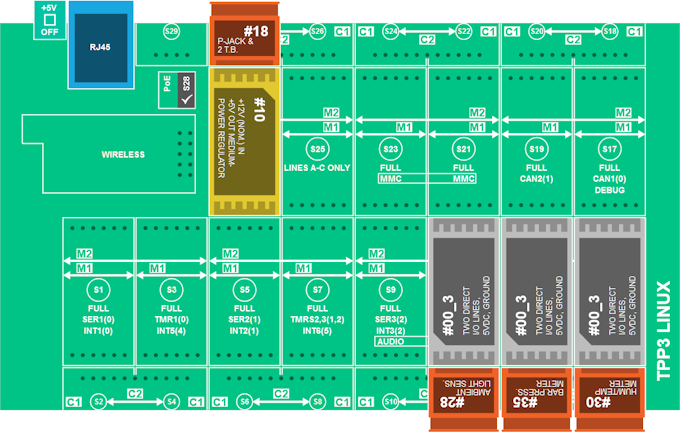
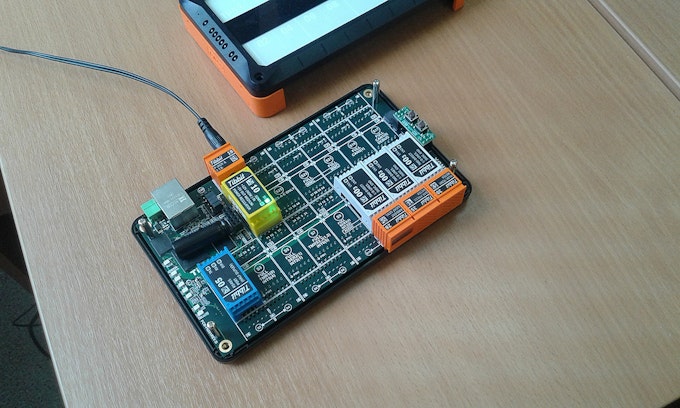
- Assemble TPS according to the Tibbits Layout
Attention: it's strongly recommended to shut down TPS before placing/removing Tibbits.
Step 1: First application
Node.js, Git and Python 2.7 are installed on each LTPS by default, but NPM is not.
- For installing, connect it to your device with SSH and do the following:
# Setup package repositories
smart channel --add 150a type=rpm-md name="LTPS all" baseurl=http://tibbo.com/downloads/LTPS/packets/all/ -y
smart channel --add 150c type=rpm-md name="LTPS cortexa" baseurl=http://tibbo.com/downloads/LTPS/packets/cortexa8hf_neon/ -y
smart update
# Install NPM
smart install nodejs-npm -y
then:
# Create folder for application
cd /opt/node-apps/
mkdir environment
cd environment
# Install required modules
npm install @tibbo-tps/tibbit-28
npm install @tibbo-tps/tibbit-30
npm install @tibbo-tps/tibbit-35
/opt/node-apps/ folder is proposed to be used for your Node.JS apps.
- In any IDE or even a text editor create azure-app-0.js file with your application:
var tibbit28 = require("@tibbo-tps/tibbit-28").init("S11");
var tibbit35 = require("@tibbo-tps/tibbit-35").init("S13");
var tibbit30 = require("@tibbo-tps/tibbit-30").init("S15");
setInterval(function(){
  var illuminationData = tibbit28.getData();
  var humidityData = tibbit30.getData();
  var pressureData = tibbit35.getData();
  var dateTime = new Date();
  console.log("Date/Time: "+dateTime);
  console.log("Illumination: "+illuminationData.illumination);
  console.log("Humidity: "+humidityData.humidity);
  console.log("Temperature: "+humidityData.temperature);
  console.log("Pressure: "+pressureData.pressure);
},1000);
- Upload it to /environment folder and run:
$ node azure-app-0.js
Date/Time: Tue Jul 19 2016 13:50:54 GMT+0000 (UTC)
Illumination: 115
Humidity: 43.755340576171875
Temperature: 28.05670928955078
Pressure: 738.7398681640625
Step 2: Setting Up Microsoft Azure IoT Hub
Microsoft Azure IoT Hub is a service that allows bi-directional communications between your devices and a solution back end. To complete this part of the tutorial you'll need:
- TPS device(s) prepared as shown on the Step 0
- An active Azure account
- A PC with installed Node.js
Create an IoT Hub
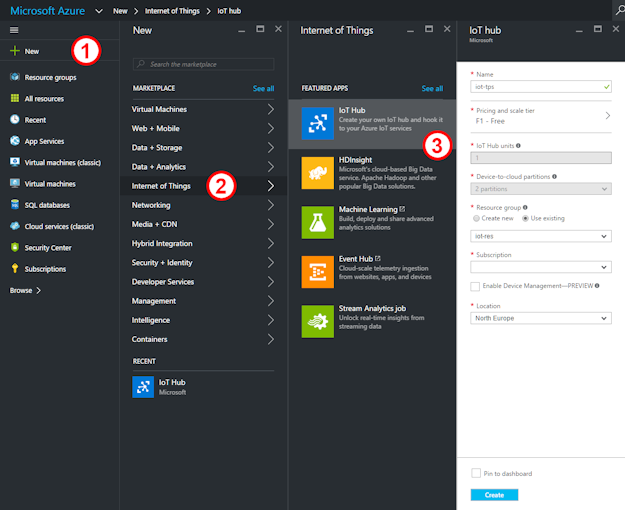
- Sign in to the Azure Portal
- Choose New > Internet of Things > Azure IoT Hub
- Configure your IoT Hub, then click "Create"
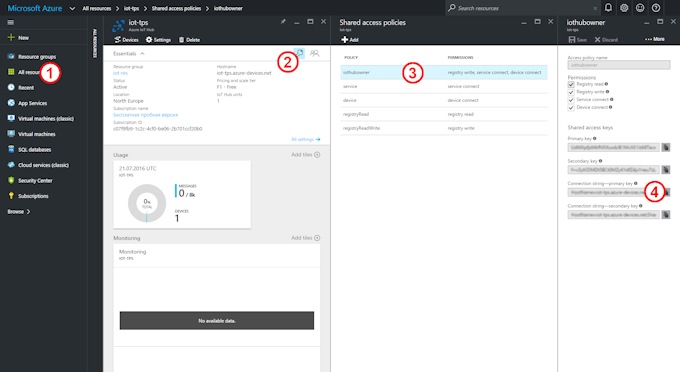
- Wait a few minutes until your IoT Hub has been created then select All Resources > [name of your IoT hub] and click "Keys" icon.
- In the Shared access policies blade select the "iothubowner" item and then copy the value of "Connection string" field.
Step 3: Registering Device Identities
- On your PC run:
npm install -g iothub-explorer@latest
- then:
$ iothub-explorer login <connection-string>
Session started, expires Thu Jul 21 2016 13:22:10 GMT+0400
where <connection-string> is an iothubowner connection string from Step 2.
- To register a new device and get its connection string:
$ iothub-explorer create <device-name> --connection-string
Created device tps-centreville
...
connectionString: HostName=iot-tps.azure-devices.net;DeviceId=tps-centreville;SharedAccessKey=fSCVQIY..TOprSsDE=
Where <device-name> is e.g. "tps-centreville".
- Make note of the connections string.
Step 4: Making devices IoT-enabled
- Connect with SSH to the TPS, change folder to /environment and do:
npm install azure-iot-device
npm install azure-iot-device-amqp
- Create azure-app-1.js file with the following app:
var clientFromConnectionString = require('azure-iot-device-amqp').clientFromConnectionString;
var Message = require('azure-iot-device').Message;
var connectionString = '<THE DEVICE CONNECTION STRING FROM STEP 3>';
var client = clientFromConnectionString(connectionString);
var tibbit28 = require("@tibbo-tps/tibbit-28").init("S11");
var tibbit35 = require("@tibbo-tps/tibbit-35").init("S13");
var tibbit30 = require("@tibbo-tps/tibbit-30").init("S15");
client.open(function(err){
if(err){
   console.log('Could not connect: ' + err);
}else{
   console.log('Client connected');
  setInterval(function(){
   var illuminationData = tibbit28.getData();
   var humidityData = tibbit30.getData();
   var pressureData = tibbit35.getData();
   var time = new Date().toISOString();
   var data = JSON.stringify({
       deviceId: 'tps-centreville',
       humidity: humidityData.humidity,
       temperature: humidityData.temperature,
       pressure: pressureData.pressure,
       illumination: illuminationData.illumination,
       time: time
  });
   var message = new Message(data);
  client.sendEvent(message, function (err) {
   if(err){
        console.log(err.toString());
   }else{
        console.log("Message sent: " + message.getData());
   }
  });
  },60000)
}
});
- Upload it to /opt/node-apps/environment folder on the TPS and run:
$ node azure-app-1.js
Client connected
Message sent: {"deviceId":"tps-centreville","humidity":37.1016960144043,"temperature":31.370407104492188,"pressure":742.8632202148438,"illumination":136,"time":"2016-07-21T10:19:07.490Z"}
Message sent: {"deviceId":"tps-centreville","humidity":37.1016960144043,"temperature":31.370407104492188,"pressure":743.2034301757812,"illumination":137,"time":"2016-07-21T10:20:10.582Z"}
Message sent: {"deviceId":"tps-centreville","humidity":37.1016960144043,"temperature":31.380477905273438,"pressure":743.2034301757812,"illumination":138,"time":"2016-07-21T10:21:12.003Z"}
Event monitoring is the most remarkable and very useful feature for the purpose of debugging iothub-explorer. With iot-explorer, you can easily observe events sent by your devices to cloud and vice versa.
Note: this command requires providing iothubowner connection string even if you're already logged in.
- On your PC do:
$ iothub-explorer <connection-string> monitor-events tps-centreville
Monitoring events from device tps-centreville
Event received:
{ deviceId: 'tps-centreville',
humidity: 37.1016960144043,
temperature: 31.380477905273438,
pressure: 743.2034301757812,
illumination: 138,
time: '2016-07-21T10:21:12.003Z' }
You can see every event as soon as it's sent to IoT hub.
Step 5: Configure Stream Analytics
Note: To complete this part of the tutorial you'll need an active Microsoft Power BI subscription.
Before the information can be delivered to Power BI, it must be processed by a Azure Stream Analytics job.
- Choose New > Internet of Things > Stream Analytics Job
- Configure the Job, then click "Create"
- Wait a couple of minutes until the Job has been created, then select All resources > name of your Stream Analytics Job
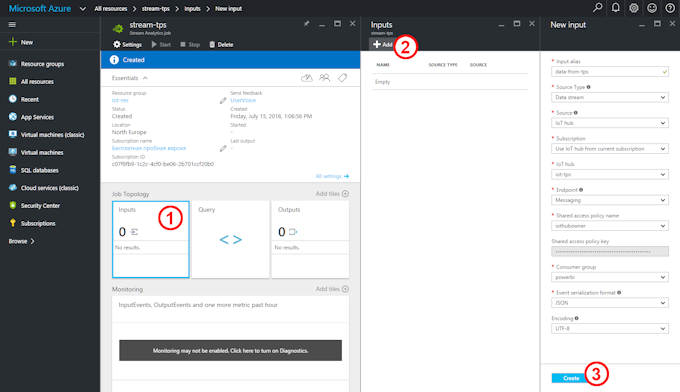
- Click Inputs > Add
Set up input in the following way:
- Input alias : data-from-tps
- Source Type : Data stream
- Source : IoT Hub
- Subsriptiopn : Use IoT hub from current subscription
- Endpoint : Messaging
- Shared access policy name : iothubowner
- Consumer group : powerbi
- Click "Create"
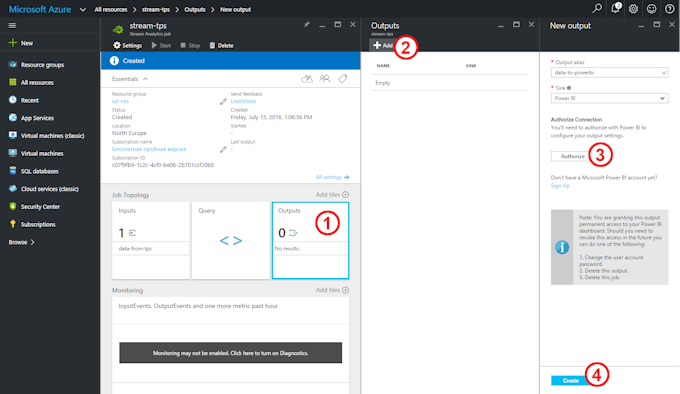
Set up output:
- Output alias : data-to-powerbi
- Click Otputs > Add
- Choose Power Bi as sink
- Click Authorize and enter your Power BI credentials in the appearing window
- Enter Dataset Name and Table Name, e.g. "telemetry" and "environment", respectively
- Click "Create"
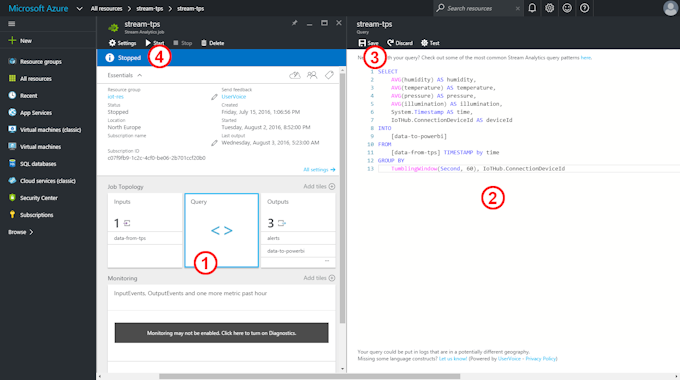
Now it's time to enter the query:
- Click Query
- Enter the following:
SELECT
AVG(humidity) AS humidity,
AVG(temperature) AS temperature,
AVG(pressure) AS pressure,
AVG(illumination) AS illumination,
System.Timestamp AS time,
IoTHub.ConnectionDeviceId AS deviceId
INTO
[data-to-powerbi]
FROM
[data-from-tps] TIMESTAMP by time
GROUP BY
TumblingWindow(Second, 60), IoTHub.ConnectionDeviceId
- Click Save
- Start your job
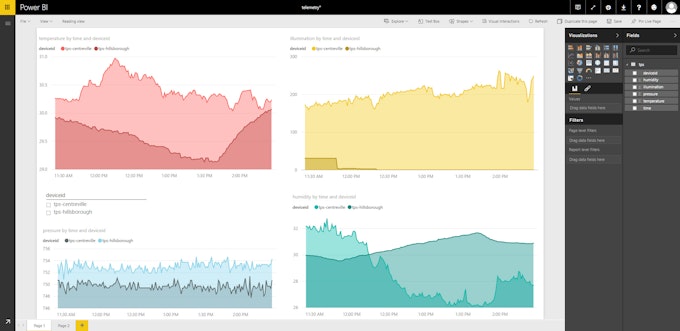
Step 7: Adding devices
- Register second device as described in Step 3.
- Upload and run code from Step 4 with modified connectionString value.
In short time the second curve appears in the report.
Made by Dmitry Slepov and Leonid Polyakov