

I did this experiment a while back, after researching thermal conduction.
The goal was to characterize TCAP-4325 thermal connector, for the OEM datasheet.
Thermal Resistance was defined as a temperature differential measured across two sections of a thermal path, divided by the energy flux through this path; Or degrees Celsius per watt.
θabs = °C/W
Thermal resistance - Wikipedia, the free encyclopedia
The thermal path is defined as the three dimensional space between a source and a sink. In this case the goal is to study the TCAP-4325 connector (in its entirety) as the thermal path.
Ideally: all the power generated by the source would flow evenly into the system through the circular plane at the connector's input.
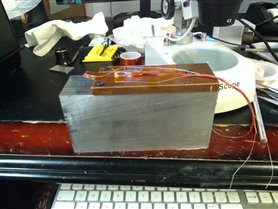
The sink should be as large as possible, with a high conductivity, and high mass. (pseudo-infinite heatsink)
By generating a known wattage at the input, and comparing its temperature to the temperature of the heat sink, the temperature differential is observed.
Tools:
Arduino Uno as data collector
KTA-259 8 channel thermocouple shield
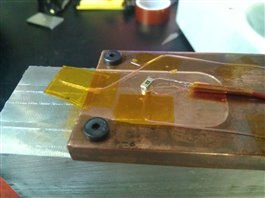
40 AWG thermocouple wire
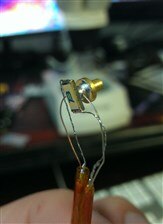
10 watt SMT resistor Bourns CHF2010CNP101RX
TCAP-4325 thermal connector
Adjustable power supply
Current meter
Constant wattage was achieved by adjusting the current to known values.
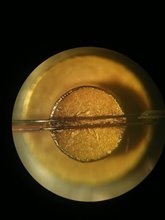
The most difficult task was getting an accurate temperature reading of the input interface.
It took a few tries, but i managed to sandwich the thermocouple wires between the resistor and PowerPeg.

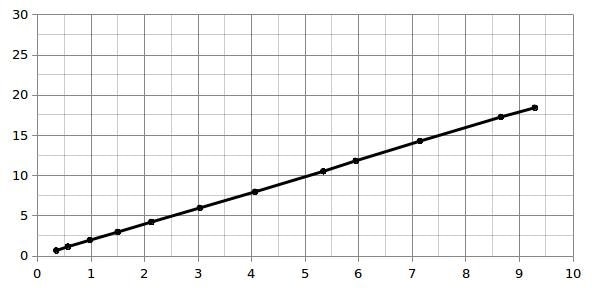
Once everything was set up I tested ten different power levels, and divided the temperature difference by input power.

The Arduino was programmed to switch on the load, and record temperatures in 5 second intervals. The graphs looked like this:
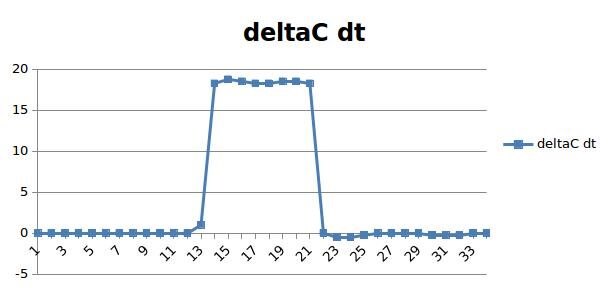
The experiment was surprisingly accurate. I know there wasn't much error, because the calculated data was extremely linear across the power distribution.
Finally it was time for some artwork, and the finished datasheet looks like this:
Top Comments