


Introduction
Well I missed the deadline as a Road Tester for EnOcean Pi and Raspberry Pi to use the contact sensor to analyze data from FHEM and calculate distance, velocity and acceleration from motion. But I still decided to continue and the following are my results ! Please double click on an image to enlarge it. I am excited about the results of this project. This has been quite the trip for me. The last year I have become interested in using technology to help animals. I have spent most of my career as an IT analyst and was fascinated by the use of drones and stop motion cameras to gather data about animals. I am very active in the animal welfare community and have 970 followers on Twitter. My interest in sensors started with this article and video about placing sensors on bees :
I thank the kind encouragement from friends and co workers. Thanks to Eric, Robbie, Chris F , Jennifer, Kate and Jackie at work, To my daughter Katie who given a preview always said "Wow Mom your project looks good" ! I also thank my best buddy Mac the dog. He comes to my work area to look for playtime or a treat or just stays on the couch for a snooze. Lots of people "rolled their eyes" when I explained the project  I may be off on some of my assumptions and calculations but then I consider myself to be an engineer citizen aka hobbyist.
My original goal was to provide the kit to The University of Prince Edward Island for the Red Urban Fox Project. The kit offers a low cost solution to tracking animals. As soon as I develop the enclosure than I will offer them the kit. The sensor is solar powered, wireless and maintenance free.
My next blog will be a more detailed test. The sensor is going on Mac the dog's collar ! This will include a video.
Hardware
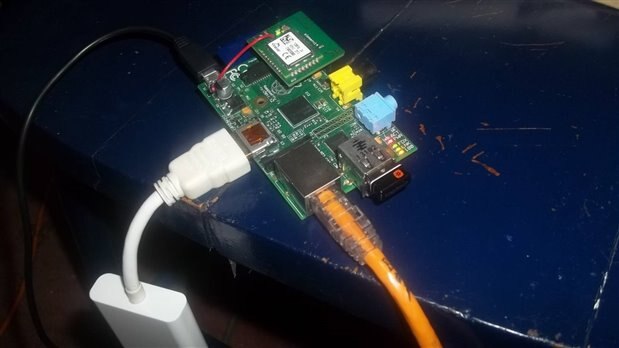
So I am using the Raspberry Pi and EnOcean Pi. I also have a Ethernet cable, a power adapter and SD card that contains the software . The initial set was using this White Paper:
White Papers for Energy Harvesting Wireless Sensor Solutions | EnOcean - Technology

Software
I used open source software for this project with the exception of a free trial version of Microsoft 365. But you can also download Open Office.
- Sqlite3
- Perl
- Linux
- Microsoft Access
- Microsoft Excel
Step 1 : Install Raspberry Pi software and FHEM software
I set up Raspberry Pi and EnOcean and have detailed the steps on other blogs:
the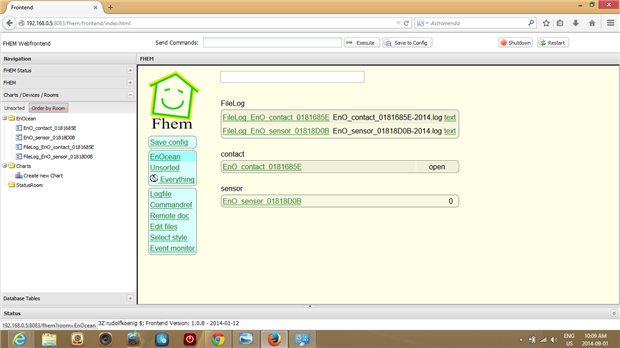
Step 2: Install FHEM Charting Front End
The steps come from this post:
http://www.fhemwiki.de/wiki/Neues_Charting_Frontend
Sudo Apt-get install sqlite3
Sudo Apt-get install libdbi-perl libdbd-sqlite3-perl
Sudo Apt-get install-f
I have SQLite installed and the perl libraries required. I now add some tables to the database:
cd /opt/fhem
sqlite3
I have change the directory to build the tables . The second command brings us to the sqlite3 prompt.
CREATE TABLE `history` (TIMESTAMP TIMESTAMP, DEVICE varchar(32), TYPE varchar(32), EVENT varchar(512), READING varchar(32), VALUE varchar(32), UNIT varchar(32));
CREATE TABLE `current` (TIMESTAMP, DEVICE varchar(32), TYPE varchar(32), EVENT varchar(512), READING varchar(32), VALUE varchar(32), UNIT varchar(32));
CREATE TABLE frontend (ID INTEGER PRIMARY KEY, TIMESTAMP DEFAULT CURRENT_TIMESTAMP, TYPE TEXT, NAME TEXT, VALUE TEXT);
Now I have three tables set up in the fhem.db. To view the tables use:
.tables
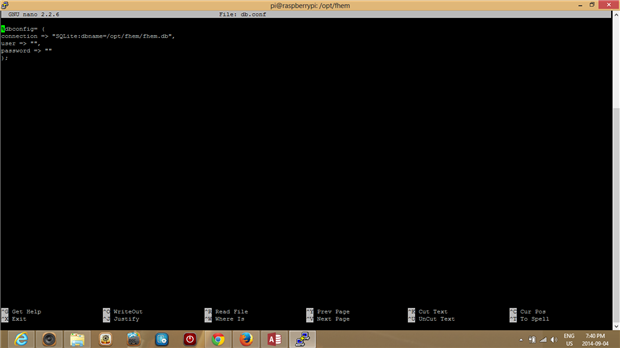
I now see history, current and frontend. While I am still in the /opt/fhem directory I need to set up code to let FHEM connect to the database:
nano db.conf
%dbconfig= (
connection => "SQLite:dbname=/opt/fhem/fhem.db",
user => "",
);
It looks like this in putty when complete:
Now in FHEM event monitor enter the following command:
define myDbLog DbLog /opt/fhem/db.conf .*:.*
I waited a few minutes for the software to install.
Step 3: Gathering Random Data
From my research the Reed Sensor is used in everyday applications such as laptops, measuring distance, when a door is open or closed. The magnet acts as an actuary and when moves towards the sensor will cause the sensor to close and when moved away will cause the state to be open. I spent some time in analyzing this data with FHEM. The raw data looks like this this in Access:
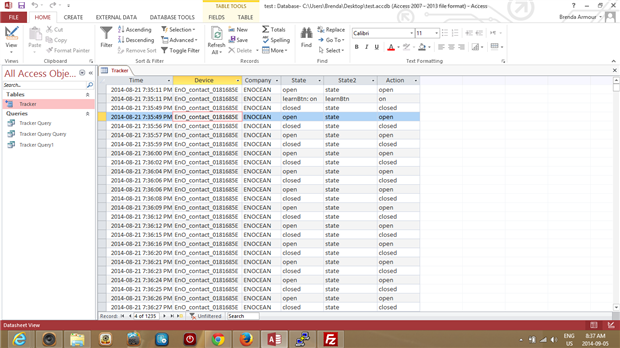
So this is the data that is automatically collected by Enocean Pi every time the sensor sends a telegram. The key data for me was the Time Stamp and the State. The challenge was to figure out how to use this data to measure distance. I found this post demonstrating the measurement of distance using a contact sensor and a magnet. Please have a look at this demo. It was the foundation of my project and encouraged me to know my objectives could be met.
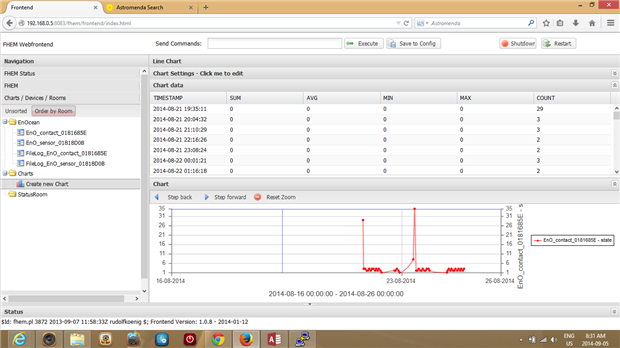
The first software I tried was the FHEM WebFrontEnd charts. I invested a considerable amount of time trying to graph some meaningful data. The best I came up with is a Hourly Count of the change in State:
At this point I decided to try Microsoft Access . This is my comfort zone as I have used Access on previous contracts. The random data is generated at this point by me move the magnet close to the sensor and then away from the sensor.
Step 4: Extracting Data from FHEM
I now have a table with the random data on the Raspberry Pi. Using Sqlite3 I was able to extract that data to a .csv file using the following steps after I have logged into Putty:
cd /opt/fhem.db
sqlite3 fhem.db
.mode csv
.output test.txt
select * from current
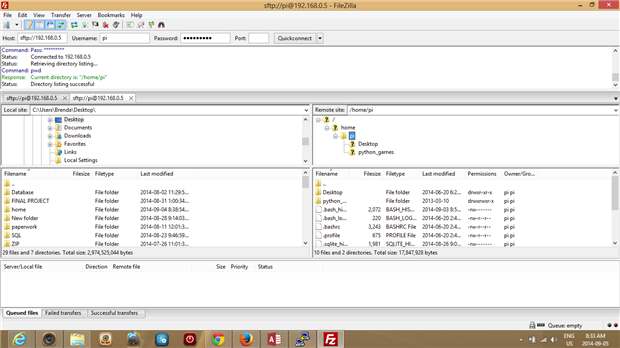
Now I have a .csv file that I can import into Access or Excel. I need to move the file from the Raspberry Pi to my Windows Desktop on my laptop. To do this I used FileZilla. This is the first time I have used this utility . After connecting the Raspberry Pi in FileZilla I simply highlighted my .csv file and downloaded the file to my desktop.
Step 5: Analyzing the data in Access
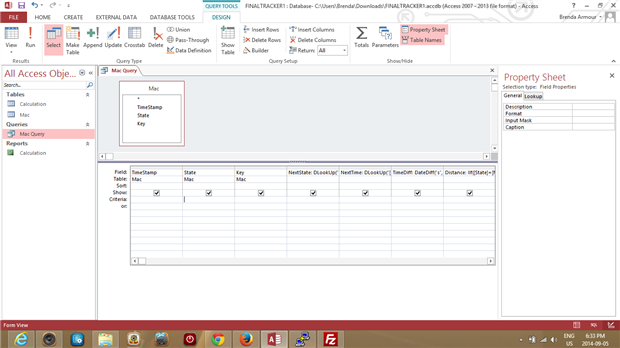
I imported the .csv file and coverted the file to a table. A Key field was added to provide a sequential auto number to each record in the table. This will be used in two expression. I created a query to extract the data I wanted to use: State and Time.. That's it ! I need to know when the STATE changes from Closed to Open or Open to Closed to detect movement. This will be explained in more detail in Step .
Fields Created
1: TimeStamp from the imported data
2, State from the imported data
3. Key an auto number
4. NextState: DLookUp("[State]","Mac","[Key]=" & [Key]+1) This expression finds the next record State and populates the result in the field
5. NextTime: DLookUp("[TimeStamp]","Mac","[Key]=" & [Key]+1) This expression find the next record TimeStamp and populates the result in the field
6. TimeDiff: DateDiff("s",[TimeStamp],[NextTime]) This expression calculates the difference in time in seconds
7. Distance: IIf([State]=[NextState],0,2.36) This expression calculates distance in meters, If the STATE has not changed than there has been no movement. If the STATE has changed than there has been movement
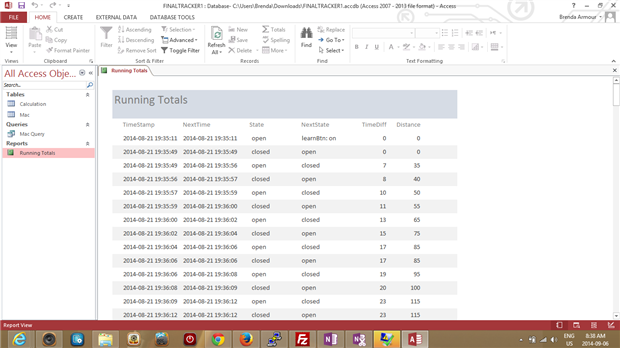
I need running total for the TimeDiff and Distance. I tried DSUM but it would not return the correct results. As a workaround I created report with with the two fields and was able to select the property for each field and select running total.
Step 6: Test the Sensor
I was given the perfect box for the magnet and sensor. Has I move the box back and forth it changes the status from open to close. This is a crude prototype but does give me an idea what the final product should look like. It will need to be waterproof. I decided to challenge Google Maps for distance and see how close I come to the measured distance. Time will be measured by a stop watch I will carry in my pocket. I assume Google Map's time is for a normal pace so the Stop Watch will measure my time for the walk. I am a woman of average height 5'6 and I will be taking two steps while moving the sensor. So I calculated 2.640 meters for each change in State (open,closed) . Below are my results:

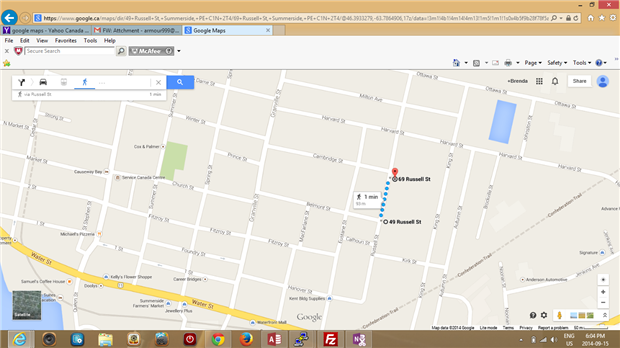
Google Maps distance: 93.00 m
Sensor Distance: 113.52 m
Margin of Error: 22%
Stop Watch Time: 6.8 mins
Sensor Time: 8.5 mins
Margin of Error: 25%
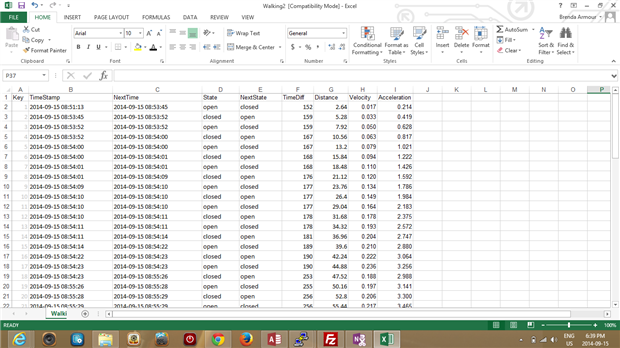
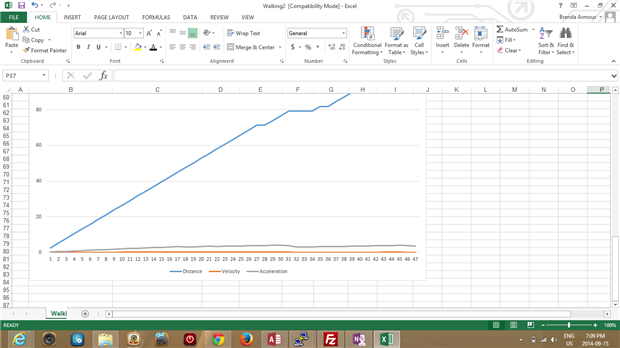
Not bad as the prototype box is just my interpretation of what it should like. This has to be outsourced to create the final enclosure. The time difference probably turning off the stop watch too soon. I exported the Access Table to Excel because graphing in Access still is limited:
Going Forward
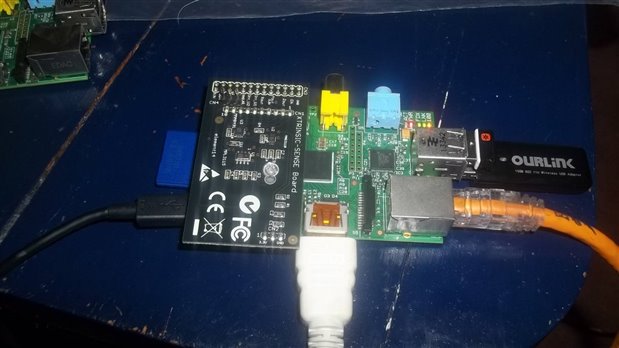
This is the Xtrinsic sense board. It is attached to the Raspberry Pi and contains 3 evaluation sensors. 1. MAG3110 (Magnetometer) 2. MPL3115A2 (temperature/pressure) 3. MMA8491Q (accelerometer). This is an evaluation board. I would like to research the possibility of matching the MAG3110 with the contact sensor. Here is a screen shot of the demo:
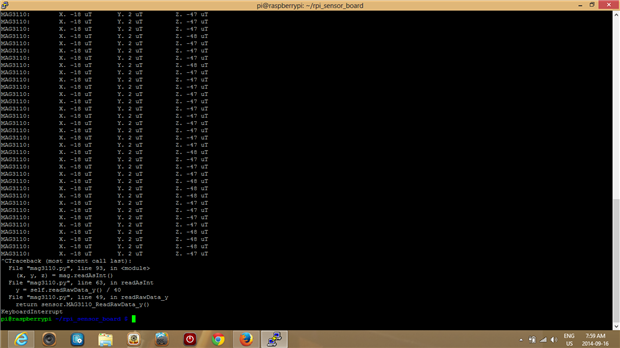
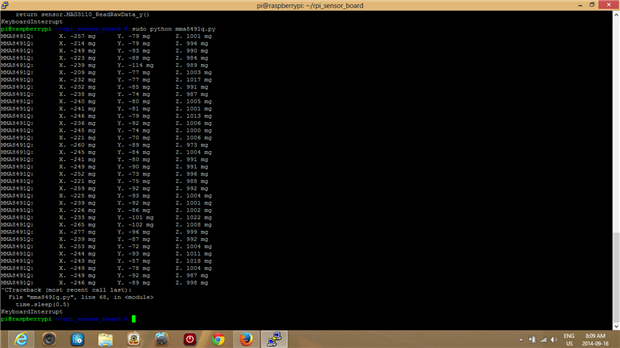
This raw data could provide longitude and latitude and so position can be determined. Imagine precision mapping without GPS !
|
|---|
.
