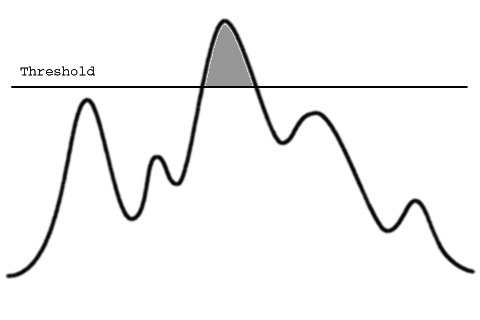
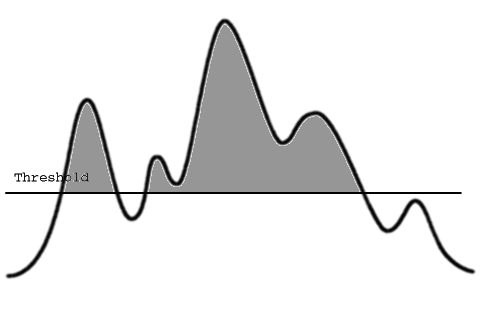
Very often it so happens in sensing-actuation based projects that an embedded system must take a certain action when the value of a sensed parameter is above a certain threshold. The most basic method of handling such a control loop is by hard coding a threshold or a set point. Then, for the embedded system, it becomes a binary decision. A High and a Low, even for analog inputs. However, one of the problems caused by this method is that the threshold does not change with a change in secondary environmental parameters affecting the primary sensed value.
Take for example, a system to detect whether or not a box has been opened using a light sensor. I would hard code the threshold, and it would work well at my place because its bright throughout the day. Now suppose I take it to another location where the lighting is not as optimal. The threshold will naturally change, but my code will not be able to adapt to this change without updating the firmware, which is a real problem with a system installed in an inaccessible location. But, if the system were able to adapt to the new lighting conditions, it would be able to determine its own threshold for the same.
I've faced this problem a few times, mainly while determining my threshold based on time series data. A different set of environmental parameters call for a new threshold. What these parameters might be is different for every application, so my initial idea of calculating a complex mathematical inclusion which would be expected to include subjective terms such as location was laughable. And all for segregating my data into two parts? That would be like buying an airliner to get to my local grocery store.
After taking a class on statistics, the intuitive value of statistical analysis for my data led me to come up with this small, rather easy algorithm for automatic generation of thresholds for time series data generated by my systems. Obviously, there are some assumptions here.
- The two groups to be distinguished are mutually exclusive.
- The sampling rate of the algorithm is much slower than the slope of the system.
- The algorithm, hence will not be used for data logging or frequency analysis
- There at least two known values for the algorithm to run.
The algorithm is as follows
Required packages : Numpy, Random, Matplotlib.pyplot
- Store sensor values in an array
Thresholding function :
- Sort the array in ascending order
- Get sequential difference by calculating difference between consecutive elements of ascending order array.(Store these values in an array as well) Let's call this array A.
- Similarly, get a sequential difference array of the sequential difference array (A) calculated in step 2, let's call it B
- Select the second largest value in B, and multiply it by two. This is your threshold for parameter for grouping. This will ensure that your groups aren't too close together.
- Select the element in sequential difference array (A) with the largest value. This element corresponds to the difference between the largest value in the 'OFF' group, ie lower threshold and the smallest value in the 'ON' group, ie the higher threshold, and gives you the difference between the two groups. Let's call this M.
- Generate the dynamic threshold by dividing M by 2 and adding the value of the lower threshold to get your actual dynamic threshold.
- Plot the graph.
Add time series data to input array (separate function):When your system senses a new value of light intensity (or your selected conditions);
- Append the value of light intensity to the input array
- Check the new value(NV) for the following conditions:
- NV > Highest value in entire input array
- NV < Lowest value in entire input array
- Lower Threshold < NV < Higher threshold
- If any of these conditions are true, call dynamic threshold function()
The resultant graphs look as follows. The first one is using the priory set of input data, and the second and third ones are after appending randomly generated values to the input dataset in two separate iterations.
As with all algorithms, this one does have its own set of drawbacks which are primarily illustrated by the assumptions made.
- This algorithm cannot be used for data logging and auto classification unless the algorithm selects data at a defined interval from the array of logged values.
- If the sampling rate of the algorithm is higher than the time required for the sensor to become stable, the algorithm will not be able to distinctly group the values because consecutive difference values are going to be very similar.
In the future, I plan to get rid of these drawbacks by introducing a more sophisticated and inclusive method of statistical classification.


Top Comments
-

satyavrat
-
Cancel
-
Vote Up
+1
Vote Down
-
-
Sign in to reply
-
More
-
Cancel
Comment-

satyavrat
-
Cancel
-
Vote Up
+1
Vote Down
-
-
Sign in to reply
-
More
-
Cancel
Children