element14 Community
element14 Community
    Register Log In
  • Site
  • Search
  • Log In Register
  • Community Hub
    Community Hub
    • What's New on element14
    • Feedback and Support
    • Benefits of Membership
    • Personal Blogs
    • Members Area
    • Achievement Levels
  • Learn
    Learn
    • Ask an Expert
    • eBooks
    • element14 presents
    • Learning Center
    • Tech Spotlight
    • STEM Academy
    • Webinars, Training and Events
    • Learning Groups
  • Technologies
    Technologies
    • 3D Printing
    • FPGA
    • Industrial Automation
    • Internet of Things
    • Power & Energy
    • Sensors
    • Technology Groups
  • Challenges & Projects
    Challenges & Projects
    • Design Challenges
    • element14 presents Projects
    • Project14
    • Arduino Projects
    • Raspberry Pi Projects
    • Project Groups
  • Products
    Products
    • Arduino
    • Avnet & Tria Boards Community
    • Dev Tools
    • Manufacturers
    • Multicomp Pro
    • Product Groups
    • Raspberry Pi
    • RoadTests & Reviews
  • About Us
  • Store
    Store
    • Visit Your Store
    • Choose another store...
      • Europe
      •  Austria (German)
      •  Belgium (Dutch, French)
      •  Bulgaria (Bulgarian)
      •  Czech Republic (Czech)
      •  Denmark (Danish)
      •  Estonia (Estonian)
      •  Finland (Finnish)
      •  France (French)
      •  Germany (German)
      •  Hungary (Hungarian)
      •  Ireland
      •  Israel
      •  Italy (Italian)
      •  Latvia (Latvian)
      •  
      •  Lithuania (Lithuanian)
      •  Netherlands (Dutch)
      •  Norway (Norwegian)
      •  Poland (Polish)
      •  Portugal (Portuguese)
      •  Romania (Romanian)
      •  Russia (Russian)
      •  Slovakia (Slovak)
      •  Slovenia (Slovenian)
      •  Spain (Spanish)
      •  Sweden (Swedish)
      •  Switzerland(German, French)
      •  Turkey (Turkish)
      •  United Kingdom
      • Asia Pacific
      •  Australia
      •  China
      •  Hong Kong
      •  India
      •  Korea (Korean)
      •  Malaysia
      •  New Zealand
      •  Philippines
      •  Singapore
      •  Taiwan
      •  Thailand (Thai)
      • Americas
      •  Brazil (Portuguese)
      •  Canada
      •  Mexico (Spanish)
      •  United States
      Can't find the country/region you're looking for? Visit our export site or find a local distributor.
  • Translate
  • Profile
  • Settings
Personal Blogs
  • Community Hub
  • More
Personal Blogs
Legacy Personal Blogs Smooth (heart) beats
  • Blog
  • Documents
  • Mentions
  • Sub-Groups
  • Tags
  • More
  • Cancel
  • New
  • Share
  • More
  • Cancel
Group Actions
  • Group RSS
  • More
  • Cancel
Engagement
  • Author Author: fustini
  • Date Created: 6 May 2012 9:46 AM Date Created
  • Views 791 views
  • Likes 2 likes
  • Comments 2 comments
  • hrmshield
  • biosensing
  • arduino
Related
Recommended

Smooth (heart) beats

fustini
fustini
6 May 2012

Howdy,


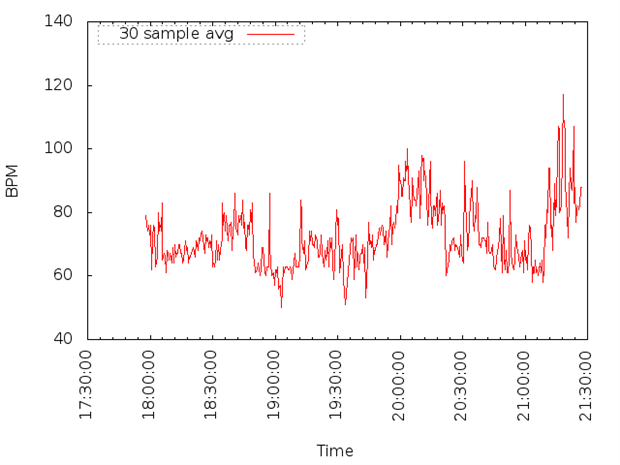
Thanks to a comment by YT2095 on my last post, I started thinking that I need to do more averaging to achieve a smoother graph.  It turns out that this is very simple to do as the Arduino sketch writes 30 BPM samples per line to the text file on the SD card.  I created a new script named parse-avg.pl to take the average of every 30 sample set.  This created a graph with less fluctuation:

image

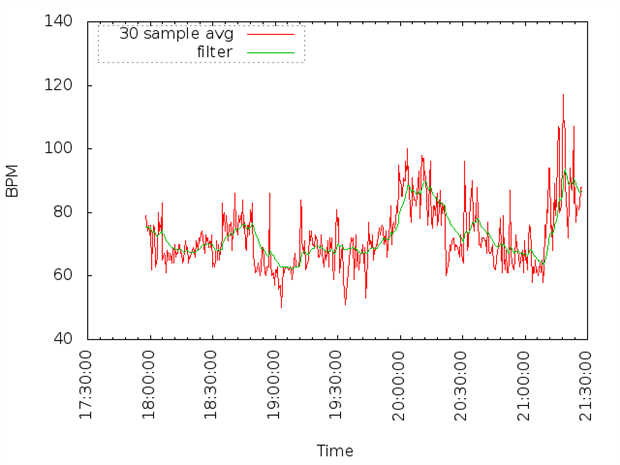
This new averaged data is feed into filter.pl, and a much smoother graph is generated:

image

Here is a comparison with both on a the same plot:

image

So I think the plot of the filtered data now is much easier to interpret.  However, I need to verify that the data is actually still accurate.  I have basic Polar wrist watch receiver which I can use to benchmark.  It doesn't log BPM readings, so I will have to write down the reading 30 sec for a short test run (say 10 minutes).  Then I can graph the written-down wristwatch readings versus the hrmshield filtered data.


Cheers,

Drew

  • Sign in to reply
  • fustini
    fustini over 13 years ago in reply to DAB

    Thanks for the tips.  Yeah, I'm concerned that by filtering too strongly I'll miss what was actually happening. 


    For example, the final peak was from push-ups and jumping jacks.  I know it was more intense than any previous activity.  However, the "filter" plot starts to loose the difference in activity between that and the second to last peak.


    I'll try plotting those different functions to contrast.


    Thanks,

    Drew

    • Cancel
    • Vote Up 0 Vote Down
    • Sign in to reply
    • More
    • Cancel
  • DAB
    DAB over 13 years ago

    Hi Drew,


    You may need to play around with your averaging levels before you get the best combination for the data.

    You might take a look at running min, max and average analysis and use a least squares fit to see which gives you a close fit.

    If you over filter, sometimes you can miss critical transitions in the data.


    Just a thought,

    DAB

    • Cancel
    • Vote Up 0 Vote Down
    • Sign in to reply
    • More
    • Cancel
element14 Community

element14 is the first online community specifically for engineers. Connect with your peers and get expert answers to your questions.

  • Members
  • Learn
  • Technologies
  • Challenges & Projects
  • Products
  • Store
  • About Us
  • Feedback & Support
  • FAQs
  • Terms of Use
  • Privacy Policy
  • Legal and Copyright Notices
  • Sitemap
  • Cookies

An Avnet Company © 2025 Premier Farnell Limited. All Rights Reserved.

Premier Farnell Ltd, registered in England and Wales (no 00876412), registered office: Farnell House, Forge Lane, Leeds LS12 2NE.

ICP 备案号 10220084.

Follow element14

  • X
  • Facebook
  • linkedin
  • YouTube