This is part 2 of a series of 3 parts that I have planned for the Rohde & Schwarz RTB2K-COM4 Digital Oscilloscope road test. In this part I am planning to cover waveform display and trigger function, waveform math functions, and waveforms measurements.
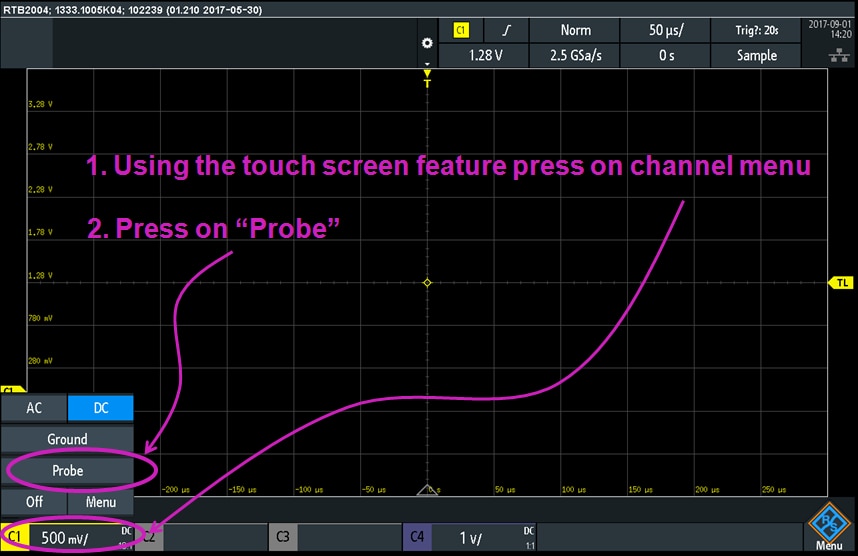
First I wanted to follow up on a comment I received for part 1 of this blog series from Rick, who has pointed out that there is a built-in wizard that helps the probes compensation. So I wanted to explore this feature of the Rohde & Schwarz RTB2004 oscilloscope. I have accessed the probe compensation from the channel menu:
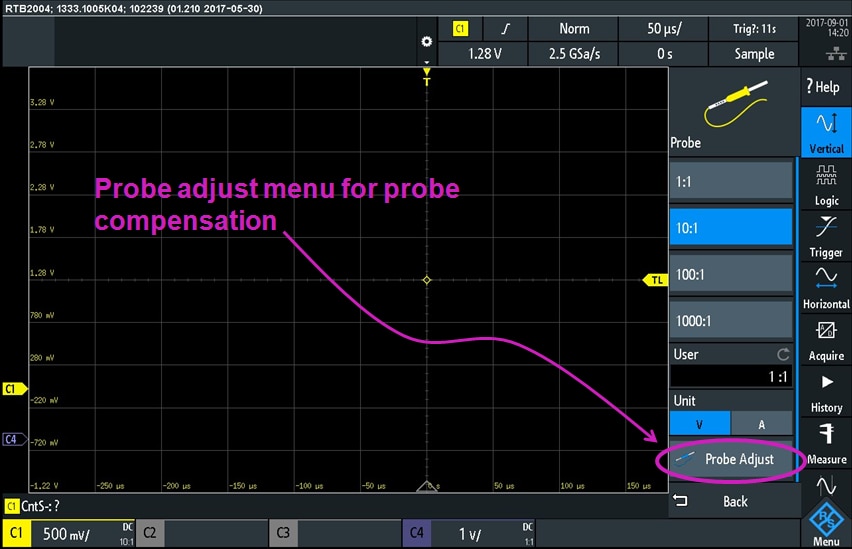
Then the probe settings menu opened. On this menu I then pressed on "Probe Adjust" selection:
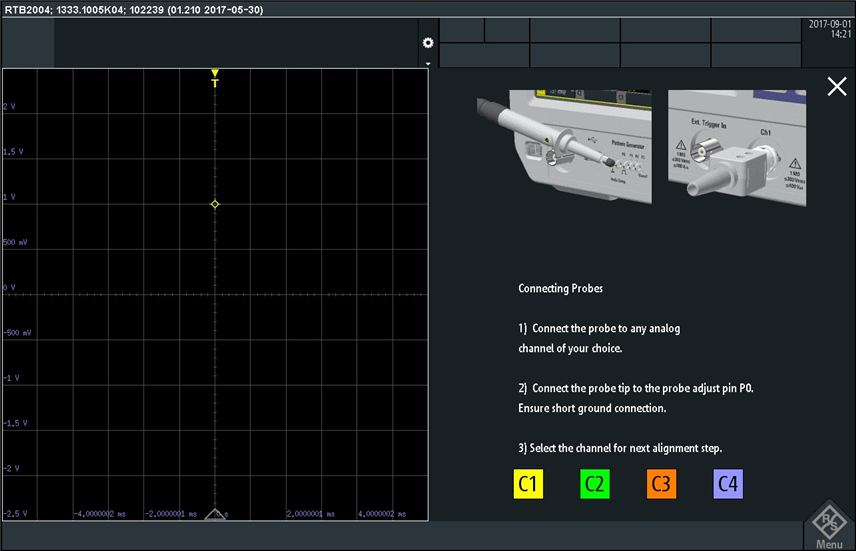
and then the probe compensation menu showed up. I was impressed of the detailed explanations with drawings of how to hold the probe on the pulse generator pins so that the ground part at the tip of the probe touches the ground pin and the tip of the probe touches the signal pin:
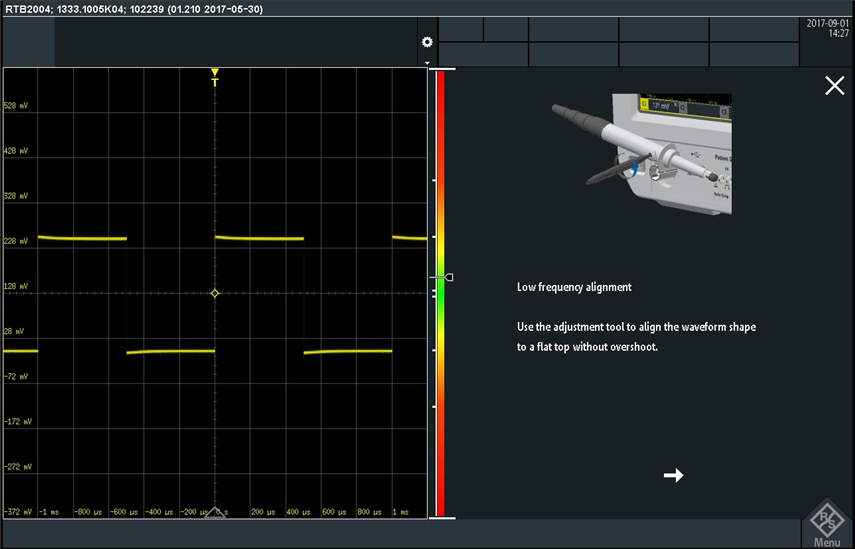
On this screen I selected "Channel 1" probe for compensation, and this took me to the next screen for low frequency probe compensation:
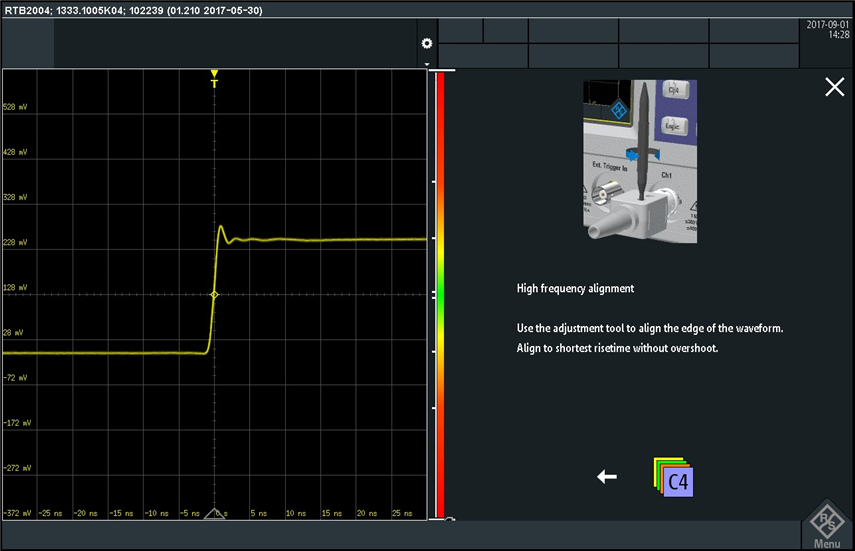
I like the drawing that shows how to insert the adjustment tool into the probe and how to rotate it to perform the compensation. These are very clear instructions and I think very beneficial especially to beginners and students. After completing the low frequency alignment I pressed on the "Next" arrow, which took me to the high frequency compensation screen:
Here I followed the instructions until I completed the probe compensation.
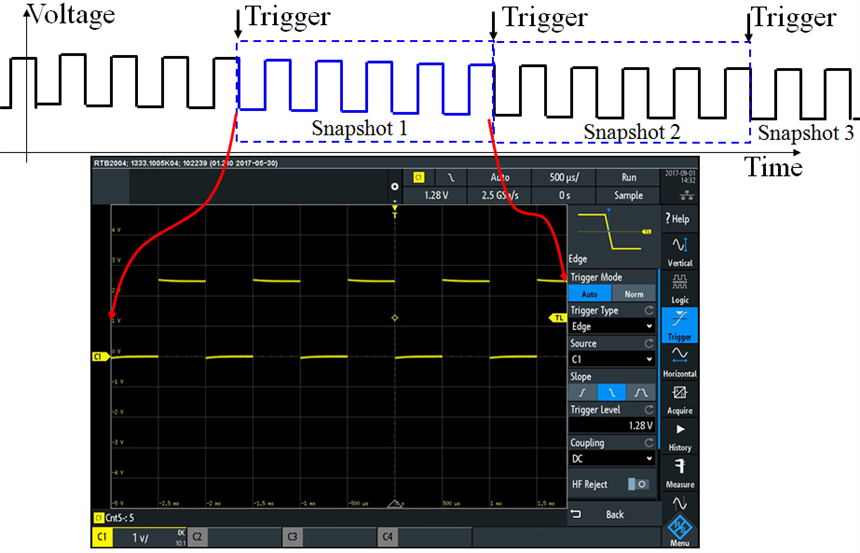
Before continuing with this road test evaluation, I want to take a moment for who is a beginner in electronics (I was a beginner long time ago) and summarize what an oscilloscope does. In a very simplistic way, an oscilloscope is an instrument that can be used to visualize how signals vary in time. The following figure shows a graphical representation of a square wave signal and the image of this signal as shown on the display of an oscilloscope:
We can view the oscilloscope as an instrument that captures successive snapshots of the signal waveform and displays them one after another on the screen. The trigger function of the oscilloscope ensures that each snapshot starts at the same location within the signal period so the sequence of snapshots overlap perfectly in one single waveform. The time base function of the oscilloscope ensures that each snapshot has the same length in time, thus when sequentially displaying these snapshots the image is clear and stable.
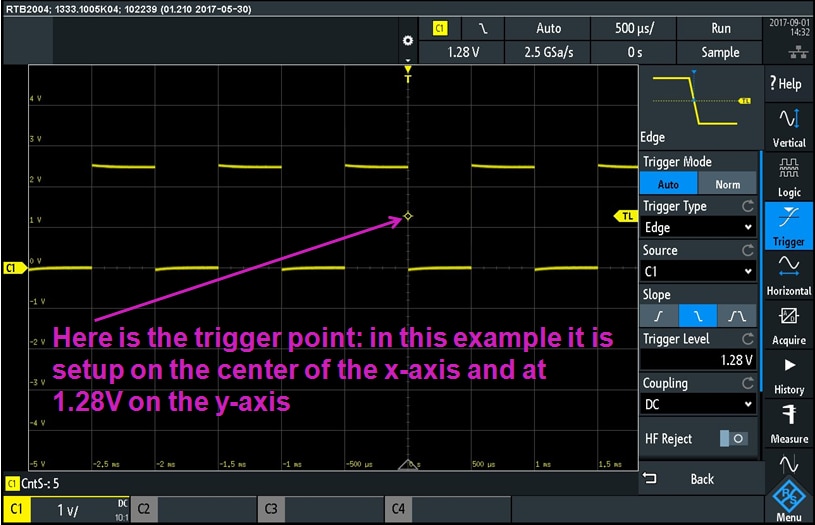
So let's look at the trigger menu of the Rohde & Schwarz RTB2004 oscilloscope:
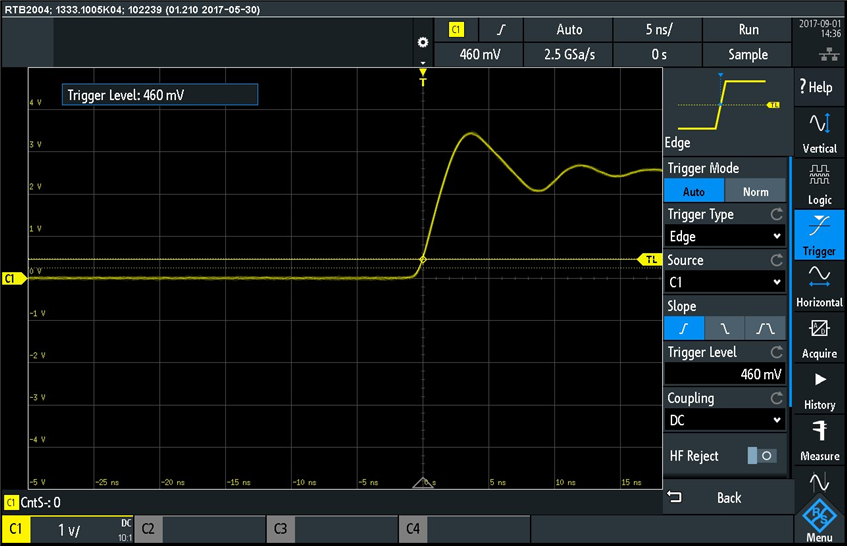
Let's see now what happens when we change the trigger level (from 1.28V shown in the above picture). Before we look at this I wanted to magnify the x-axis and see more details about the rising edge of the waveform:
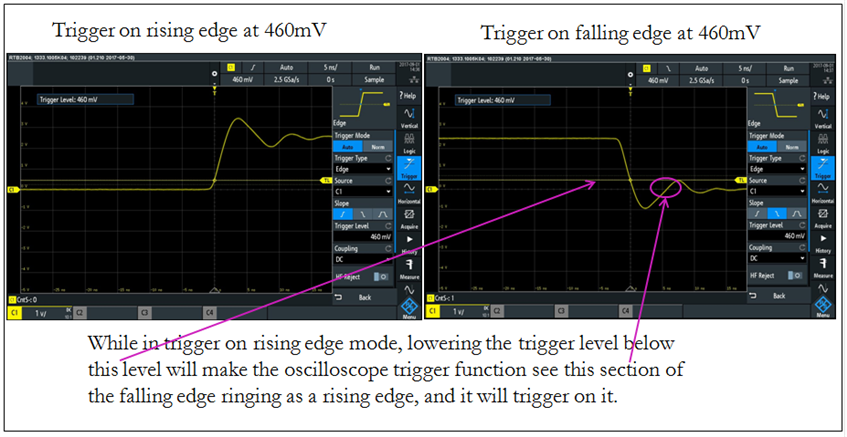
Notice that I also changed the trigger edge from "falling edge" to "rising edge", as shown in the "Slope" section of the trigger menu. In this example I have lowered the trigger level from 1.28V to 460mV. The waveform "shifts" on the horizontal axis so that the trigger point is always in the center of the x-axis of the screen. I then continued to lower the trigger level until the displayed waveform became unstable:
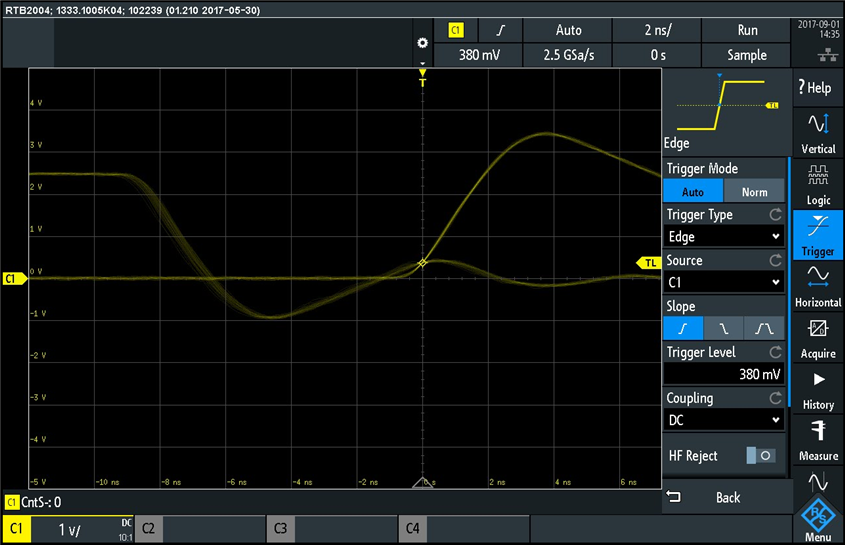
Notice there are two waveforms overlapping on the screen above. This happened at 380mV trigger level, so let's understand why this happens by looking at the picture below:
This is why we have two overlapped waveforms, one is triggered on the rising edge and the second is triggered on the ringing of the falling edge.
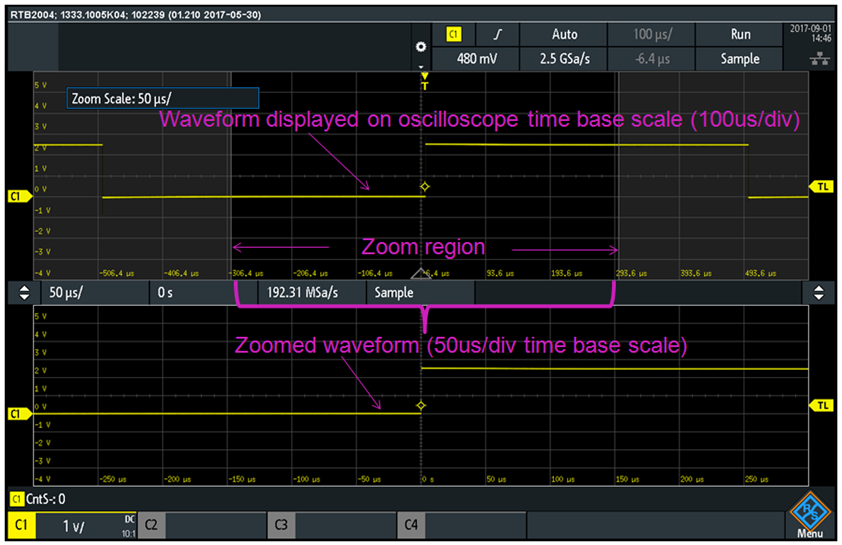
We can magnify the x-axis by adjusting the time base (time unit / division) or we can use the "Zoom" built-in function of the Rohde & Schwarz RTB2004 oscilloscope. I like the zoom function because I can keep the time base unchanged, thus displaying multiple rising and falling edges and I can use the "Zoom" function to see the details of each edge. Here is an example of using the zoom function:
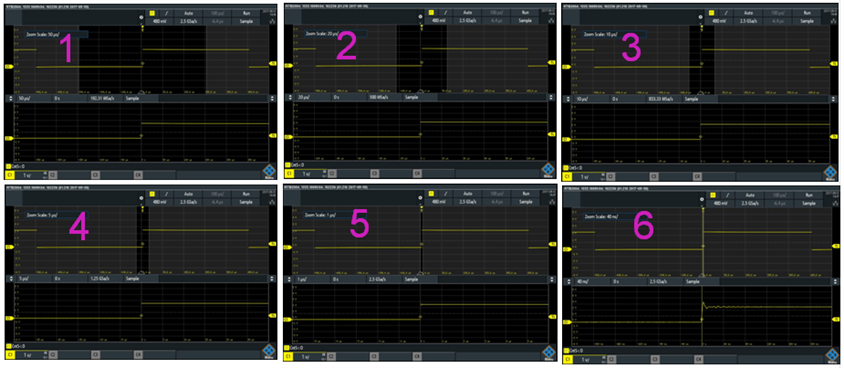
Notice the zoomed waveform is shown on 50 us/div while the oscilloscope is setup to 100us/div. The zoom window can be magnified by touch screen "dragging" the zoom region edges closer to each other. My experiment continued with gradually increasing the zoom magnification:
So the steps shown above helped me zoom and see the details of the rising edge in the center of the screen. Following similar steps I was able to see the details of the falling edge on the right side of the screen:
The highlighted region on the top waveform shows the zoom window, and the trace at the bottom represents a magnified view of the top trace in the zoom region.
Let's take a look now at the waveform math function built in this Rohde & Schwarz RTB2004 oscilloscope. The math function can be accessed from the touch screen menu at the bottom right corner of the screen:
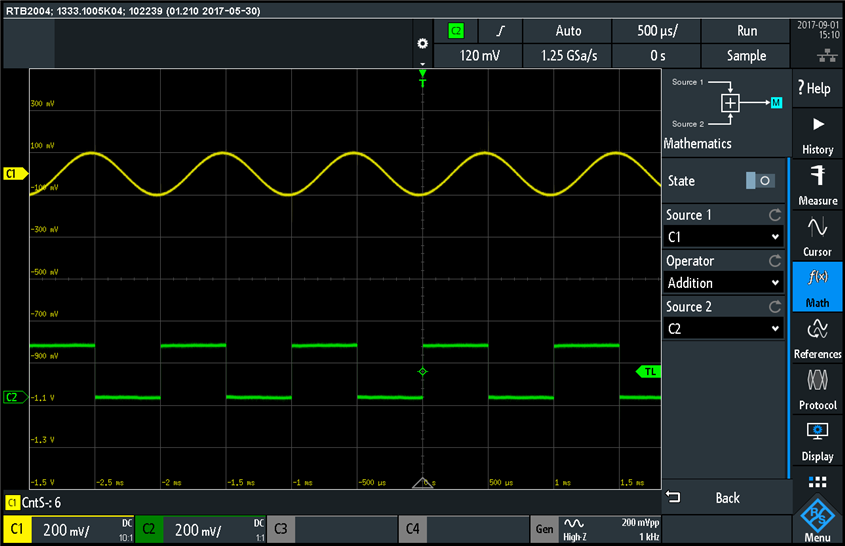
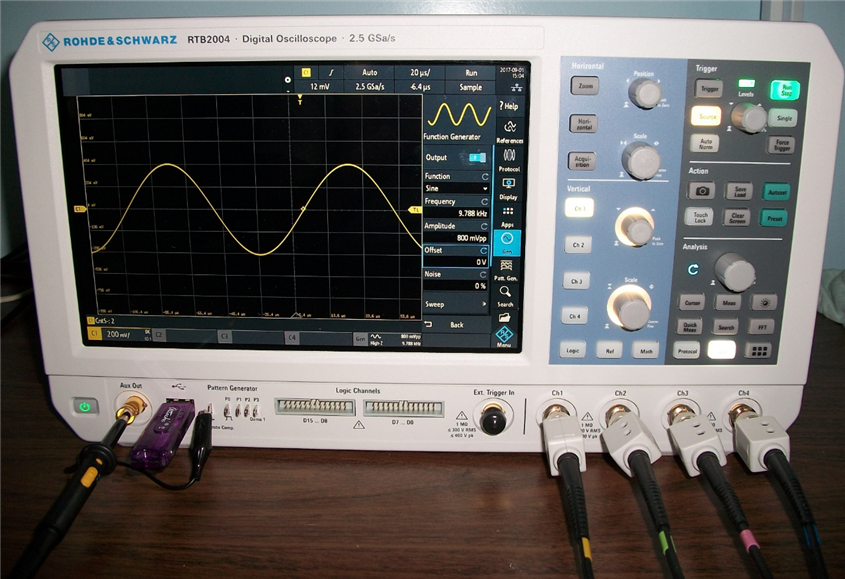
I like the visual representation of the selected math function shown at the top of the math function menu. I feel that this visual representation gives me the confidence that what I setup to measure is what I want to measure. The two waveforms on the screen are obtain by probing the calibration pulse with channel 2 and the function generator output with channel 1. I will analyze the function generator later, but here is a summary of how I setup the sinusoidal signal:
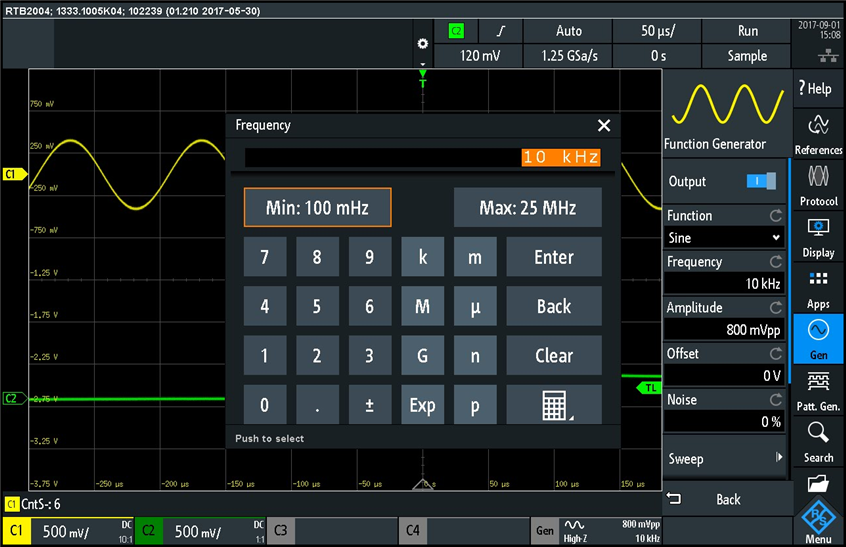
so I connected channel 1 probe to the "Aux Out" output f the oscilloscope and I then accessed the function generator menu from the main menu selection on the right side of the screen:
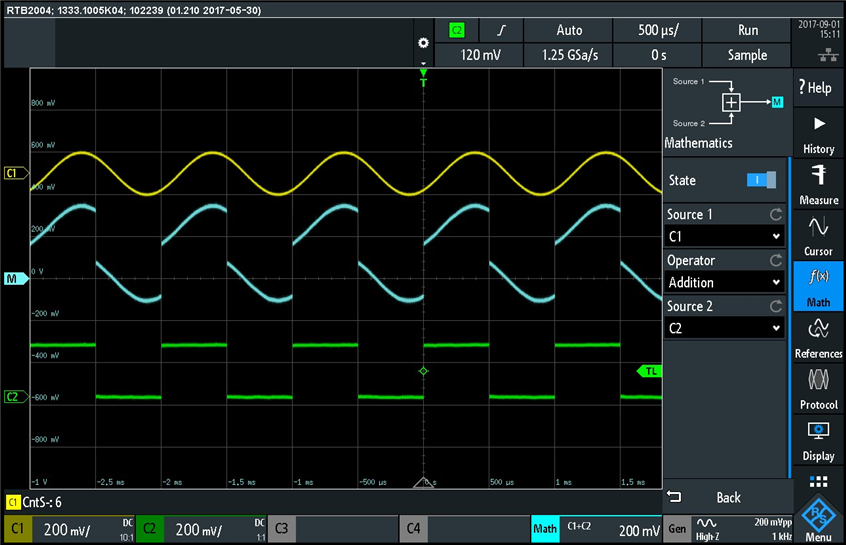
I like the touch-screen keypad for entering the numeric values for frequency, amplitude, offset, and noise. Going now back to the math function, I first setup an addition between the sinusoidal and square wave signals displayed on channel 1 and 2:
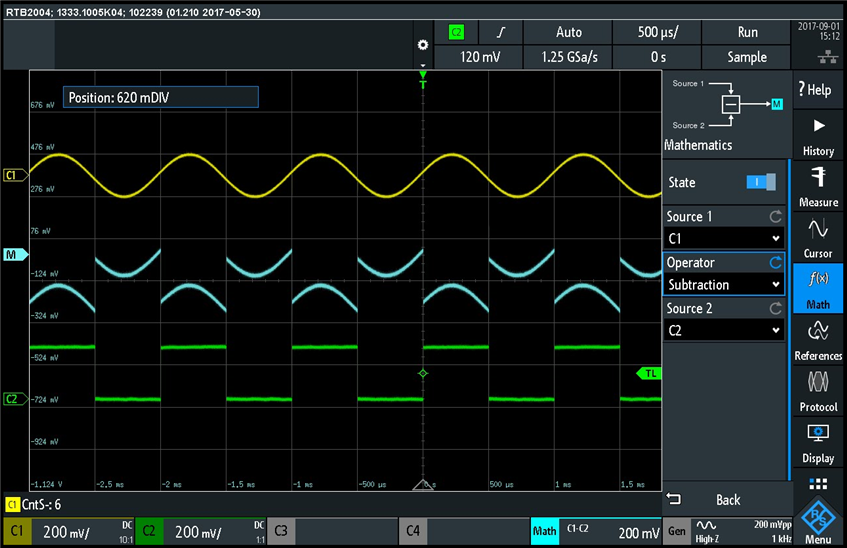
The sum of sinusoidal and square wave traces is represented by the blue trace. Next I setup a subtraction ch1 - ch2 (sinusoidal waveform minus square wave waveform):
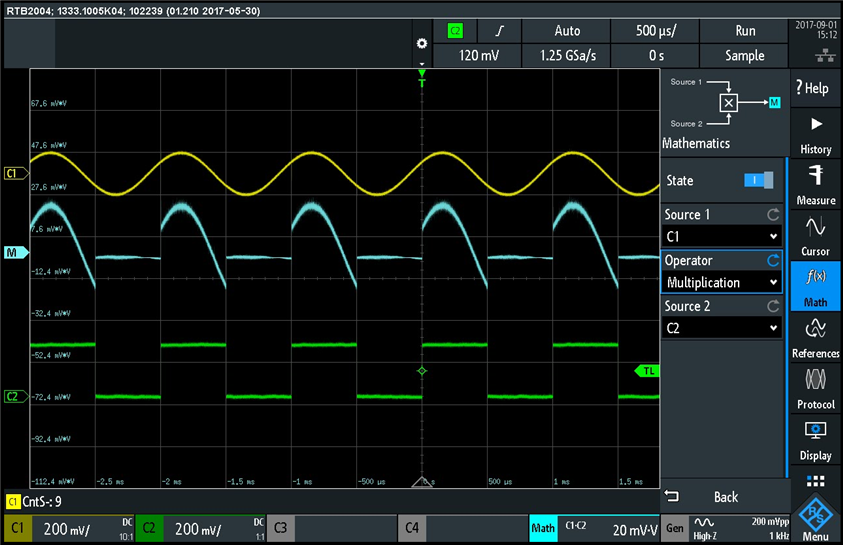
The other two operations I tried next were multiplication and division. The multiplication is shown in the screenshot below:
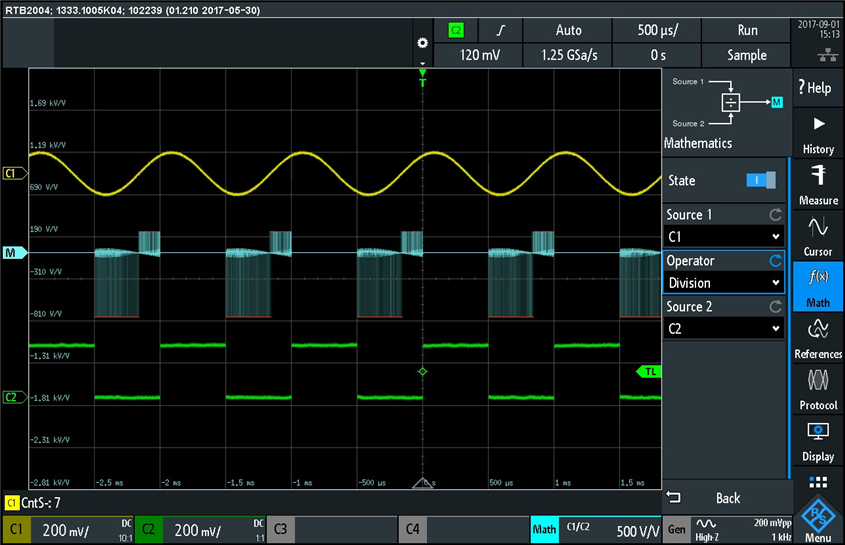
The multiplication result (blue trace) is equal to zero when the square wave is at zero volts, as we expect. The division was more interesting, since when the square wave is at "low" level (zero volts) we divide by zero, thus the result should be infinite. Here is the division waveform:
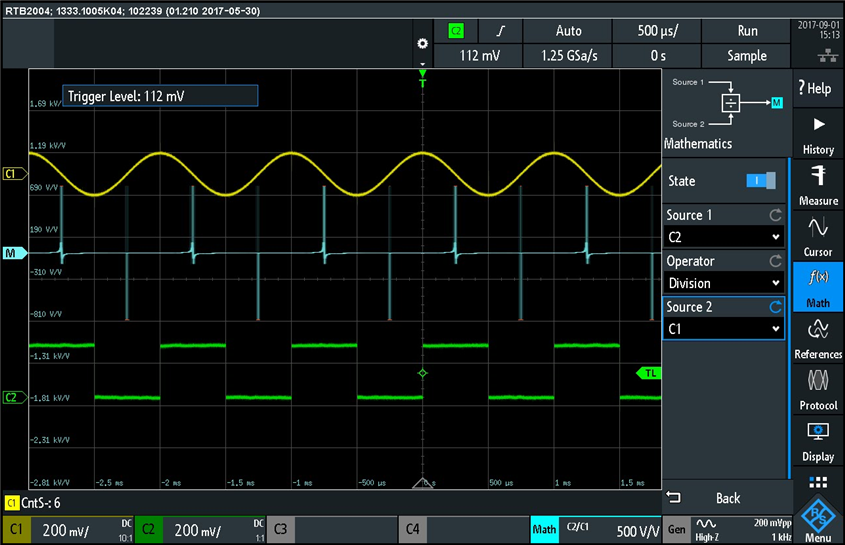
Notice that on the positive section of the sinusoid the divide by zero sends the result to an upper rail (suggesting "+" infinite value) and on the negative section of the sinusoidal signal the result goes to a low rail (suggesting "-" infinite value). Swapping the sinusoid with the square wave in the division operation resulted in this waveform:
Notice the infinite values are now aligned with the sinusoidal x-axis crossing points, where the sinusoidal signal has value of zero.
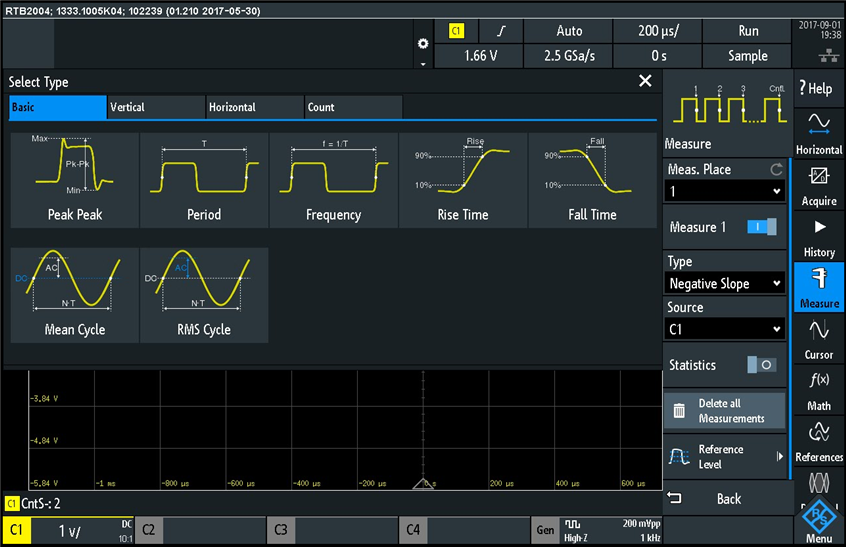
Next I looked at the built in waveform measurement functions. I was impressed of the clarity of graphical measurement description for each type of measurement. The measurement function is accessible from the main menu on the right side of the screen, and the measurements are grouped in four tabs, "Basic", "Vertical", "Horizontal", and "Count", each of these tabs showing the name and a graphical representation of the measurements. Here is an example screenshot of the "Basic" group:
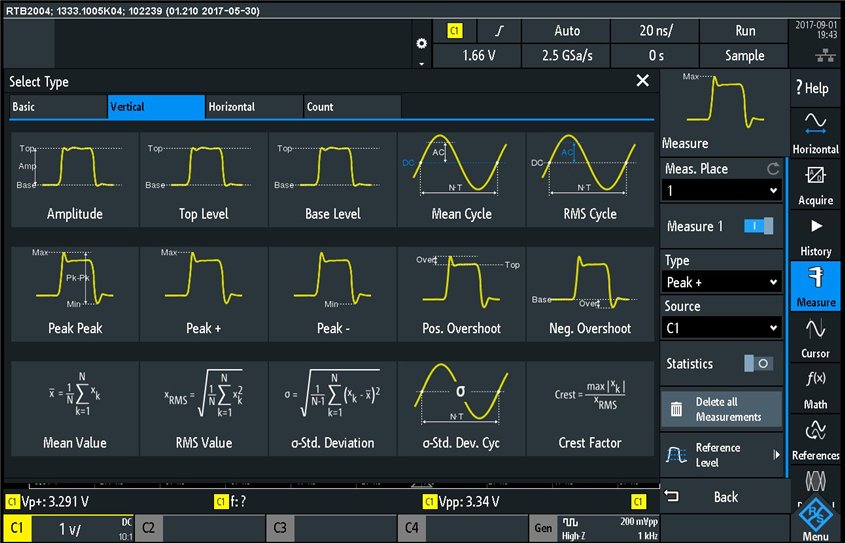
and here are the measurements under the "Vertical" tab:
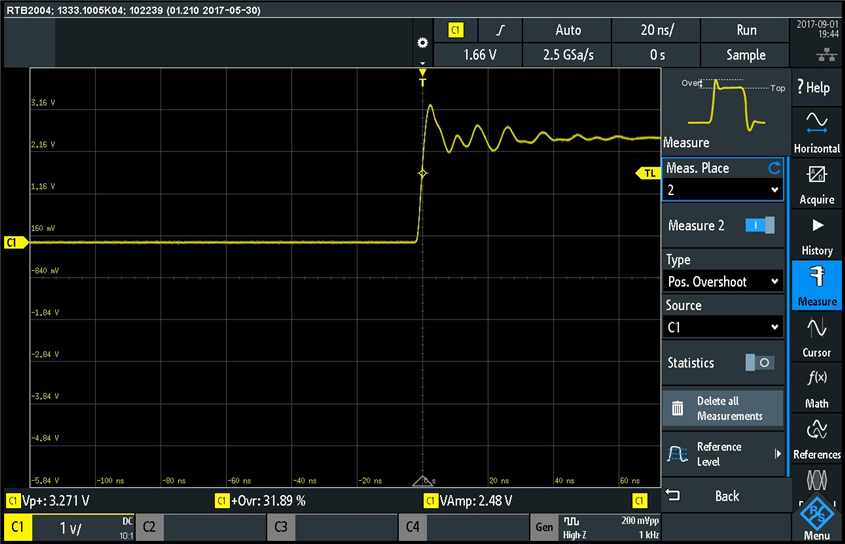
Next I performed some measurements on Channel 1 square wave signal. Here is a measurement of the positive peak, positive overshoot, and amplitude:
The measurements are shown at the bottom of the screen. The overshoot definition is shown in the measurement menu. Let's multiply the 31.89% overshoot and 2.48V amplitude, and we get 0.79V. This value represents the magnitude of the peak overshoot. If we add now the 0.79V and the 2.48V amplitude, we get 3.27V, which matches the peak value measured by the oscilloscope (Vp+:3.271V).
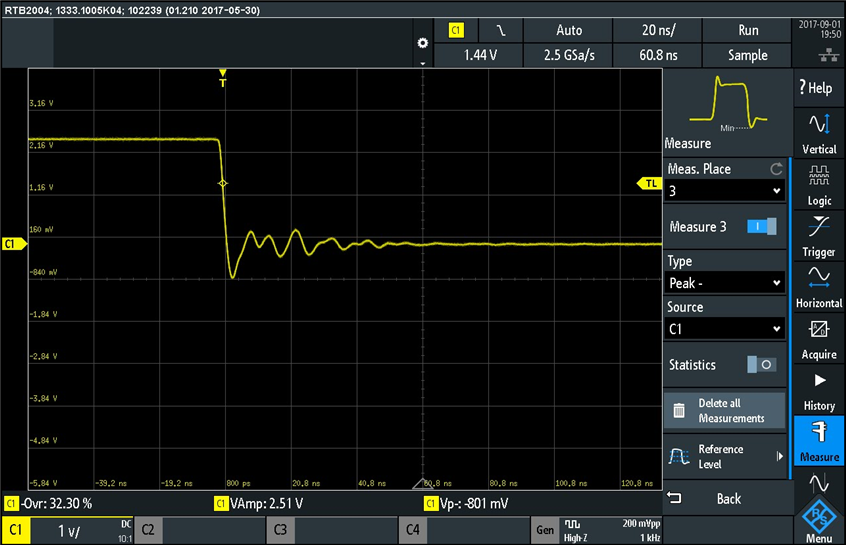
Similarly we can measure the peak of the falling edge:
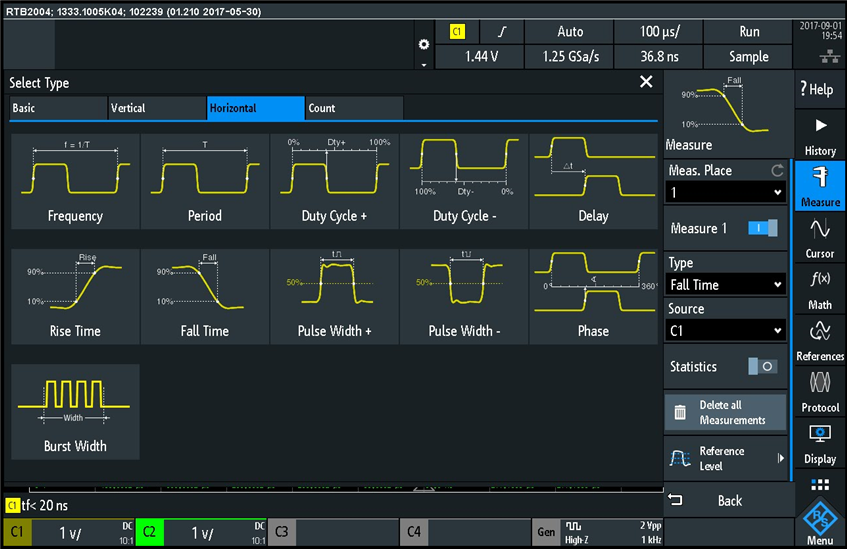
Another group of measurements is represented under the "Horizontal" tab:
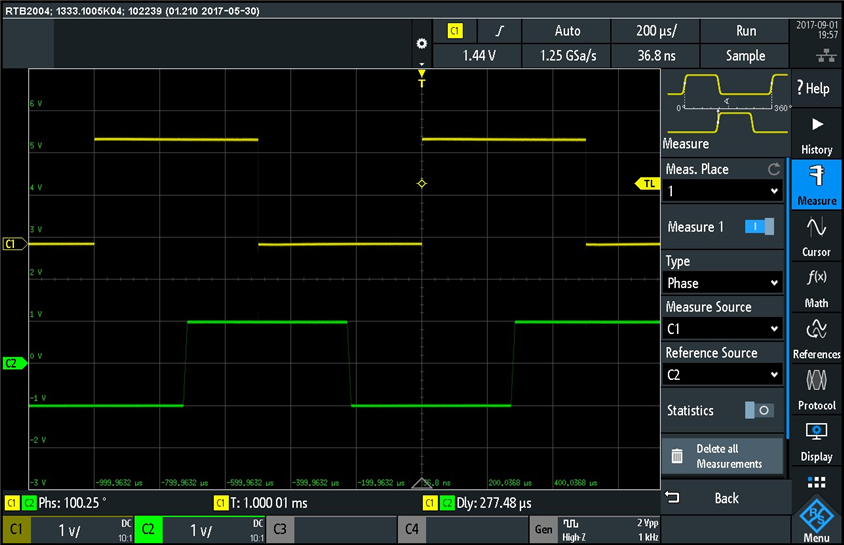
In this experiment I setup channel 1 to measure the probe compensation generator signal on the front panel and channel 2 to measure a square wave signal produced by the built-in function generator. With this setup I then used the built-in waveform measurements to measure the delay between these two signals and the phase difference, as shown in the screenshot below:
Notice the delay between these two signals is 277.48us (as shown at the bottom of the screen). This delay is related to the phase difference measured and displayed also at the bottom of the screen. The relationship involves the period of the signal. A full period represents 360 degrees phase, so the measured 277.48us represents 277.48us / 1000us = 0.27748 of the period (1000us is the period of these signals as displayed at the bottom of the screen). Now we can find the phase difference by multiplying 0.27748 by 360 degrees, which gives us 99.89 degrees. The oscilloscope measures 100.25 degrees phase difference, which is close to what we have calculated.
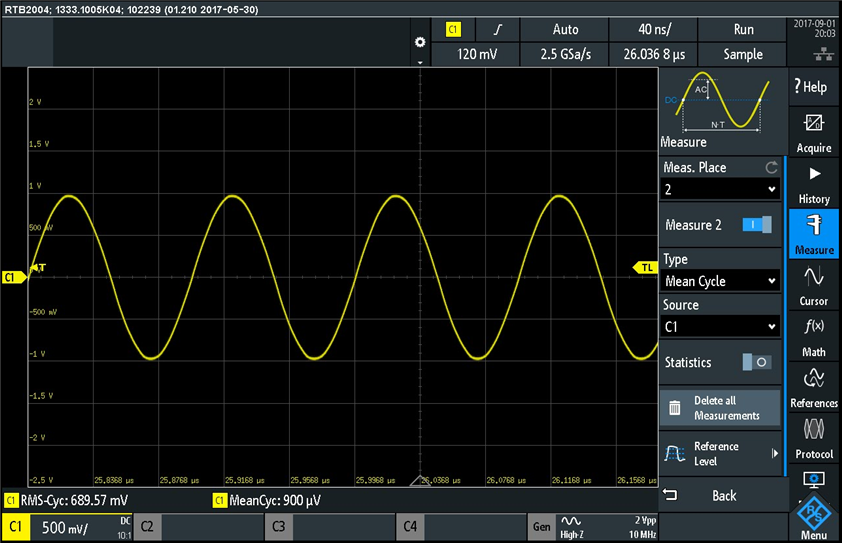
Next I setup the built-in function generator to generate a 1V amplitude (2V peak-to-peak) sinusoidal signal, and I measured the rms and mean values:
The measurements at the bottom of the screen show the RMS voltage of 689.57mV, and the mean cycle (average, which here is around 0V since the sinusoidal signal is centered on 0V) . The rms theoretical value for a sinusoidal signal of 1V amplitude (2V peak-to-peak) should be 0.707*1V = 707mV. The measured value on the Rohde & Schwarz RTB2004 screen is 689.57mV so there is a 7.4mV difference (~ 1% discrepancy) that I think it may come from the sinusoidal signal not being a perfect sinusoidal signal. The RMS (root mean square voltage) is what we measure with multimeters when we probe time varying signals Not all oscilloscopes have built-in measurement for RMS voltage, so in many cases we need to use a digital multimeter (DMM) to measure the RMS value; however, DMMs are usually limited in bandwidth so they do not measure accurately the RMS value of high frequency signals. I like this Rohde & Schwarz RTB2004 oscilloscope since all the built-in measurements work up to the full bandwidth of the oscilloscope
So what is the physical meaning of the RMS value of a time varying signal?
A DMM measures the rms value of a sinusoidal signal, which is equal to the peak voltage multiplied by 0.707.
Here is a clarification for the "rms" (Vpeak*0.707) and also the "average" (Vpeak * 0.636) values of a sinusoidal waveform:
The factors 0.707 and 0.636 result from the following analysis:
0.707 comes from the rms voltage definition. V_rms, is a constant (DC) voltage that produces the same average power dissipation on a resistor as the sinusoidal voltage V_max*sin(ω*t). The power dissipation P = V*I = V^2 / R . So for V_rms, which remember is a DC voltage, it’s easy: P_avg = V_rms^2 / R; however, for a sinusoidal voltage P_avg = ( V_max*sin(ω*t) )^2 / R = [V_max^2 * (sin(ω*t))^2] / R . Since these two average powers have to be equal, it results that: V_rms^2 = V_max^2 * (sin(ω*t))^2. The sinusoidal term is an average over many periods of a sin square function, which from trigonometry or from an intuitive graphic (similar to a sinusoid but shifted up and varying between 0 and 1) has the value of 0.5. Inserting 0.5 in the above equation V_rms^2 = V_max^2 * 0.5, and taking square roots on both sides V_rms = V_max * squareroot(0.5) = V_max * 0.707
0.636 comes form calculating the time average of voltage (not power like in the rms case above) for one half cycle. By integrating the sinusoidal voltage over half of period we obtain V_max * (2/pi) = V_max * (2/3.14) =V_max * 0.636
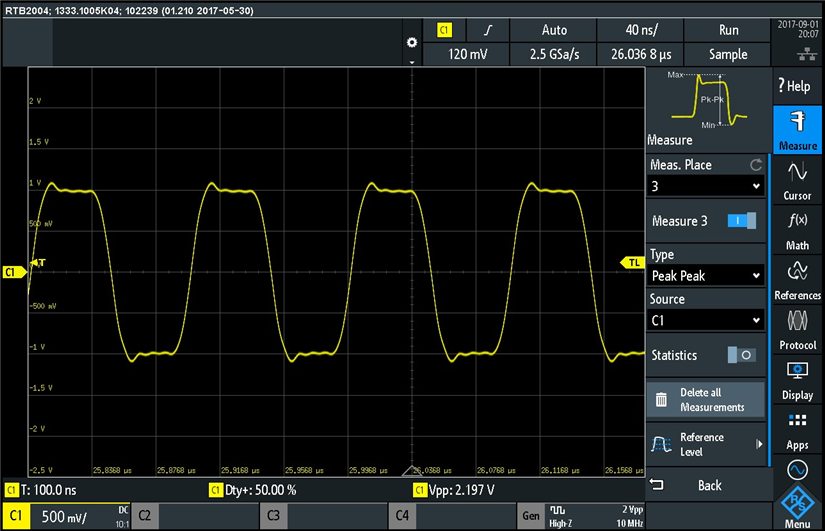
Another type of measurements built-in the Rohde & Schwarz RTB2004 oscilloscope are statistical measurements. To evaluate statistical measurements I setup a 10MHz square wave signal generated by the built in function generator. I intentionally used the ground clip of the probe instead of a coaxial connector to create some loop inductance and see a little overshoot and ringing on this waveform (see lab setup in one of the pictures above).
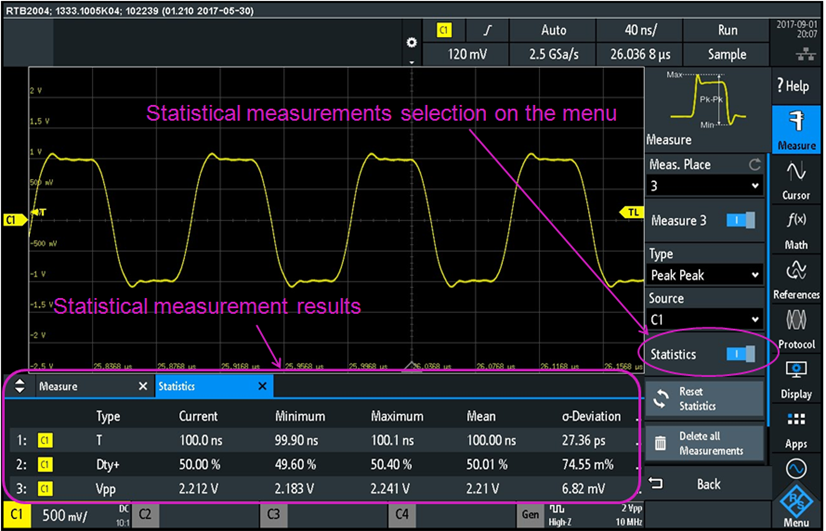
On this waveform I measured the period, duty cycle, and peak to peak voltage. These measurements are shown at the bottom of the screen. Next I activated the statistical measurements by pressing the "Statistics" selection of the measurement menu, as we can see in the picture below:
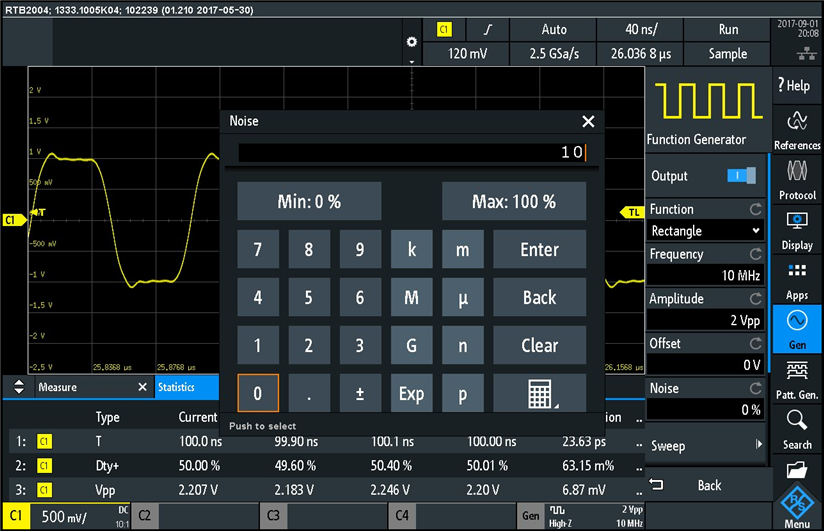
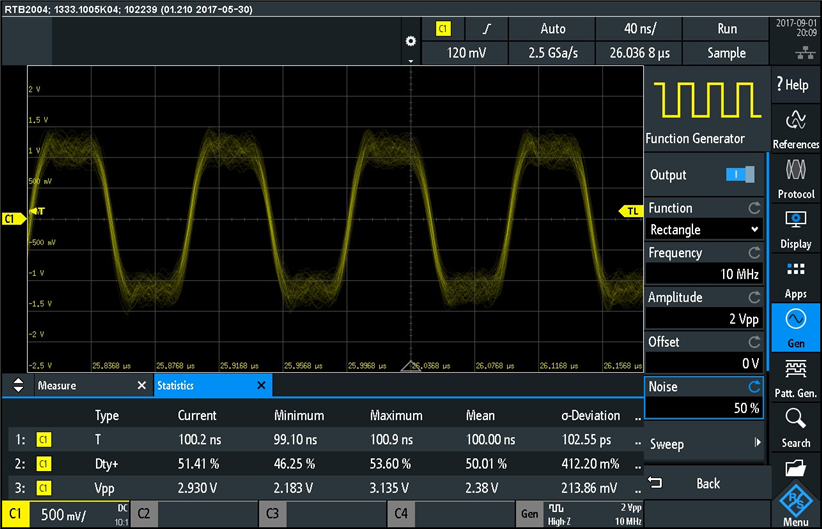
The statistical measurement values are displayed at the bottom of the screen in a table. For each measurement type we see the current measurement in the sequence of continuous measurments, the minimum value that has been measured, the maximum value, the mean value, and the standard deviation. Notice the standard deviation is very small compared with the mean value. This is typical for "clean" signals, but let's see what happens with noisy signals. The Rohde & Schwarz RTB2004 oscilloscope has a feature to inject noise in the signal generator output, which I find very beneficial for lab experiments and circuit characterization. So I added some noise on the square wave signal, using the noise selection in the measurement menu, as shown in the screenshot below:
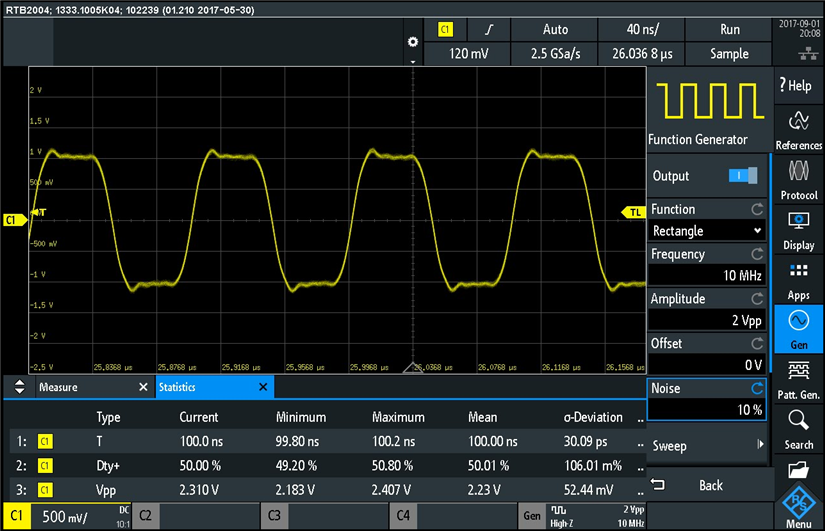
Noise injection is entered as percentage using a numerical keypad displayed on the screen and activated when touching the "Noise" selection on the function generator menu. I started by adding 10% noise:
Notice the standard deviation has increased, meaning that the sequence of continuous measurements capture different values of period, duty cycle, and peak-to-peak voltages every time they sample the signal (due to the added noise). The waveform looks a little "fuzzy" due to the added noise. Let's add more noise and see what happens:
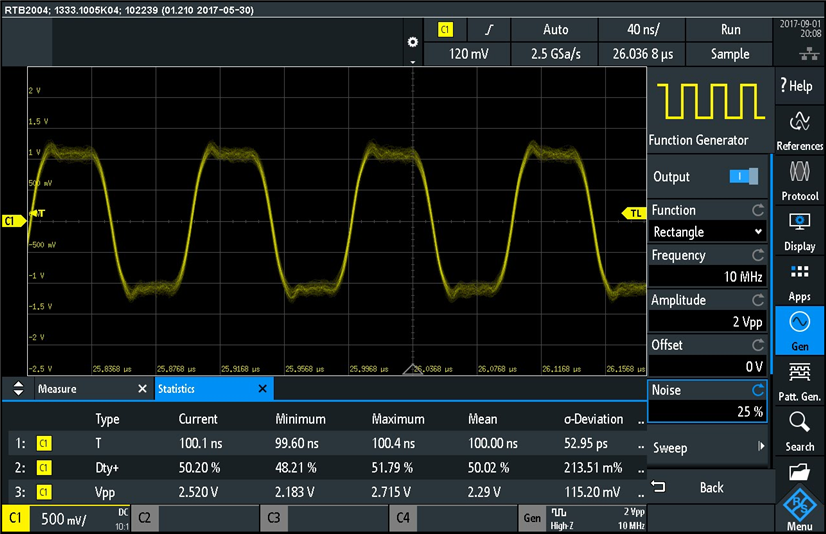
So I increased the noise to 25%, and we can see the displayed waveform is fuzzier than before and the standard deviation has increased. Minimum value has decreased and maximum value has increased. Let's increase even more the noise. Here is the waveform and measurements for 50% added noise:
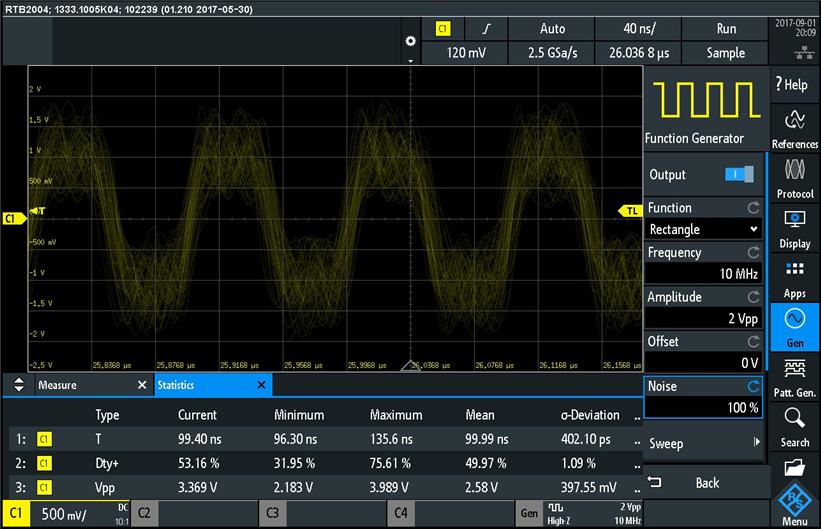
and here is the waveform and measurements with 100% added noise:
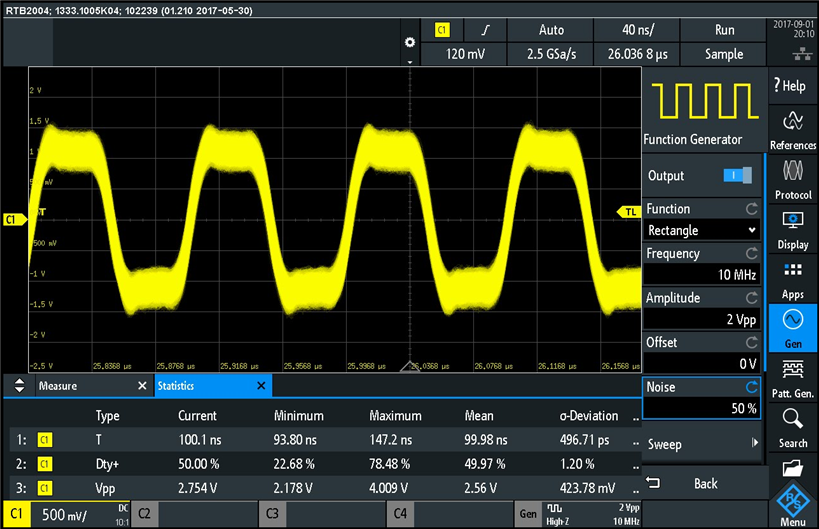
One feature that I also like at this oscilloscope is the "infinite persistence" display mode, where all the previous waveform "snapshots" are maintained displayed on the screen and new signal captures are overlapped on the previously displayed ones. This feature is beneficial for studying timing jitter and noise on signals and also for visualizing intermittent glitches in circuit troubleshooting. Here is a screenshot of the square wave signal with 50% noise displayed with infinite persistence:
I am overall very impressed of the performance I saw so far on this Rohde & Schwarz RTB2004 oscilloscope, and I am excited to continue to do more evaluation work. For now, this concludes the second part of my road test evaluation of the Rohde & Schwarz RTB2004 oscilloscope I will come back with new results as soon as I complete more evaluation work.
Best Wishes to Everyone,
Cosmin


Top Comments
-

jpnbino
-
Cancel
-
Vote Up
+1
Vote Down
-
-
Sign in to reply
-
More
-
Cancel
Comment-

jpnbino
-
Cancel
-
Vote Up
+1
Vote Down
-
-
Sign in to reply
-
More
-
Cancel
Children