


The most important part of an instrument is how well it performs. This section covers some tests done using other benchtop equipment to try and characterise the performance of the QPX750SP. As the power envelope of the QPX750SP far exceeds most of my equipment’s capabilities, tests in this section were performed at set-points below the maximum capabilities of the QPX750SP and represent the operational characteristics across a common-range across the equipment involved. Unfortunately, this also means that the performance seen here may not fully depict the capabilities or behaviours of the unit.
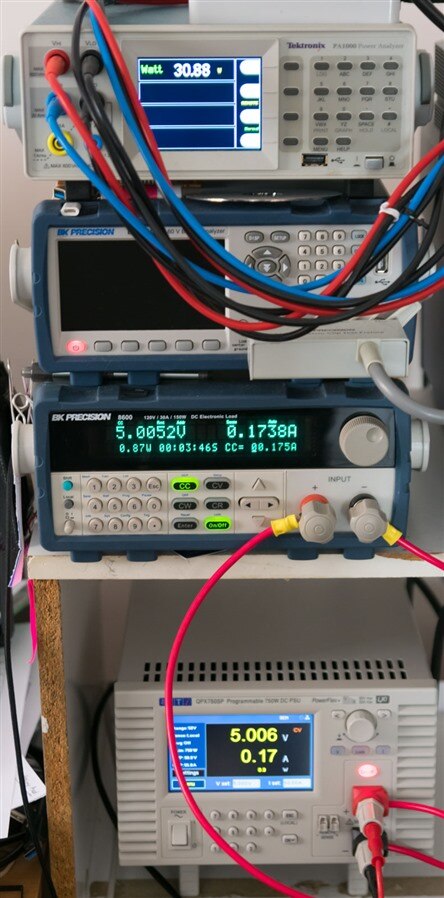
Testing in this section involved a Tektronix PA1000 Power Analyzer, B&K Precision Model 8600 DC Electronic Load, Rohde and Schwarz RTM3004 Oscilloscope and Keithley 2450 SourceMeter, all acquired through many years of participation in the element14 RoadTest program.
Please note that experiments related to logic input and output, or quasi-analog control are covered in Ch4: Remote Interfaces & PC Connectivity. Similarly, experiments relating to servicing a full load and efficiency under constant-resistance operation are covered in Ch7: Full Power Load Testing.
Voltage and Current Programming and Readback Accuracy
In general, the programming and readback accuracy of the QPX750SP were much better than implied by the datasheet.
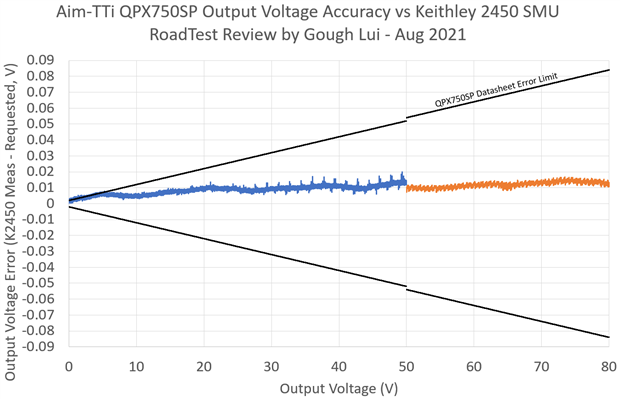
Voltage programming accuracy was assessed with the extremely accurate SMU and really was well within the bounds imposed by the datasheet, perhaps being a bit close to the upper limit at 5V or below. Regardless, the worst-case deviation was only approximately 20mV.
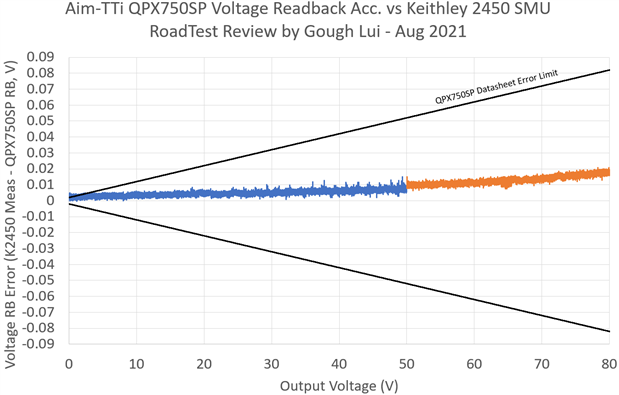
The readback performance was similarly good – with a similar pattern and a worst-case deviation of about 20mV as well.
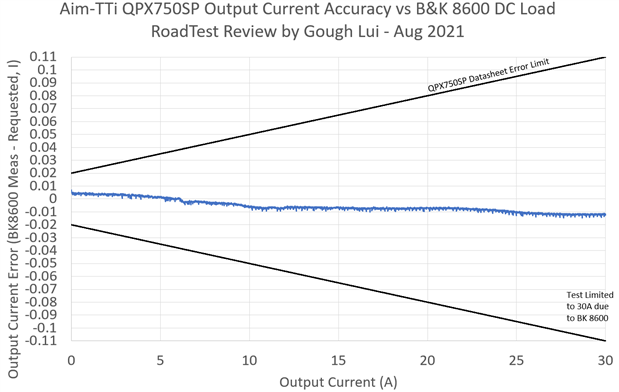
Current programming accuracy was assessed with the DC electronic load up to 30A. The resulting curve shows the current is well within the specified error bounds, reaching a worst case of about 14mA deviation.
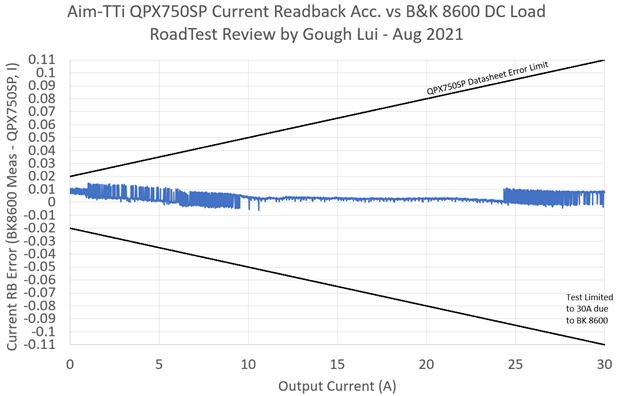
Current readback error was similar in terms of error, although above 1A, the results did show some quantisation as the QPX750SP was reporting readback in 10mA steps as per its specifications. Still, the accuracy of programming and readback overall is unexpectedly excellent for a general purpose power supply with such a wide power envelope.
Channel Start-Up and Shut-Down Behaviour
Channel start-up and shut-down behaviour was observed with the outputs unloaded and 40V selected.
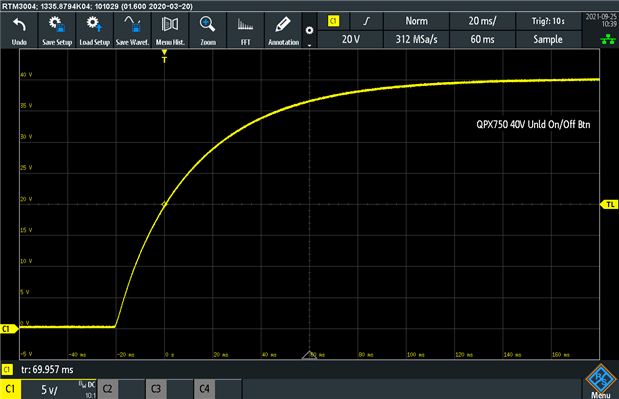
Switching the output on using the button, the rise time is a leisurely 69.957ms. It seems that the supply isn’t in a hurry – perhaps a sign of some level of output capacitance.
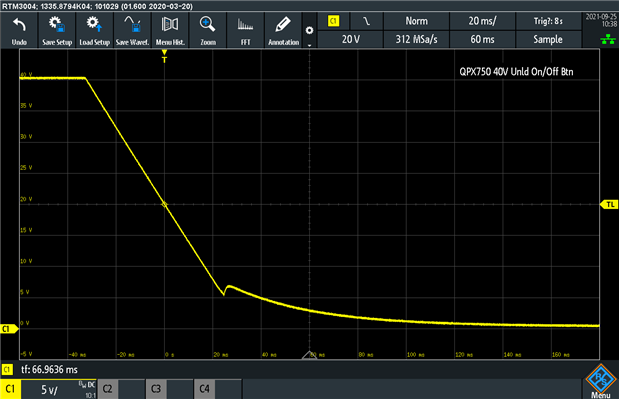
Switching the output off using the button, the fall time is also similar at 66.9636ms. This is not too bad for a general-purpose supply, as some others may have times as long as 200ms, but the decline is linear at first, then follows a more traditional capacitor discharge style exponential decay, suggesting some active down-programming to 5V.
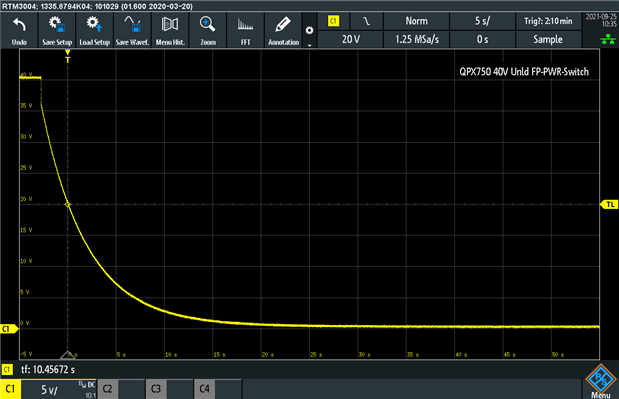
Powering-down the unit using the front panel power switch resulted in an increase in fall time to about 10.4s, in this case, relying on what is probably a slow bleeder resistor. No unregulated transient spike in voltage is seen, which is a safe behaviour for connected loads.
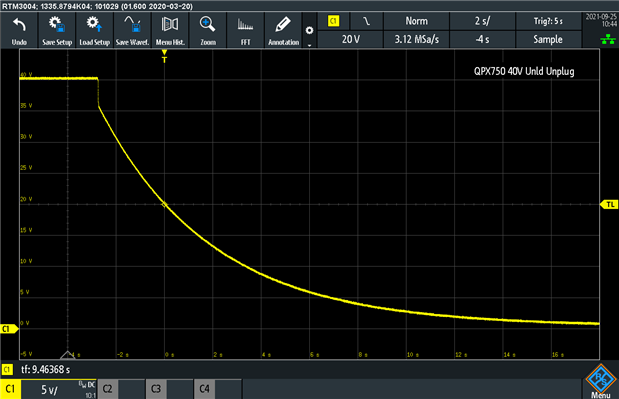
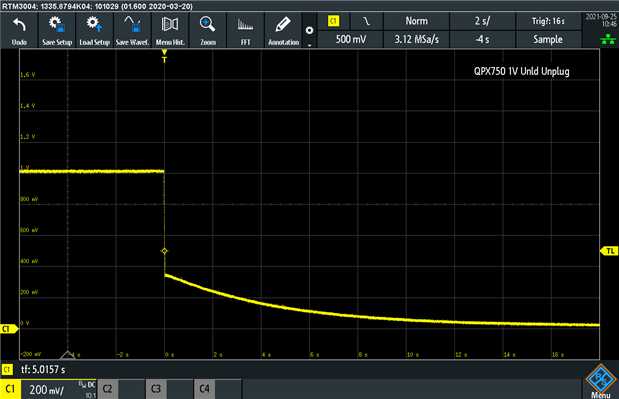
Surprising the supply by yanking the power cord results in the same behaviour. Attempting something a little more extreme, I set the output to just 1V and repeated the surprise unplug. The result was steady regulation followed by a sharp drop in voltage, then a slow decay. This is an excellent result as it means the load should be safe regardless of unexpected power outage.
Load-Step Transient Response
Various 0 to 30A load steps were generated by the electronic load at different slew rates and repetition rates to assess the performance of the QPX750SP while it sourced 4.5V. Most tests were done with a 50% duty cycle at a repetition rate of 5Hz for plotting convenience.
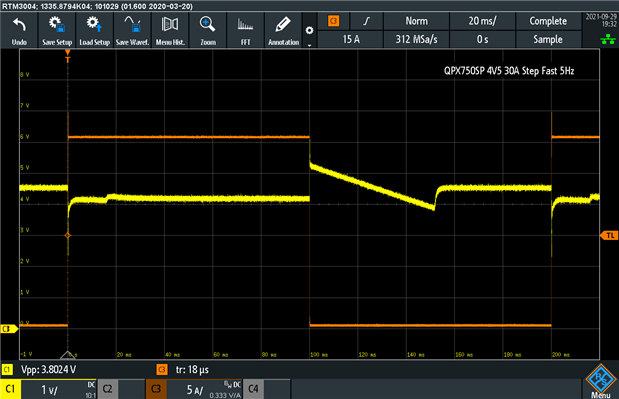

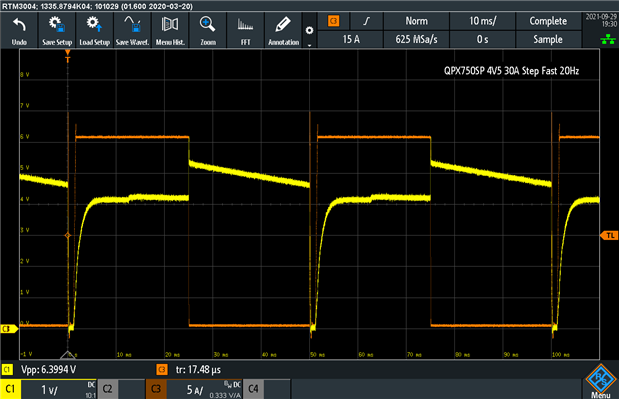
At the fastest slew rates with a rise time of 18 and 241µs, it was possible to provoke some rather severe deviations in voltage. At 18µs, peak-to-peak deviation reached 3.8V and it seemed clear that the voltage dipped significantly on the onset of the load before recovering to a value that was about 400mV below. On unloading, the voltage flew up to about 6V before declining slowly in a linear fashion (perhaps unregulated) before being boosted back up after crossing 4V. This regulation behaviour seemed rather lax, so I did repeat the test changing between two-wire, four-wire, front and back terminals but the results were almost indistinguishable. This may not be unexpected, as such fast transitions have bought other power supplies to their knees at times. Given the 2ms transient response rating, these transitions may have been too fast for the supply to handle quickly, but the recovery was not as “tight” as I would have expected.
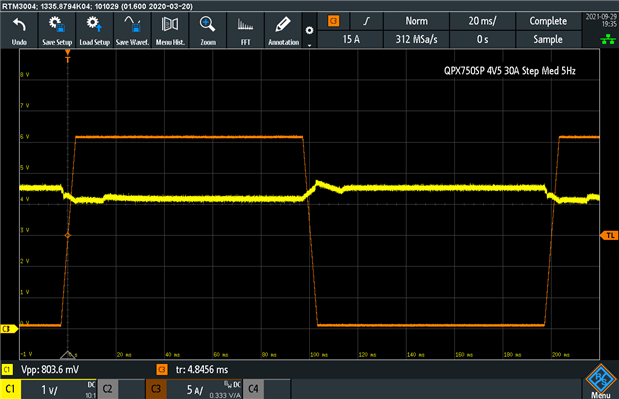

At a more reasonable 5ms and 38ms rise time, the results were a bit more favourable. At 5ms, the measured peak-to-peak deviation was registered as 803.6mV (18%), reducing to 744.8mV (17%) at 38ms. Part of this may be exaggerated due to noise as no bandwidth limiter was used and by offset in baseline voltage as noted before.
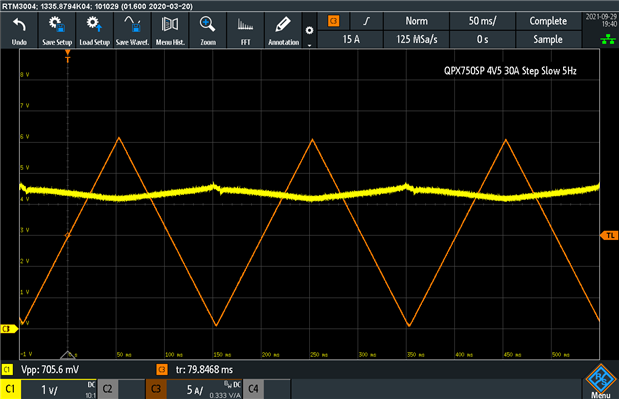
Even at leisurely 80ms which resembles a triangular wave load pattern, the peak-to-peak deviation was 705.6mV (16%), although most of this would be noise and baseline wander. Perhaps if I were to limit the bandwidth and use averaging, a clearer picture would emerge, but the baseline wander would still remain in the measurement – perhaps a slower step rate would improve results further in that regard but real-life loads can be unpredictable.
I did try a faster step rate just out of personal interest – it seems that at 20Hz, it is possible to observe the output collapsing to zero for 2ms as the load step hits while the supply is waiting for its overshoot to come down naturally, but in that situation, it recovers back to 4V in about 4ms. This may not be entirely unexpected, but I would suspect that under a 50A load, the behaviour may be even more severe. Loads which have low capacitance and are hard-keyed (e.g. PWM) may cause cyclic voltage overshoot and brown-outs depending on their frequency and current.
For comparison, I decided to test a decidedly low-end switching power supply – my Manson HCS3102 1-36V/0-5A power supply. This unit is cheap but perhaps only good for “bulk” power supply as it isn’t all that sophisticated nor accurate with regard to programming and read-back, and its protections are rather dubious. But with its output set to 4.5V and given a 0-5A load step at the same rate, it actually fares better. How unexpected!
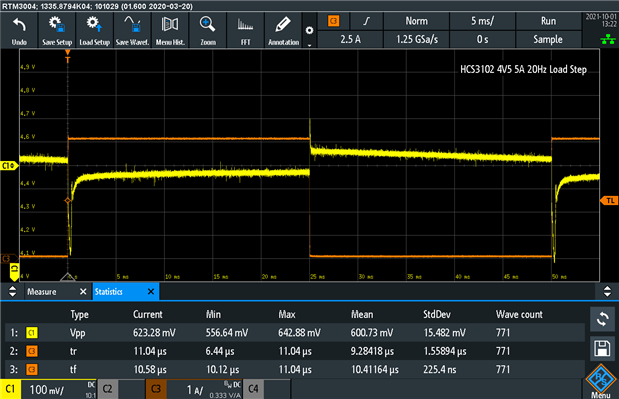
The output does not collapse to zero – in fact, it averages a peak-to-peak deviation of approximately 601mV which is better than the QPX750SP and recovers in about 2ms. Of course, this is an apples-and-oranges comparison as the HCS3102 is a lot smaller in terms of its voltage range and current delivery capacity, but it is being tested at 100% of its rated current and still manages this performance. In light of this, I think the QPX750SP’s load transient performance is perhaps only adequate for a general-purpose power supply with room for improvement.
Constant Current Overshoot
Testing of constant current overshoot was performed to determine how quickly the power supply transitions between constant voltage and constant current operation. This was first performed using the load-step waveform with the load to sink a current greater than the current limit setting on the QPX750SP. The Imonitor output and voltage were observed on the oscilloscope.
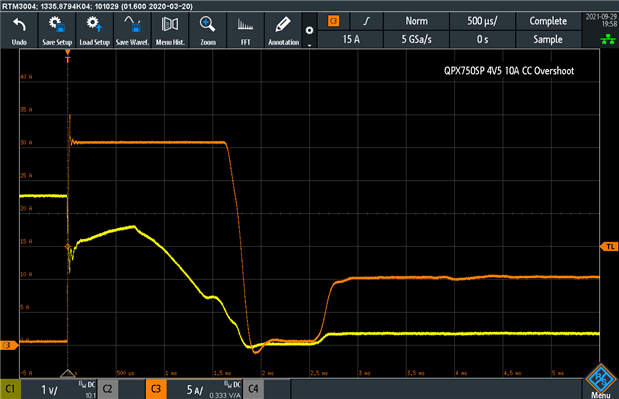
With the load only capable of sinking 30A, I set the QPX750SP to a 10A limit. In that case, it actually delivered 30A for about 1.8ms before collapsing the output to zero and then recovering to 10A at 2.75ms after the onset of the load step. This behaviour shows quite lax regulation abilities which could contribute to immediate destruction of sensitive semiconductors if the current limiter is relied on as the sole protection.
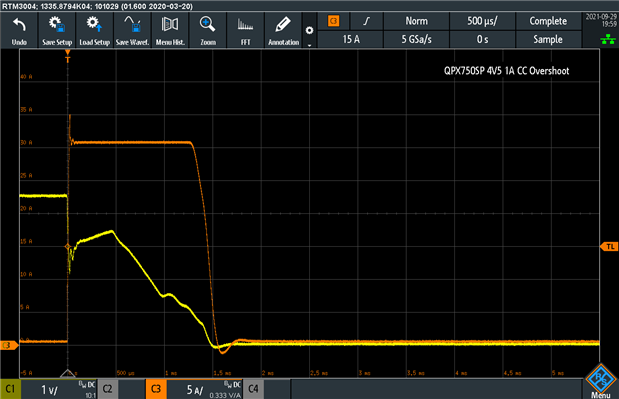
The second graph shows the result of reducing the limit on the QPX750SP to 1A. This reduces the overshoot time to about 1.6ms, but the current still reached 30A.
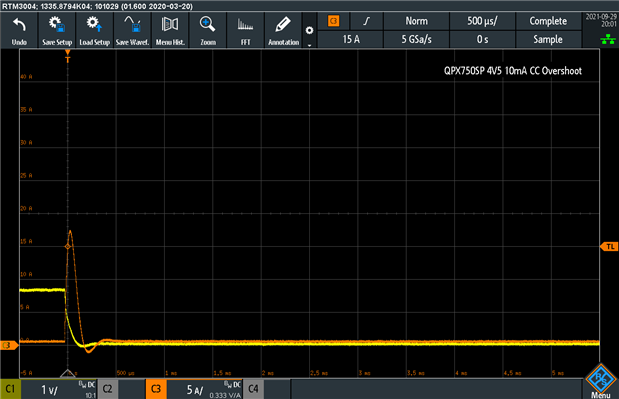
Setting the limiter on the QPX750SP to just 10mA still resulted in an instantaneous current overshoot reaching 17.5A but lasting only about 200µs which may be due to the action of the output capacitors. As a result, it reminds us that it is important we choose a power supply that suits our intended use scenario – there’s no reason to have such a powerful beast to drive relatively small and delicate electronics as it is very difficult to ensure good control across the full operating range.
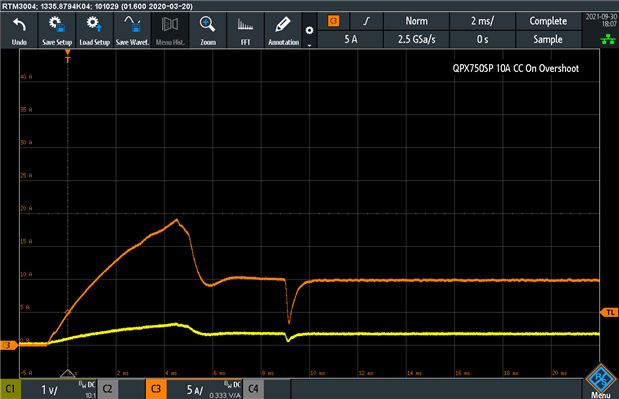
I also decided to see whether this overshoot behaviour persists on channel power-up, as the voltage ramps up slowly, my expectation was that it would behave better. Indeed, the overshoot is smaller – reaching about 19A, but it is still significant.
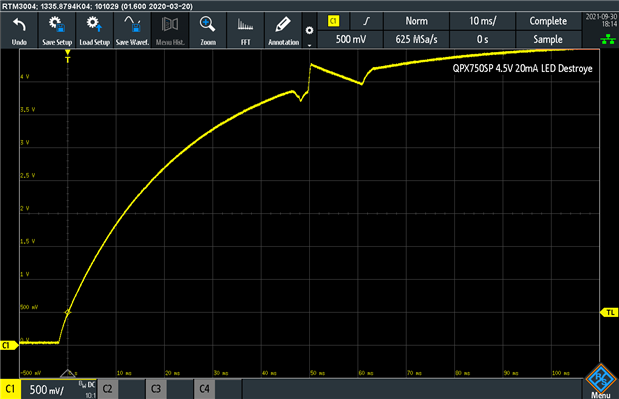
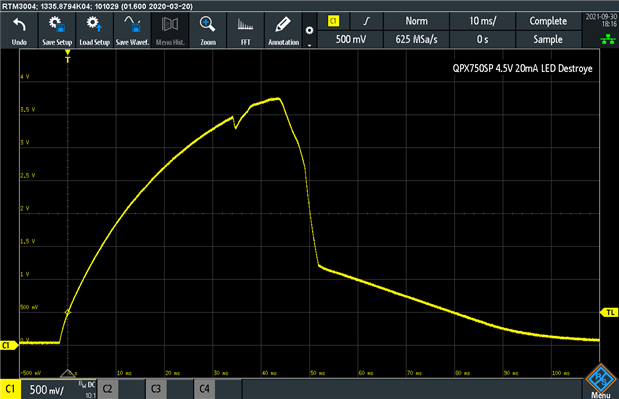
Regardless of my suspicions, I subjected the QPX750SP to my ultimate test – driving a 5mm LED at 20mA directly. Unsurprisingly with the output set to 4.5V at 20mA limit, it blew the LED every time as the regulation loop could not react quickly enough.
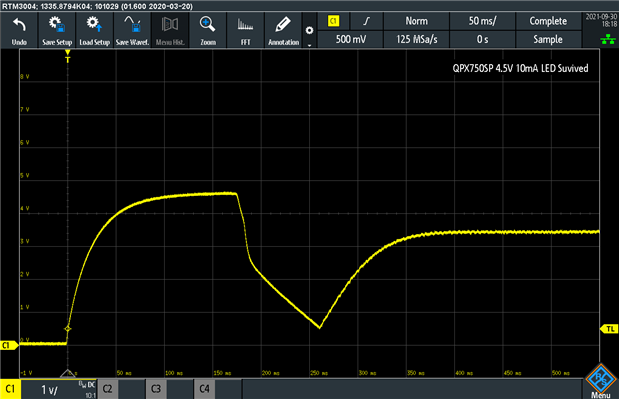
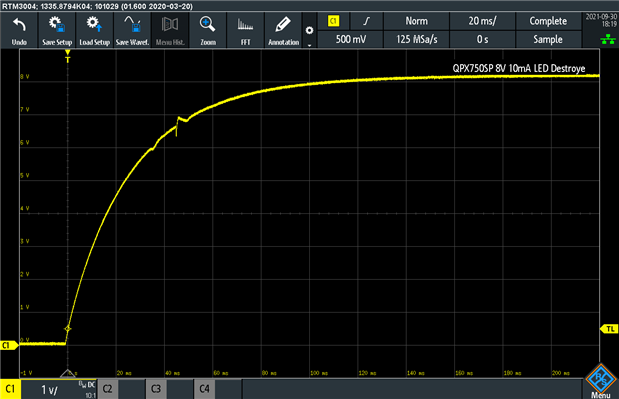
Being more restrictive and setting the current limit to 10mA, perhaps I got a hardier LED, but this one survived despite being run “constant voltage” for close to 175ms. Pushing the set-point voltage up to 8V managed to destroy the LED again … it’s just not quick enough to handle delicate semiconductors in overshoot-critical situations.
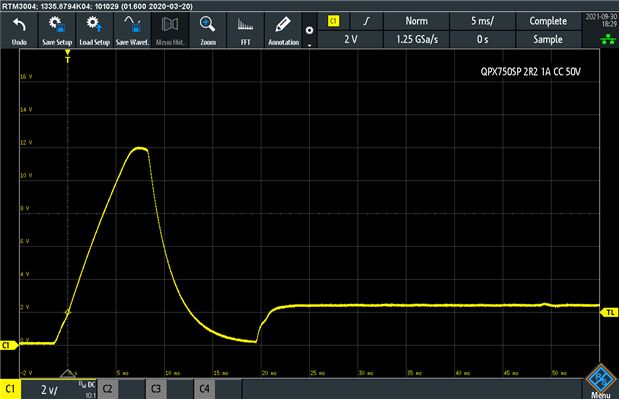
But perhaps I’m being unfair … so let’s give this another shot with a 2.2Ω 5W wire-wound resistor. I set the constant current limit to 1A and the voltage to the maximum 50V in the SELV range and observed the output. This time, it hit 12V before being cut off and reaching the operating point of 2.2V at about 23ms. For about 12ms, it was operating at a higher current than desired, peaking at 5.46A when 1A was selected. Because of the inductive and resistive nature of the wire-wound resistor, the overshoot recorded is smaller than in the semiconductor case, but it is still significant. Luckily, wire-wounds are quite hardy and the short burst at 65W didn’t destroy it, but for less hardy components, the supply’s behaviour could contribute to unexpected damage due to short term instantaneous current excursions.
Overvoltage and Overcurrent Protections
Overvoltage protection (OVP) was assessed by having the supply set to 4.5V, 20A and being kept at constant current by the load. The OCP voltage was set to 3V and load was then removed, resulting in an OVP trip which would be recorded by the oscilloscope.
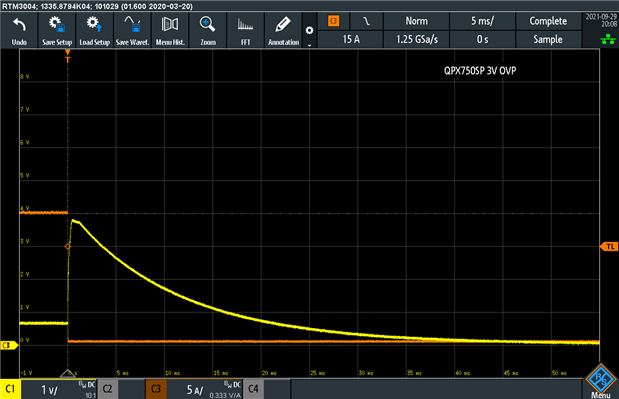
It seems OVP is very fast with this unit – the voltage does exceed the 3V OVP setting for about 4ms but does not make it to 4V. It is hard to see when the output is cut off simply by observing the output voltage as the capacitors take some time to discharge. The datasheet states a typical time of 100µs, however, in our case, it is not possible to validate this given the slow changing output voltage.
Overcurrent protection (OCP) was assessed by having the supply set to 4.5V, 20A with the load drawing nothing initially. The OCP threshold was set to 15A and then the load was activated to generate an OCP trip recorded by the oscilloscope.

In this case, it seems the OCP behaviour is slow and inconsistent. In fact, the supply does spend about 4ms serving 30A into the load (its maximum limit) before kicking into 20A constant current (as set on the screen). This continued until about 204ms before OCP tripped. This is quite a bit longer than the 100ms typical value given in the datasheet.
In both cases, once an OVP or OCP trip occurs, the output is turned off and the fault is displayed on screen and latched until the “ESC” key is pushed to clear it.
Ripple and Noise Measurement
A single-point ripple and noise measurement was made using 10:1 probes, at a 20MHz bandwidth filter, while sourcing 4.5V in constant voltage mode at 30A into the electronic load as this approximates the maximum power the load is capable of sinking. In most cases, ripple is more dependent on the current provided to the load, which is why I prioritised using the full 30A the load is capable of.
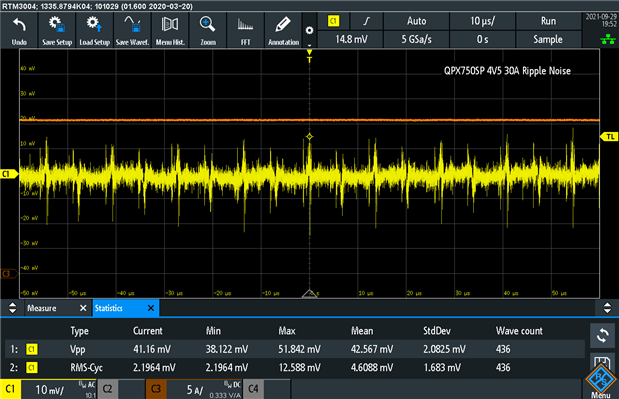
The measurements show a mean of 42.567mV peak-to-peak and 4.6088mV RMS. This is somewhat worse than the stated 20mV peak-to-peak and 3mV RMS, however, I would be willing to give them the benefit of the doubt as it seems likely that the set-up may have picked up noise induced by the load and other nearby equipment which may have affected the result somewhat. The values still seem close-enough for the most part.
Standby Power Consumption
Standby power consumption was measured with the PWRVIEW software to ISO/IEC 62301 protocol using a pure-sine-wave inverter source trimmed with a variac to within 1% of 230V.
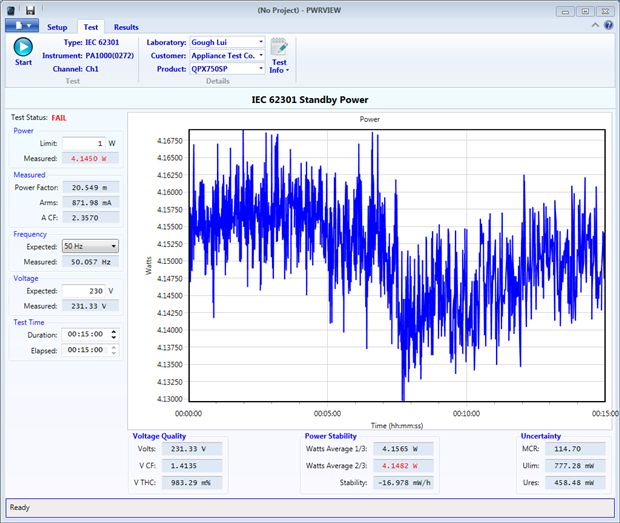
With the front panel switch in the off position, the measured standby power was approximately 4.145W. This is not an insignificant amount of standby consumption, as ordinary electronic appliances may be required by regional laws to have standby consumption below 1W or 0.5W. This seems to be an area where the QPX750SP could improve upon.
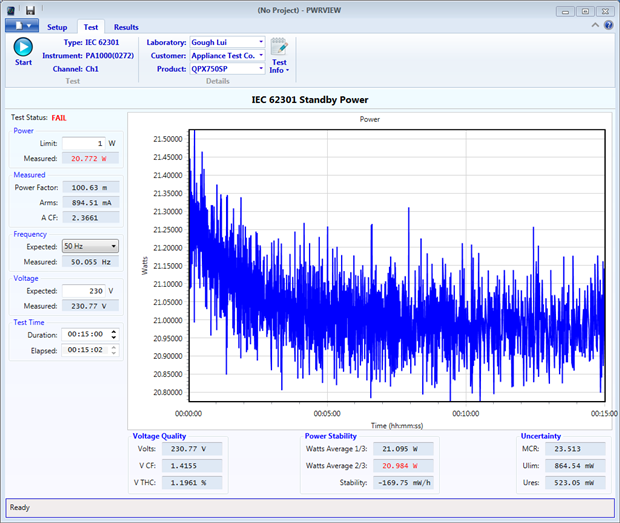
If the unit is allowed to power up and idle with the output switched off, the power consumption is significantly higher, reading about 20.772W. This quiescent power draw is higher than most products I have encountered, but perhaps is not unusual considering the power range of the power supply. This may be in part due to, but also explain the cause of, the cooling fan running constantly at an audible volume even when not servicing a load as there is some power being dissipated internally.
Output Quiescent Current Draw
I recently made a post about the fact that inputs and outputs on test equipment may not behave the way you expect when they are commanded off as they can still be drawing current. To ascertain the QPX750SP’s tendencies, I performed an I-V curve sweep across the full voltage range using the KickStart 2 software.
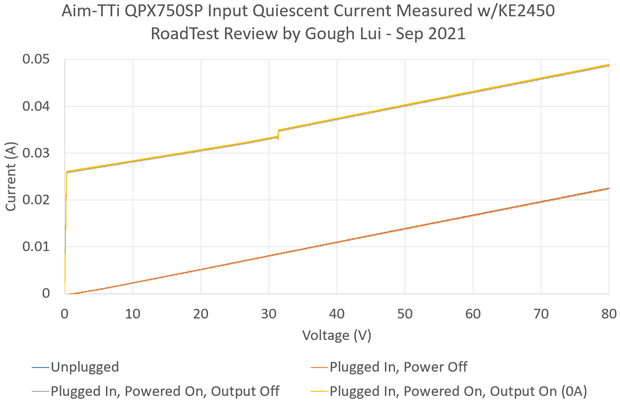
When the instrument is unpowered or plugged in with the power switched to off, the quiescent current draw of the outputs appears to be ohmic. Once powered on, the draw increases by 26mA and has a slight discontinuity around 31V, perhaps representing an “active load” to increase the speed of down-programming and ensure operating stability at very low currents. This persists even if the output is switched on with a current of 0A requested. This finding suggests that it is probably unwise to connect energy sources (e.g. batteries) to the output and expect them not to be slowly discharged, but is not uncommon amongst general purpose power supplies, especially those without relay isolated outputs such as this unit.
Constant Voltage Load Efficiency
Testing of power supply efficiency under constant voltage operation was performed up to a power envelope of 80V/30A/150W which represents the common operating range of the test equipment.
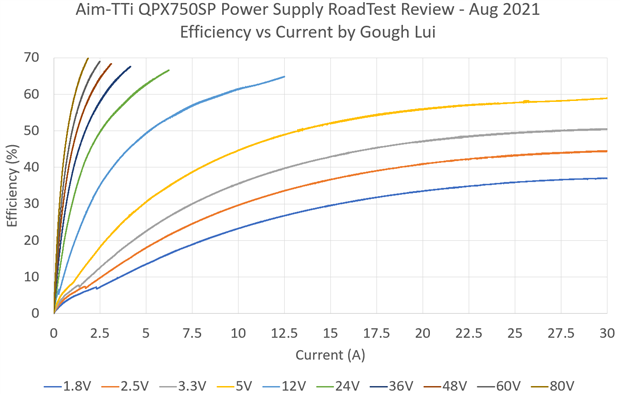

Within the envelope, the supply reached a peak efficiency of 70%. This is not unexpected as a high quiescent draw was already noted in the standby power tests, and using power supplies at just a small fraction of their load (150W = 20%) usually results in poor efficiency figures. As expected, higher output voltages resulted in greater efficiencies, although there is a slight discontinuity at the low-end of the power curves suggesting that the supply may be changing operating regime depending on the power/current load. This may be related to an internal LED which toggles to red at light loads and changes to green when loaded sufficiently.
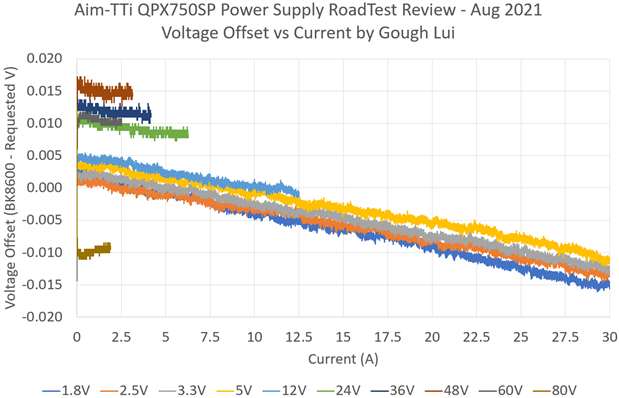
Under this test regime, the voltage at the output measured with four-wire sensing showed deviations of about 15mV, which is a bit more than the 0.01% + 5mV specification which would imply 5.5mV would be expected. Perhaps the subtle difference may be due to the electric field distribution on the terminal of the power supply itself.
Conclusion
Putting the QPX750SP through a number of tests proved quite revealing with regards to instrument capabilities and shortcomings. Programming and readback accuracy for both voltage and current were excellent across the full range, comfortably beating the datasheet specifications. Channel power-up to 40V unloaded was a bit leisurely with a rise tome close to 70ms, while power-down was a little quicker at closer to 67ms. If power was turned off to the instrument via the front-panel power switch or by unexpected power removal, no unregulated “spike” was recorded, indicating the load would be safe but the voltage did not fall as quickly, instead being bled off slowly over around 10s.
Transient performance of the QPX750SP was a bit difficult to judge as the recorded signal showed significant baseline shift under load which could be related to electrical field distribution on the terminals and fast-changing transients not providing enough time for the regulation to “settle”. Regardless, the results demonstrated that fast transients with rise times of 18 and 241µs were able to provoke sharp dips and overshoots in the voltage due to the performance of the regulation loop. Slower rise times in the >5ms range showed more favourable performance, as expected of the 2ms transient response specification, but the deviations were still noticeable reaching 803.6mV peak-to-peak (18%) inclusive of baseline shift. Higher-frequency load pulse trains resulted in behaviour which included collapsing the rail to zero entirely as the load comes on while the supply is recovering from an overshoot. While this did not provoke an instrument error, this behaviour is not ideal and could arise when running hard-switched loads (e.g. PWM).
Testing for overshoot similarly showed the QPX750SP could make some improvements, as the supply often did have significant levels of overshoot in spite of the setting of the current limiter due to the regulation loop speed. This can result in 1-2ms of significant overshoot, reaching 30A (load maximum) when a setting of 1A was engaged. Using the most sensitive test, I tried to run a 5mm LED directly from the outputs, set to 4.5V/20mA and it was able to destroy the LED every time. Choosing a more conservative 10mA setting allowed one LED to survive, but perhaps that was due to its hardiness as it reached 4.5V (constant voltage) for about 175ms before regulating into constant current. I would not recommend relying on the current limiter on the QPX750SP to provide protection for sensitive semiconductors where overshoot could compromise device reliability or cause immediate destruction. However, as a general-purpose power supply, this level of performance may be sufficient and without having any point-of-reference for a power supply in this power class, I cannot be sure how its performance compares to its peers.
Overvoltage protection operated quickly, although the actual time to trigger was obscured by the output capacitor discharge time. Overcurrent protection was a bit slower, however, in my test case requiring about 204ms to trip.
A single ripple and noise measurement at 4.5V/30A was made, resulting in 42.6mV peak-to-peak and 4.6mV RMS measured. This is more than the datasheet specification of 20mV peak-to-peak and 3mV RMS, however, is close enough to be plausible as my testing may have other sources of noise inducted into the measurement or from the load.
Standby power consumption of the unit in the off state was relatively high at 4.145W and with the unit powered on and the channel switched off, this reached 20.772W. This is definitely an area which could be improved and may explain why the cooling fan runs audibly even when the unit is not under any load. Constant-voltage tests of efficiency under loads up to 150W saw a peak efficiency of about 70%, likely in part to the high quiescent consumption, although better efficiency is expected as load increases.
---
This chapter is a part of the Aim-TTi QPX750SP 750W PowerFlex Programmable DC Power Supply RoadTest Review. More detailed chapters are linked from within the main review.
