


Now that I’ve had my 2450 SMU serviced, returning with a fresh calibration, the first thing I thought I’d do was to check the calibration of the 2450 SMU against my suite of instruments - or more accurately, check the calibration of my instruments against the 2450 SMU. As the SMU is a precision instrument with very tight programming and read-back accuracy specifications, it is capable of generating very precise voltages and currents. While you can’t “calibrate” instruments against other instruments of a similar accuracy, but it is possible to at least verify to some level of confidence whether the instruments agree or disagree within their specified error margins (for the values of inputs that the SMU can generate), which is what I have done. After all, with most instruments, the first 90-days after calibration usually provide the best accuracy so I wasn’t going to waste any time.
This process was a strenuous one as it involved remote commanding of the SMU to step through the output, often at the minimum programming resolution on a given range, to gather the maximum amount of data. As my other instruments are usually less accurate than the SMU, I decided to take the average of eight readings from all other instruments, compared to a single 10PLC reading from the SMU. This would reduce the influence of noise on the readings on my other instruments, so I can better identify the underlying reading error trends. This test process took about a month and a half of 24/7 operation to complete for the listed instruments, many of which I use to review and RoadTest items, so ascertaining their accuracy would provide reassurance of my findings. The 2450 SMU proved to be dependable, surviving the gruelling test without any complaints except for some loud fan noise especially on the 1A range, worst when operating about 400-600mA of load with a warning of high heatsink temperature especially when ambient temperature reached 28-30°C as we approach summer in Australia. The data analysis took several hours of keying in range-specific error formulas for each instrument and producing charts.
Checking the Calibration with a Keithley 2110 DMM (2013)
The first step was to check the unit using my “trusty” Keithley Model 2110 5.5-digit DMM which was awarded in a RoadTest back in 2013 and has not been calibrated since manufacture. This is the same unit that was used in the original Keithley 2450 Instrument Performance Tests blog where we found that there was a bit of an offset with the 2110 towards the high end of each range, but it is still seemingly within specifications and in agreement for the most part. After calibration, I think it would be good to verify this to be the case – noting that in this case, a 10PLC reading from the SMU is used for (hopefully) higher accuracy.
Voltage Programming Accuracy
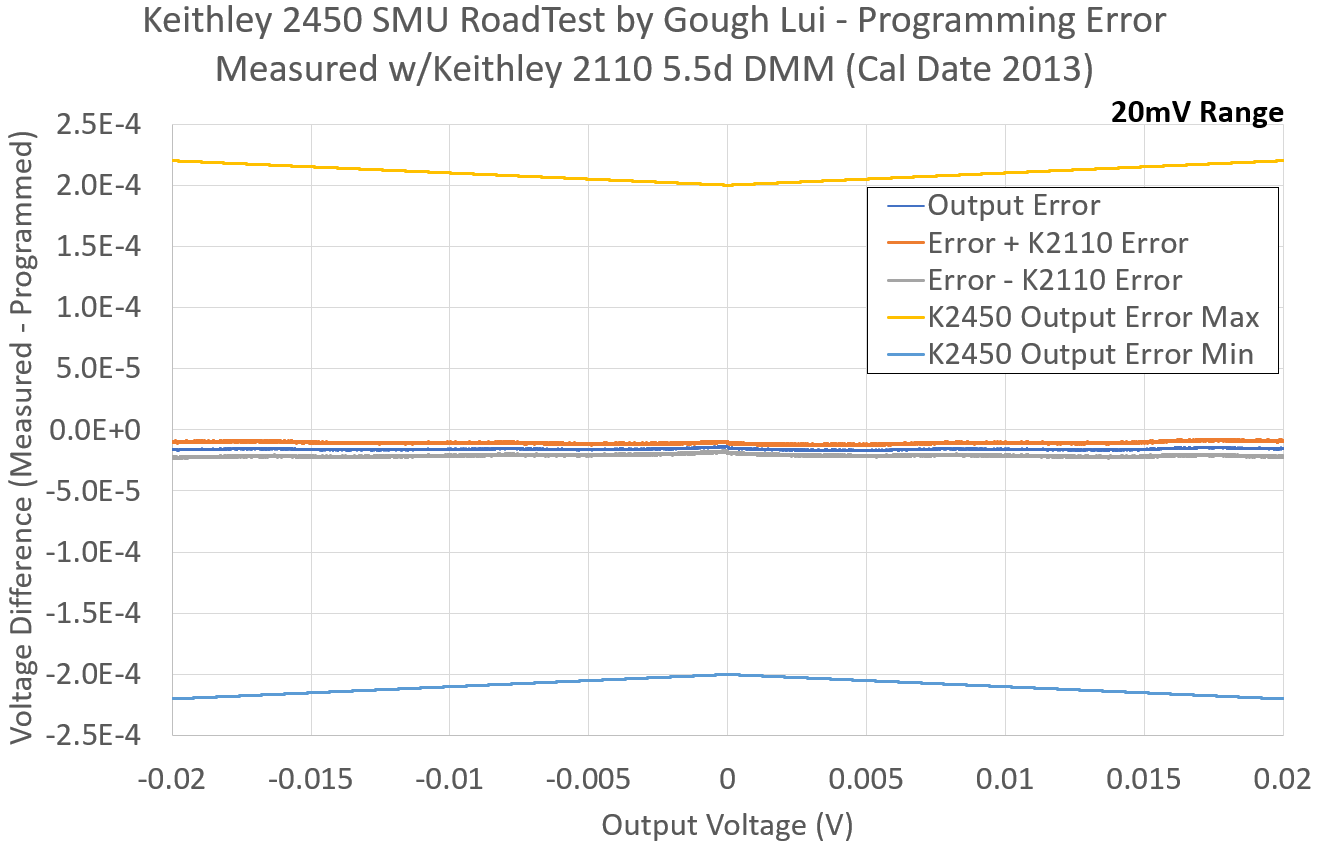
In the 20mV range, the 2110’s readings are again relatively flat and well within the 2450’s error margins. The reading is offset down in the same way, which is likely due to thermal EMF contributions (as the test leads were not anything special, although the temperature difference should have been rather small).
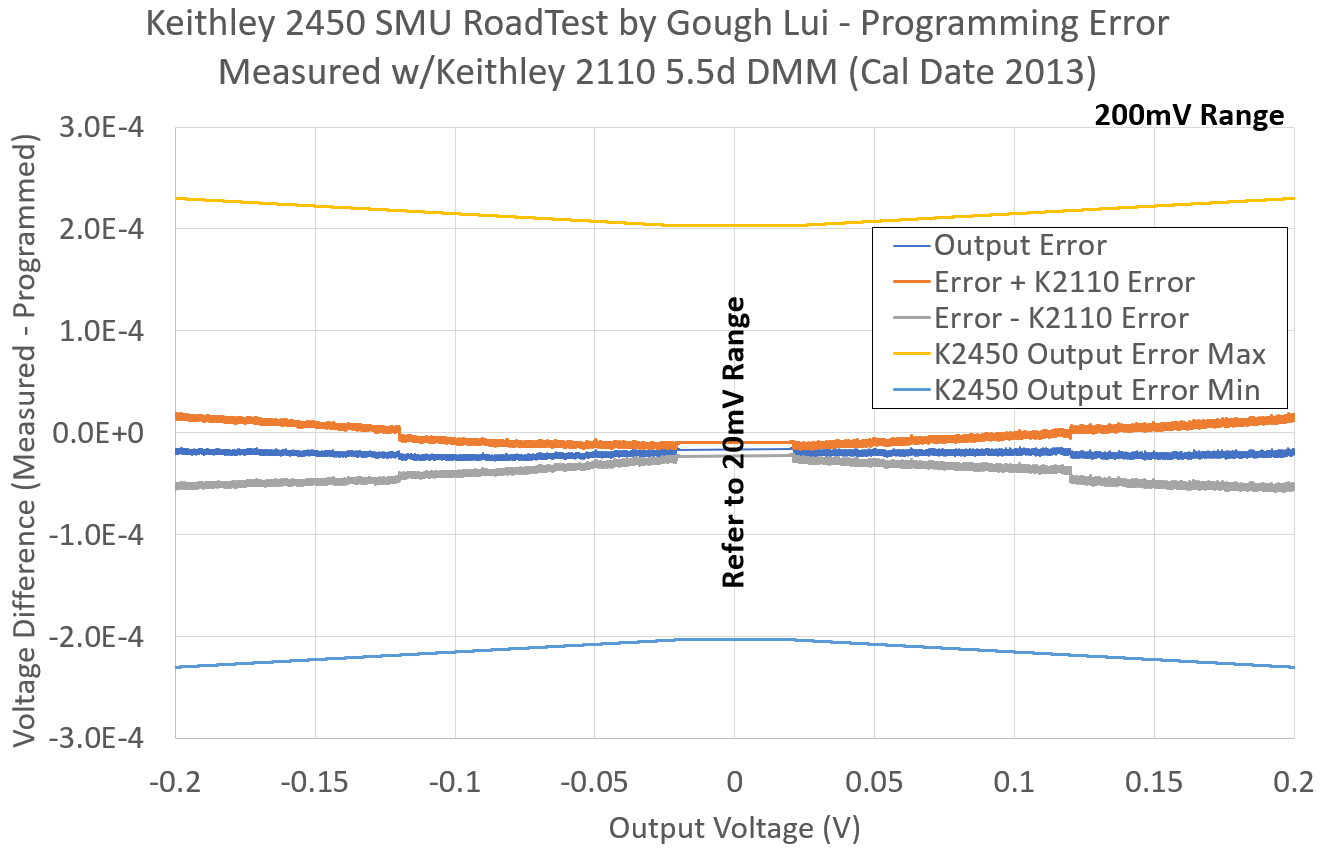
In the 200mV range, under this test, the readings are again well within the output error expected from the 2450, although the 2110 again shows a small offset. So far, the instruments are in agreement, at least to the extent of their claimed levels of accuracy.
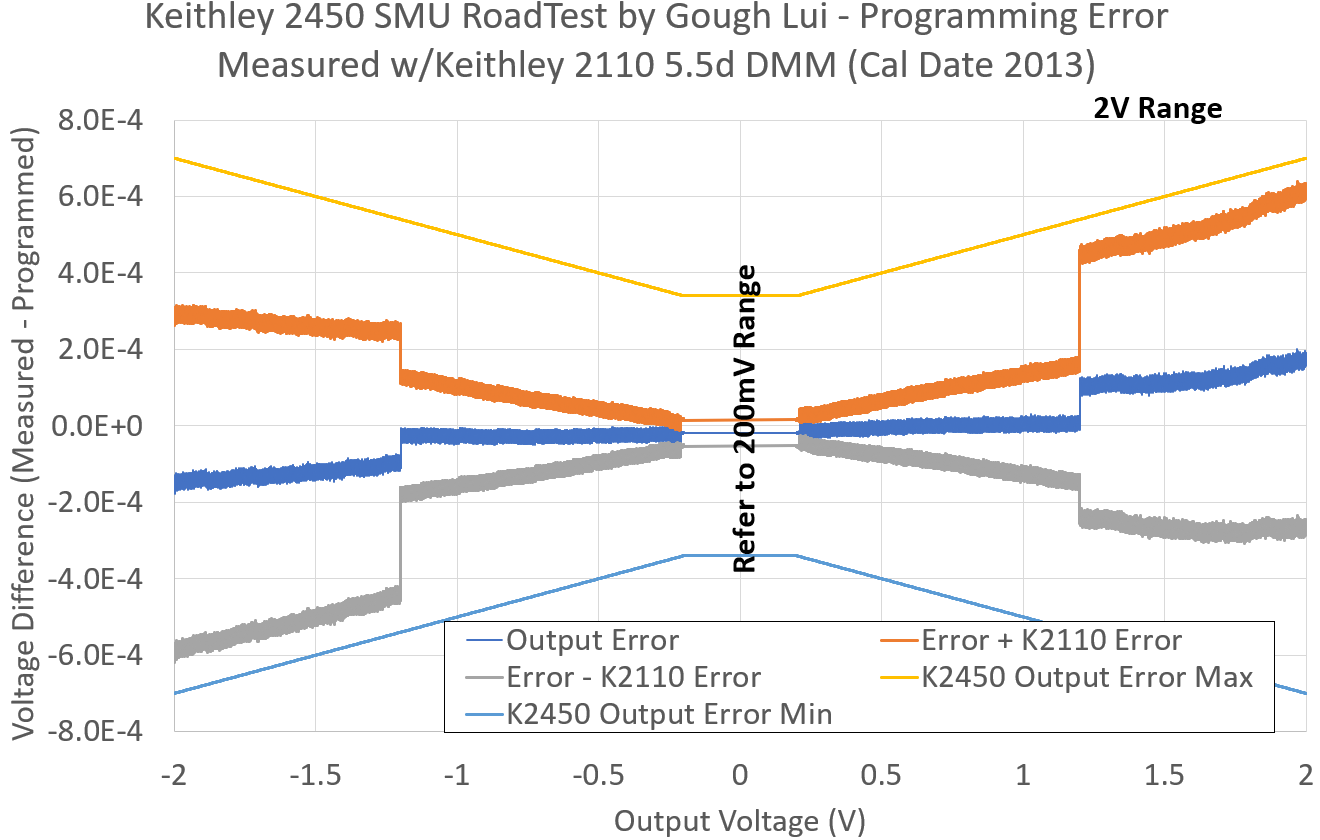
Stepping up to the 2V range, this time, the gain error “slope” is less pronounced compared to the previous test, but when considering the claimed accuracies for both instruments, this shows both to be within specification.
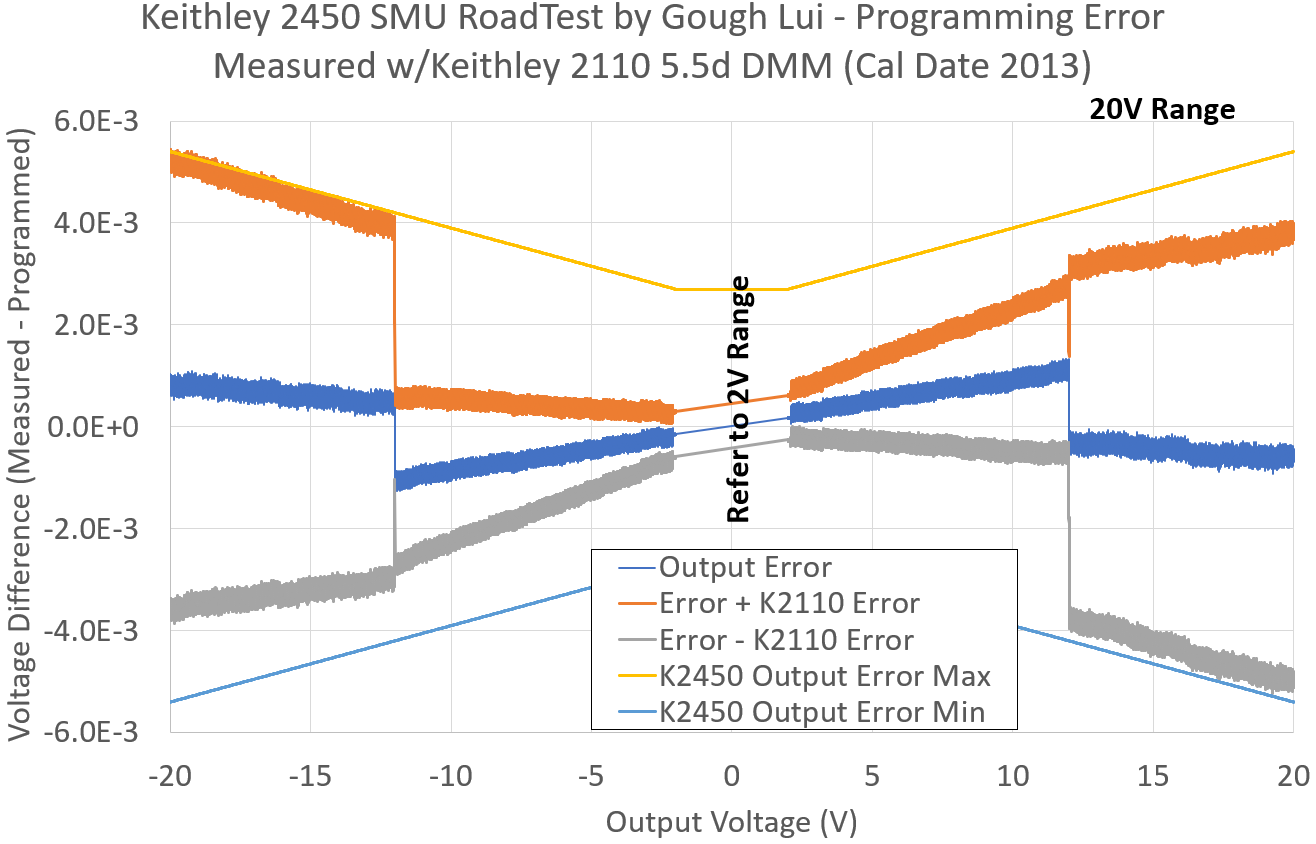
At 20V, a carbon-copy of the previous result is seen, although the negative portion upper error limit lines are now just about touching. This is not a major issue, as this still provides confidence both instruments are within their claimed accuracy. Perhaps while the 2110 may have passed its initial calibration, it may not have been as “close” to zero for error as it could have possibly been.
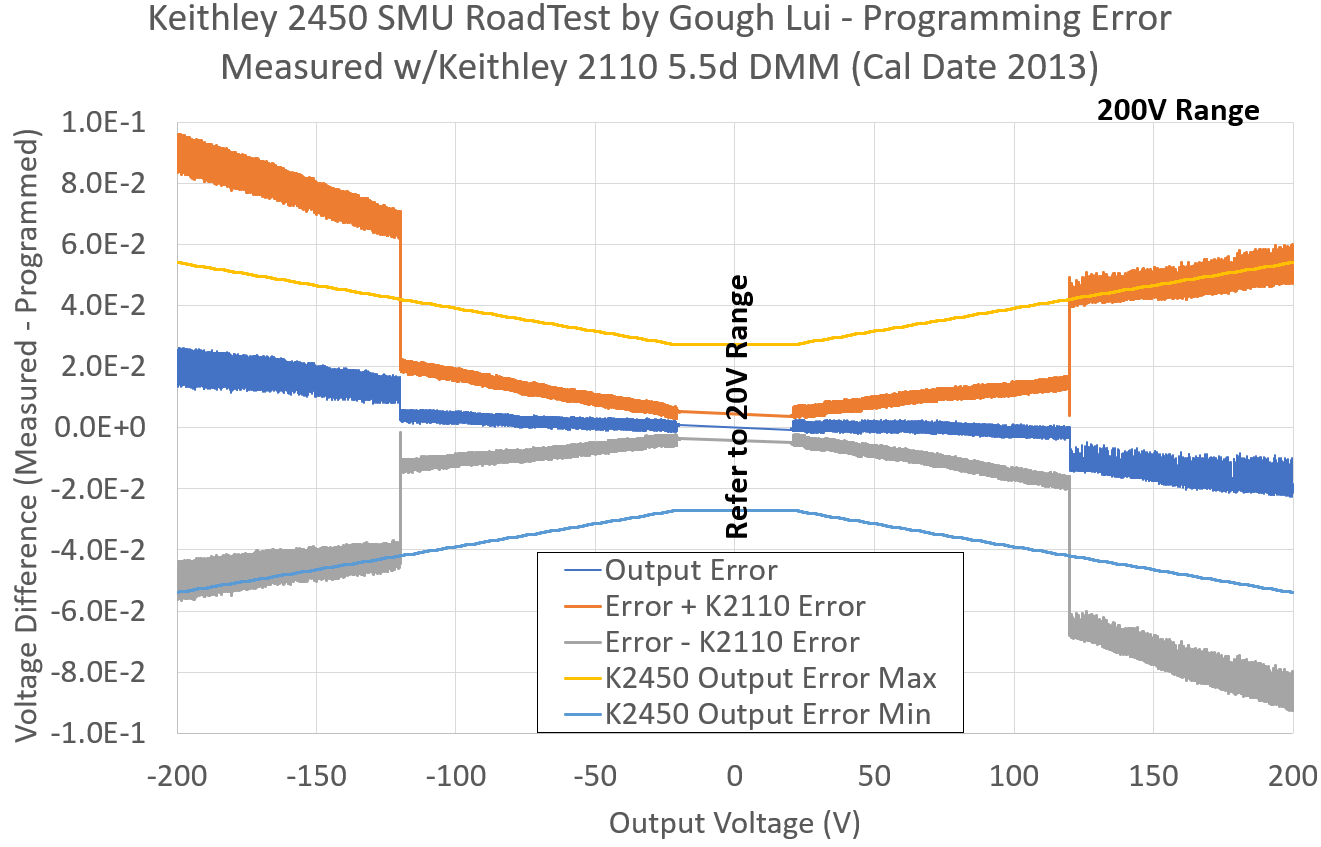
In the 200V range, the 2110 doesn’t have the accuracy to fit within the 2450’s programming accuracy error margins above +/-120V, but as most of their area overlaps, we have good confidence the unit is still very likely in-spec. Between 20 and 120V, the result shows good agreement.
On the whole, the check of voltage programming accuracy shows the same trends pre and post-repair, which if anything, perhaps tells me the 2110 has maintained its calibration and the 2450 was in-spec post repair (perhaps no adjustment necessary).
Combined Voltage Programming & Readback Accuracy
Combined programming and readback accuracy tests are performed with the 2450 generating an output and measuring that back, so are an accumulation of both programming and readback error.
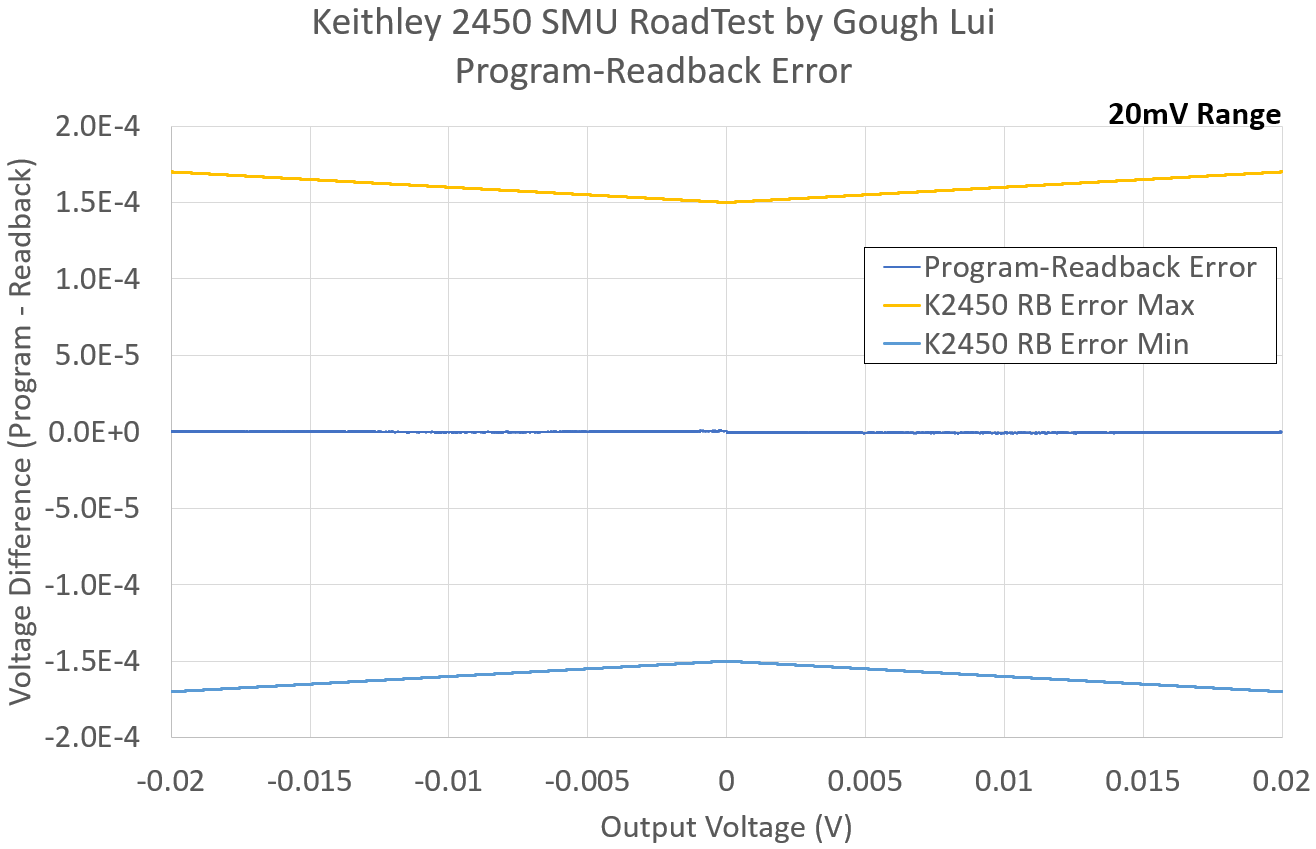
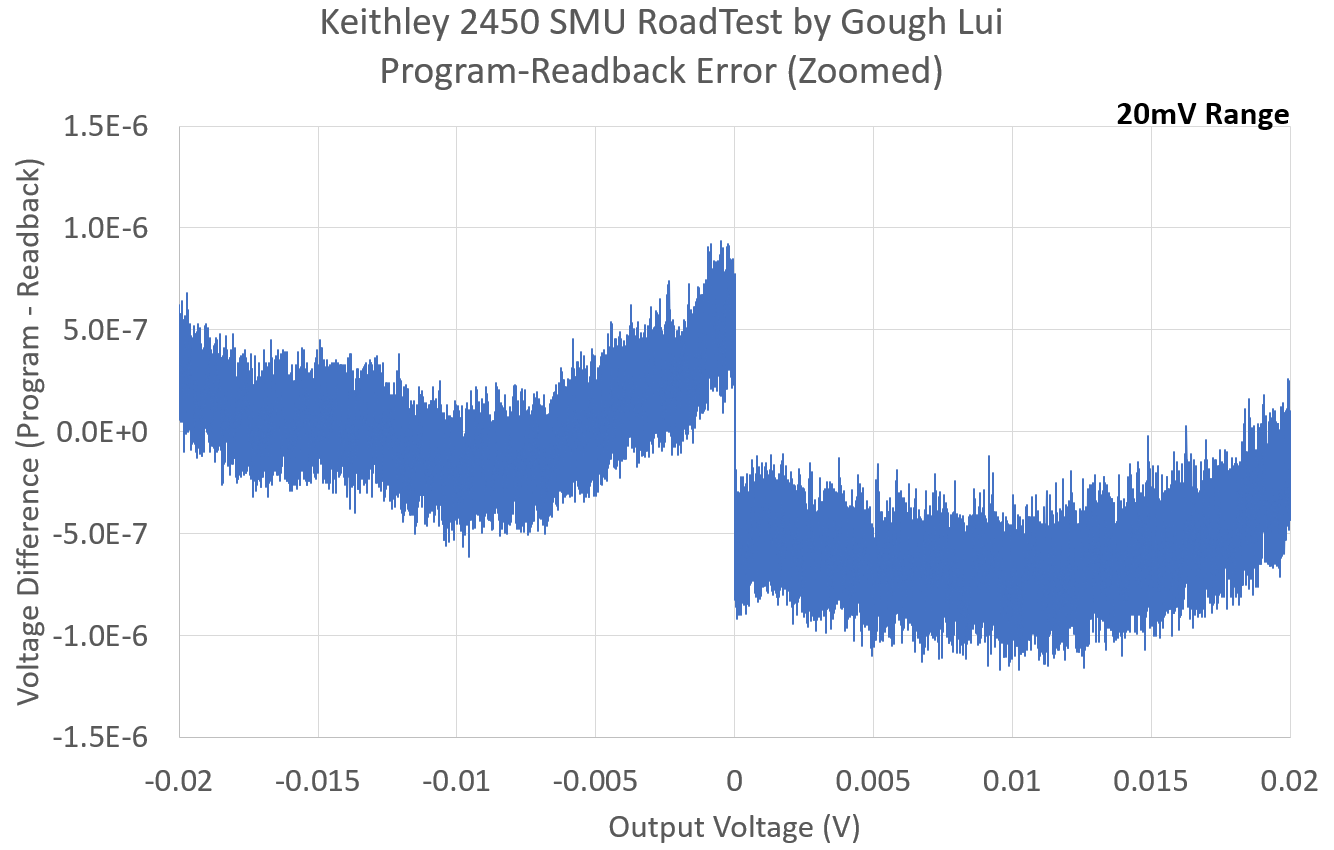
The 20mV range shows very small levels of error, with the errors within about 1.2uV. The reduced spikiness compared to previous tests may be due to the “averaging” effect of 10PLC measurement.
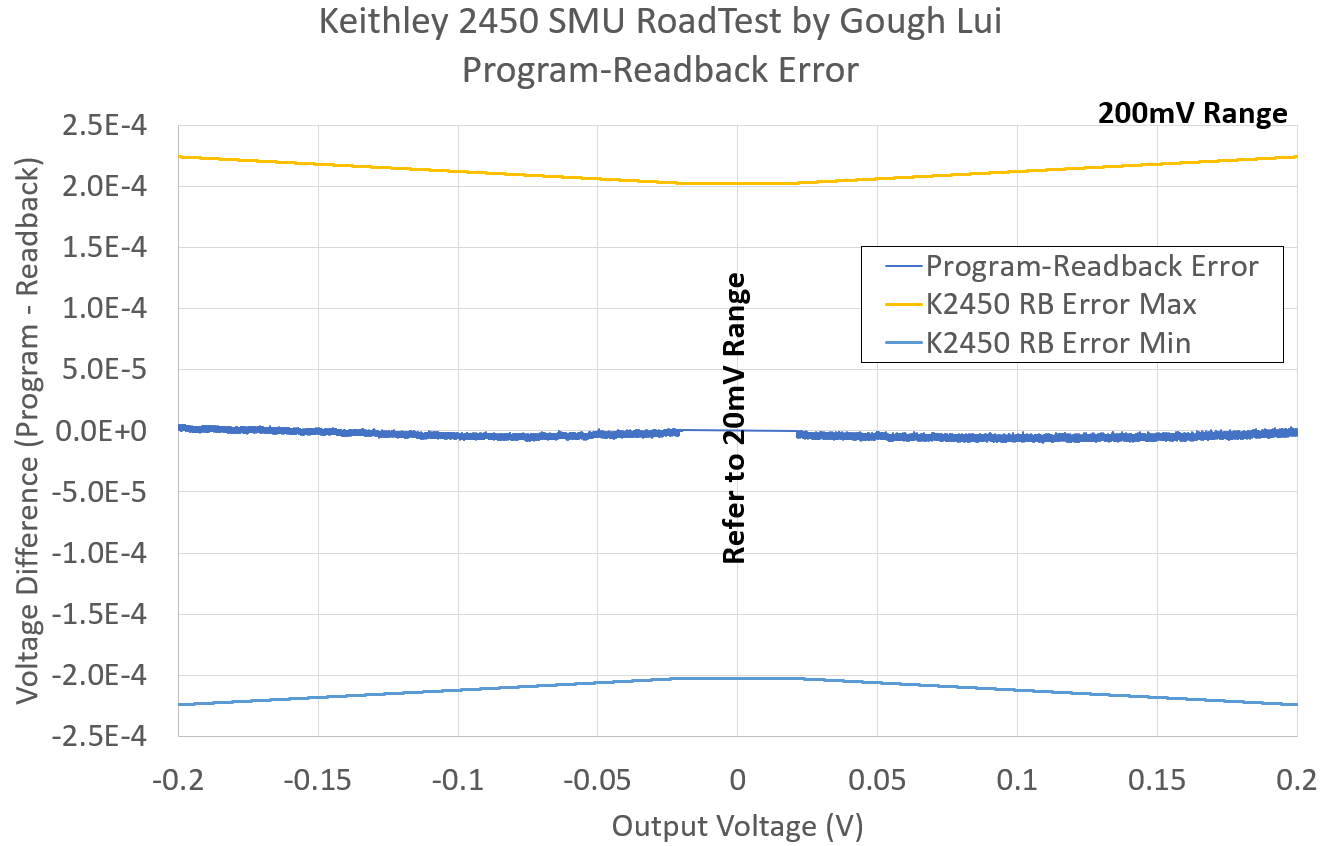
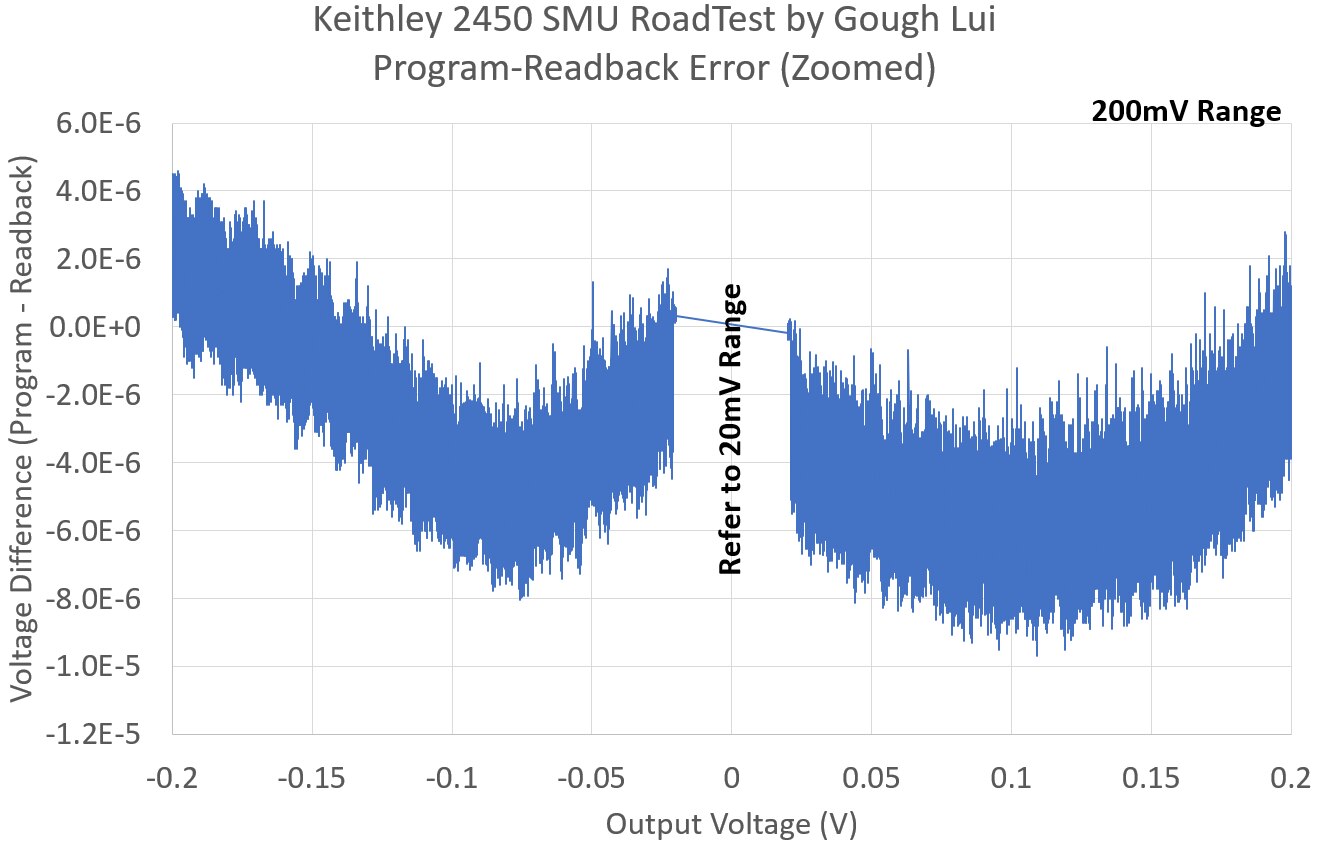
The 200mV range is well within the expected error with a slight curve to it just as before. Error is within about 10uV. The previous curve exhibited a small bump while this curve is more smooth – perhaps this is the effect of thermal changes in the test room.
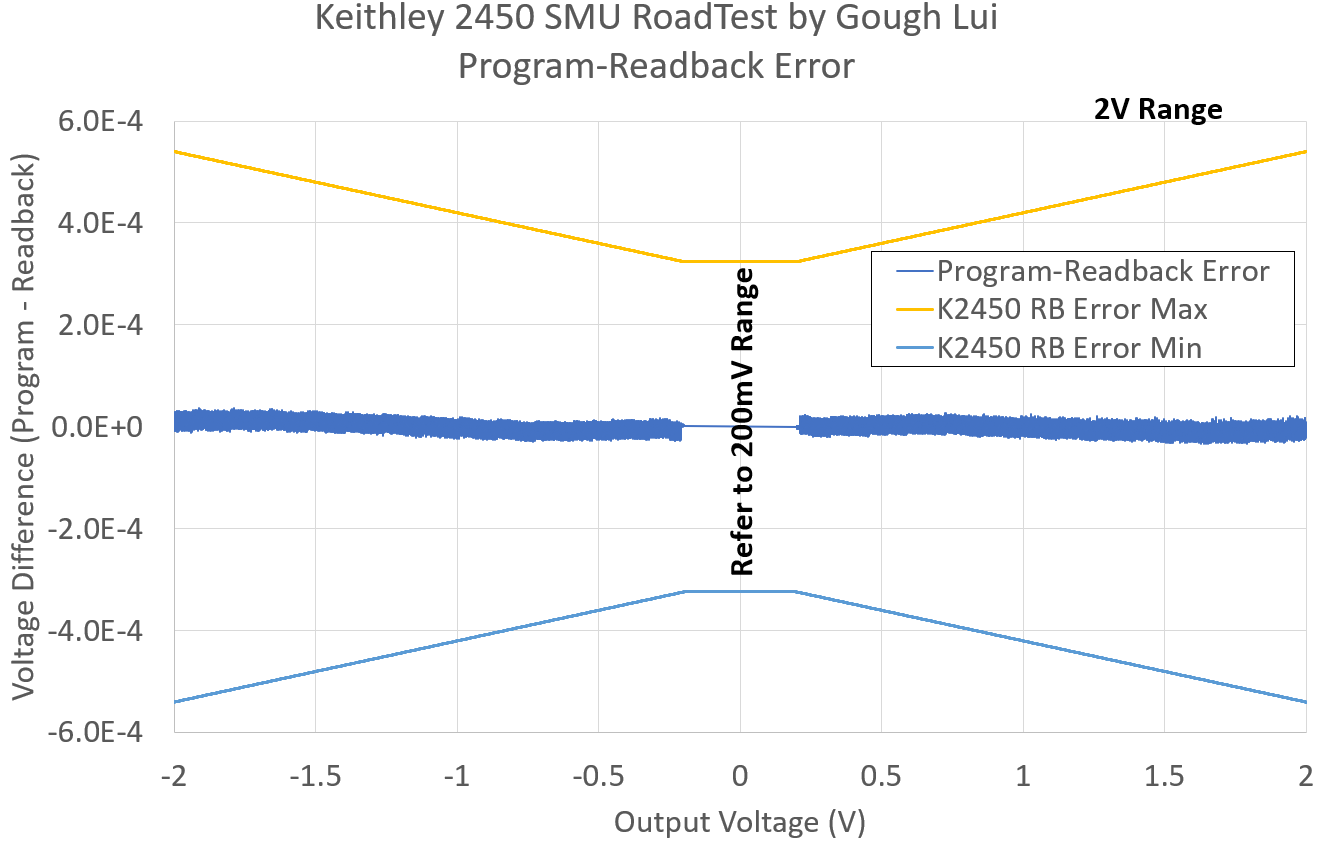
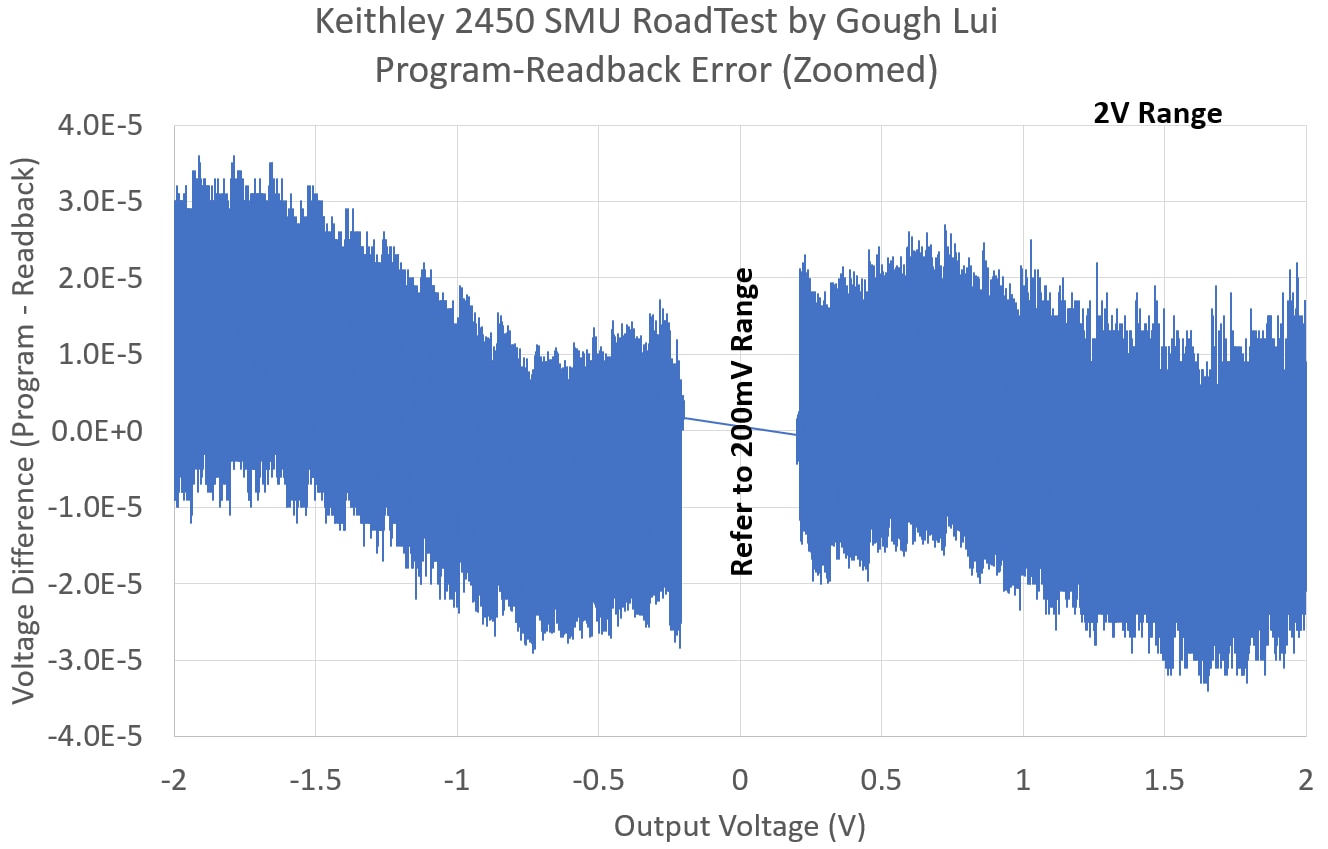
At 2V, the results again impress, showing the error to be well within the specifications. When zooned in, the “wavy” error characteristic shows a deviation of about 35uV.


In the 20V range, it looks to be a carbon copy, except that the error is now confined to about 400uV.
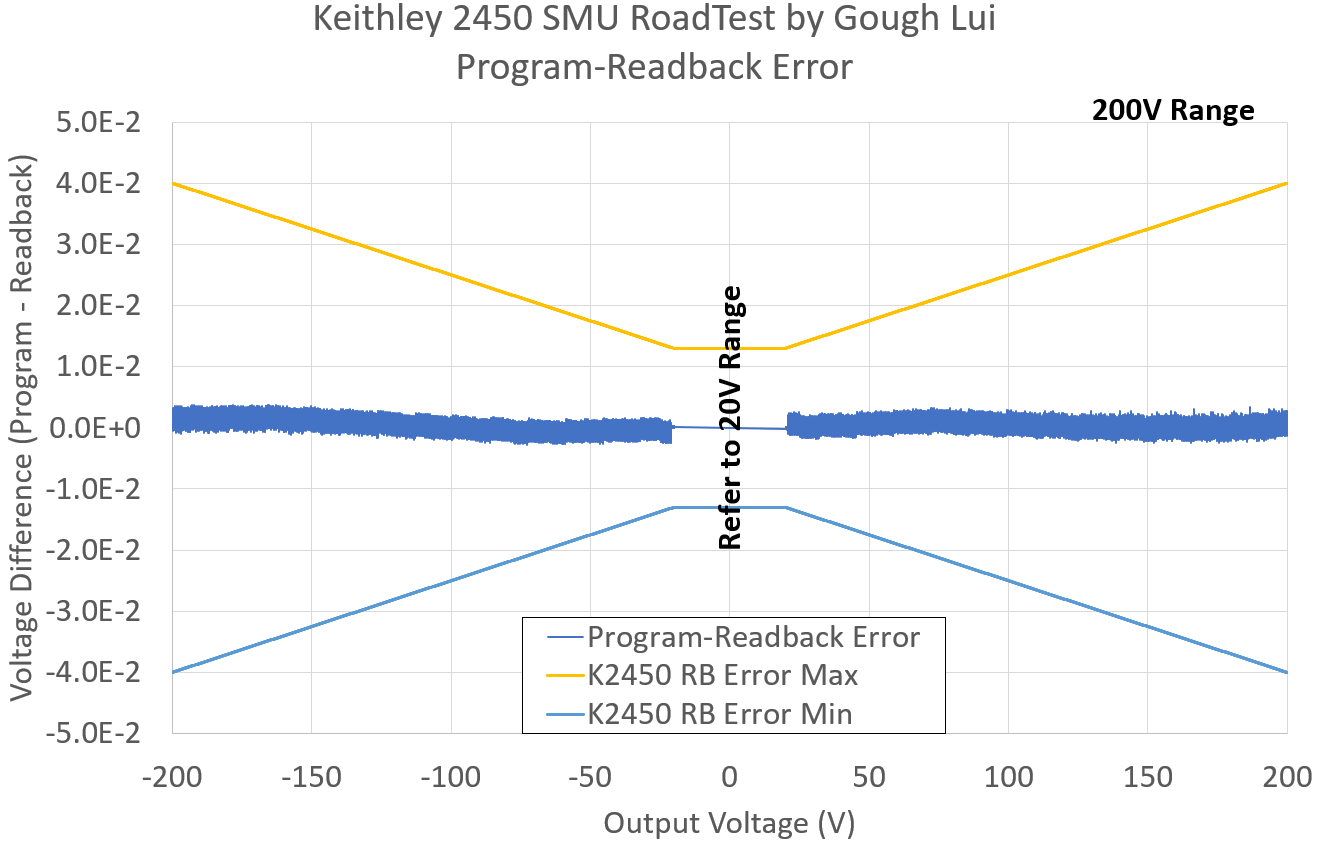
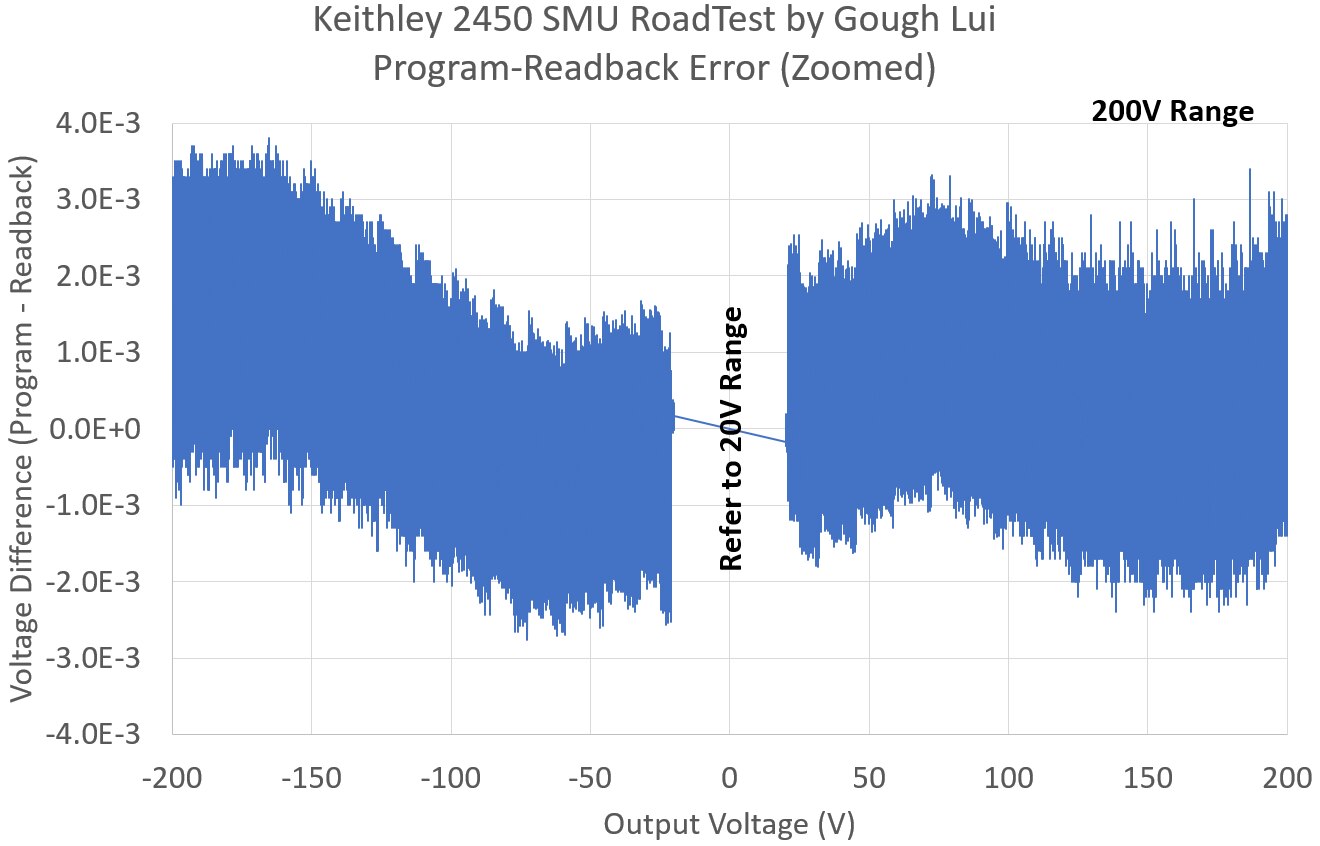
Finally, in the 200V range, the error reaches about 4mV. In all cases, the combined programming and readback error of voltages is less than the readback error value alone, meaning the instrument is likely to be more accurate than stated on the datasheet as tested. Most reputable manufacturers are conservative to account for changes in environment (e.g. power, temperature, humidity, drift, worst-case calibration errors), so this definitely shows. But the results seem consistent with prior tests which is good.
Current Programming Accuracy
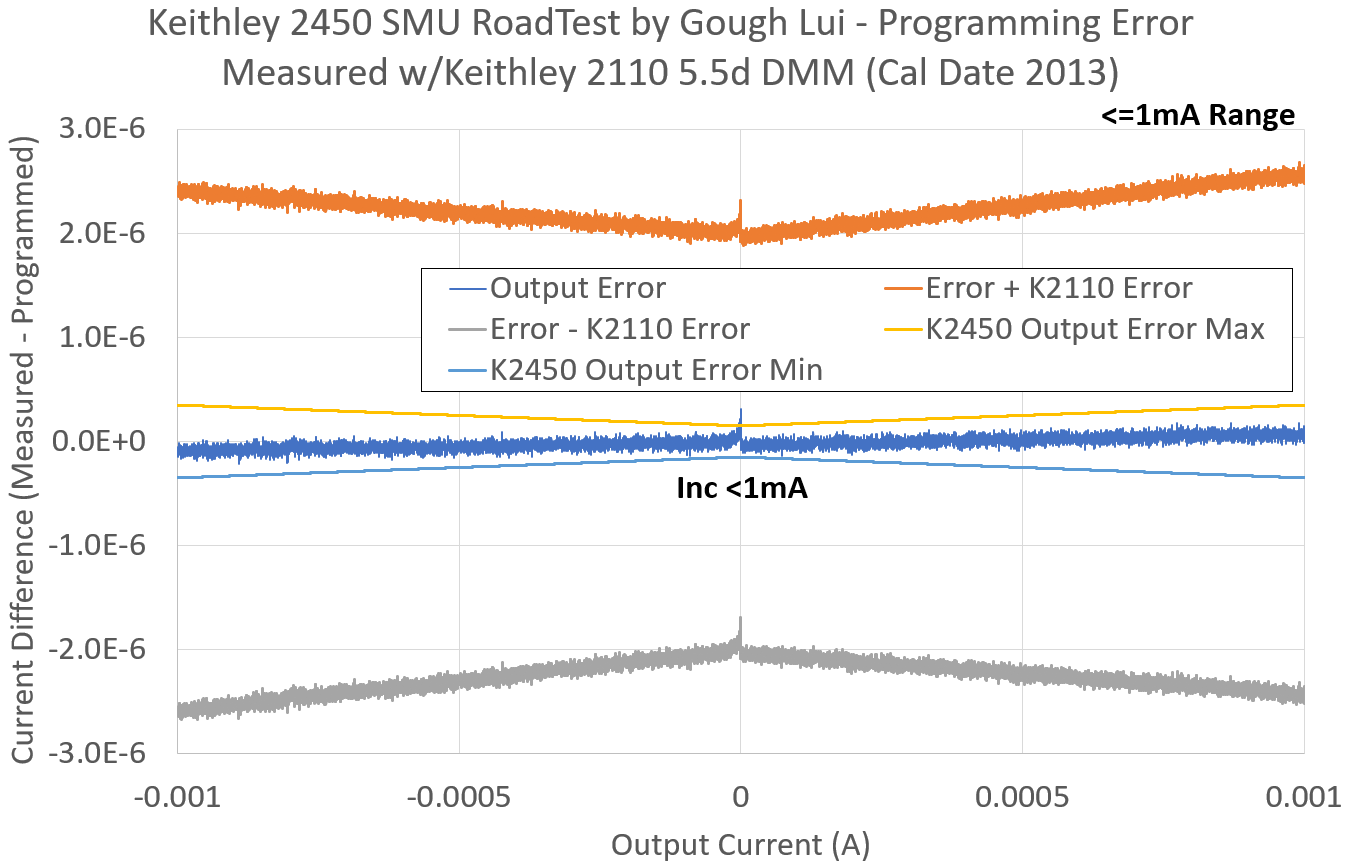
Performing the same tests for current, but only in the ranges where the 2110 would have enough resolution, we start at the 1mA range. In this test, around the zero-current area, there is a slight deviation on the negative side which wasn’t present in my initial test, but given the broad error of the 2110, the result is inconclusive. Most of the reading difference value sits within the 2450’s programming error specification, which is a great outcome.
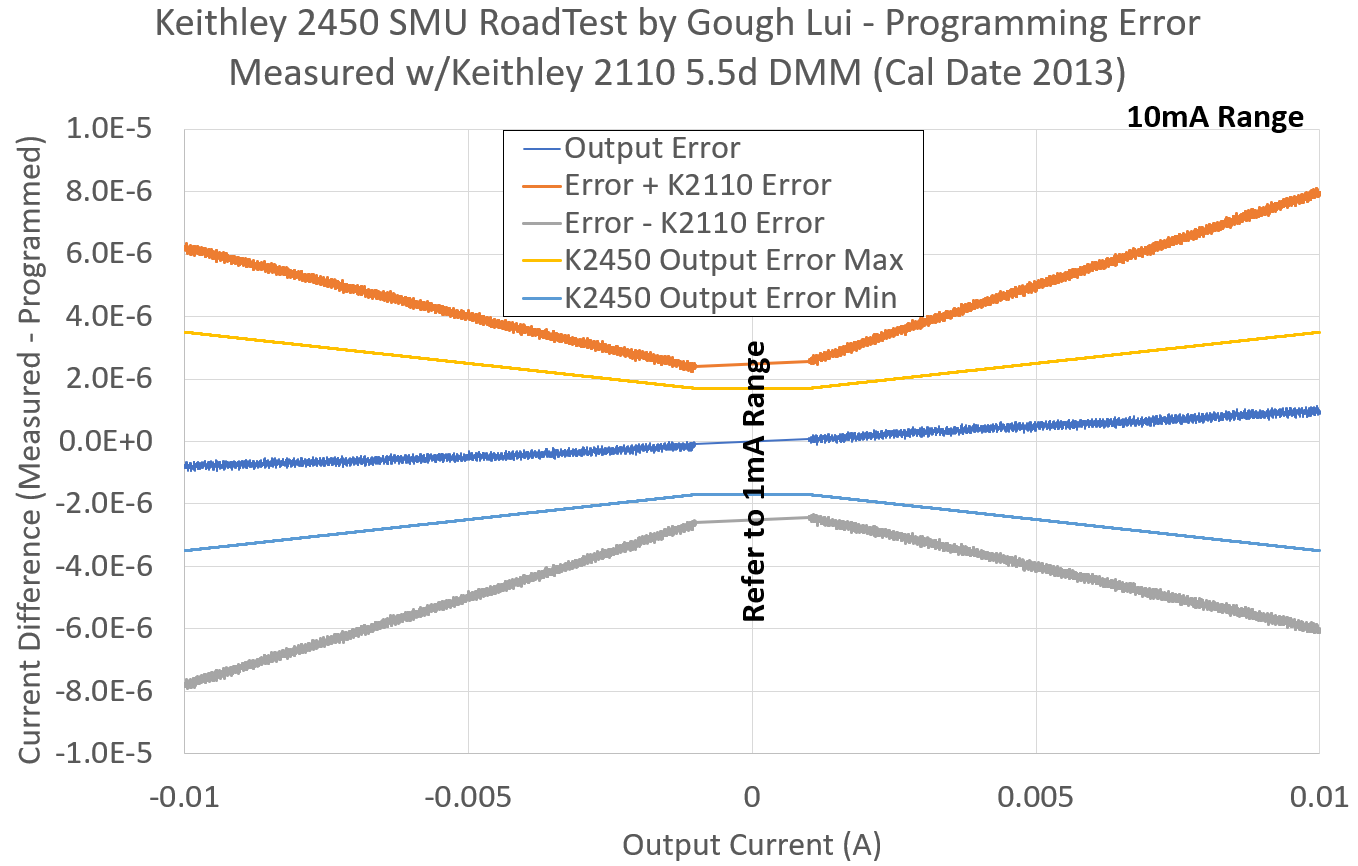
In the 10mA range, a carbon copy of the previous test results is seen with the same sloping offset, although the magnitude of the slope has reduced from ~1.8uA of error at 10mA to ~0.9uA of error at 10mA. This could be thermally related or a difference in calibration but again, the error of the 2110 is greater than the 2450’s specifications, so the test is inconclusive.
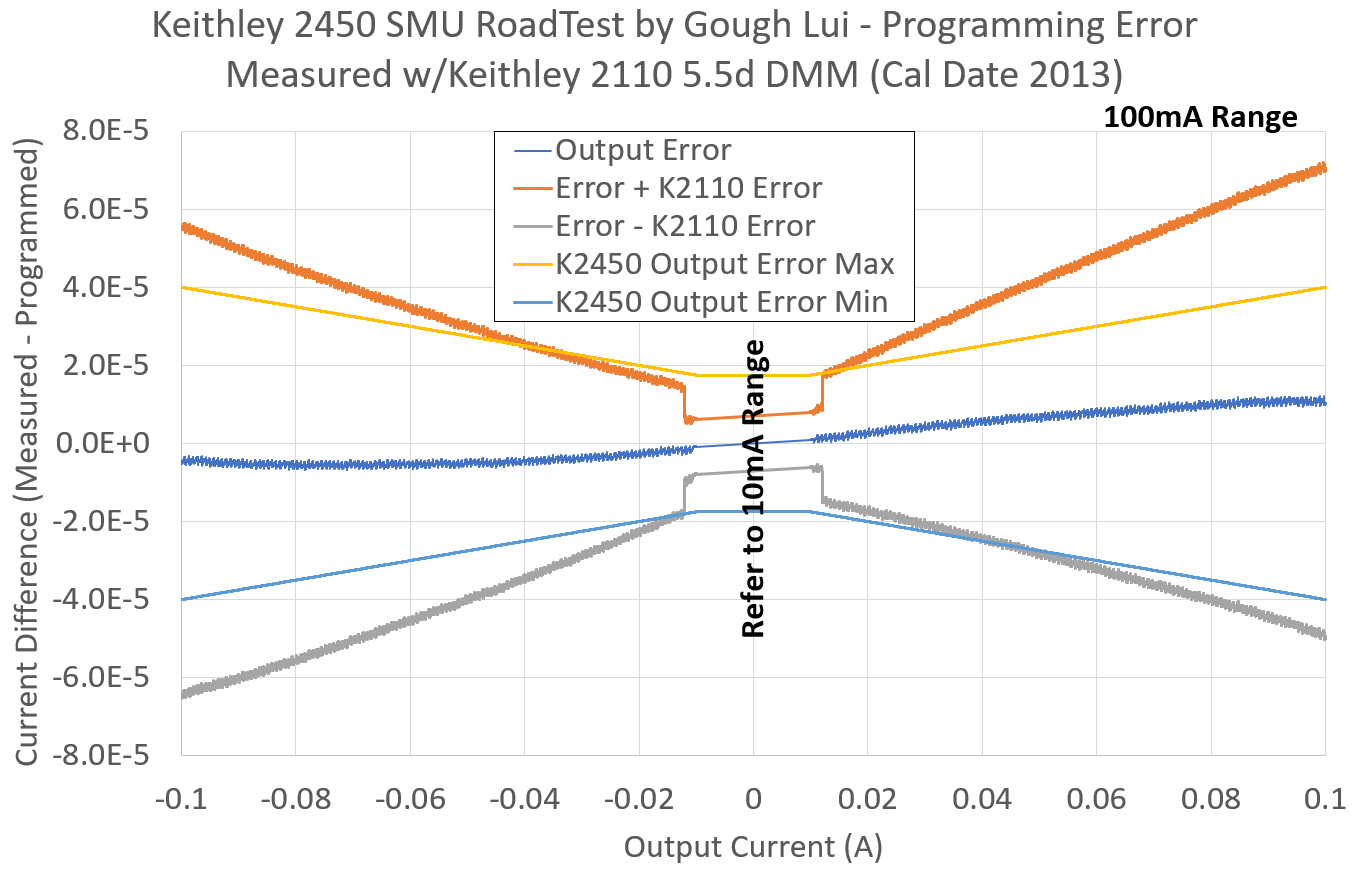
Testing at 100mA showed a slight “curve” to the reading difference line, but no significant differences from the prior result, which show the instruments to be likely in agreement.
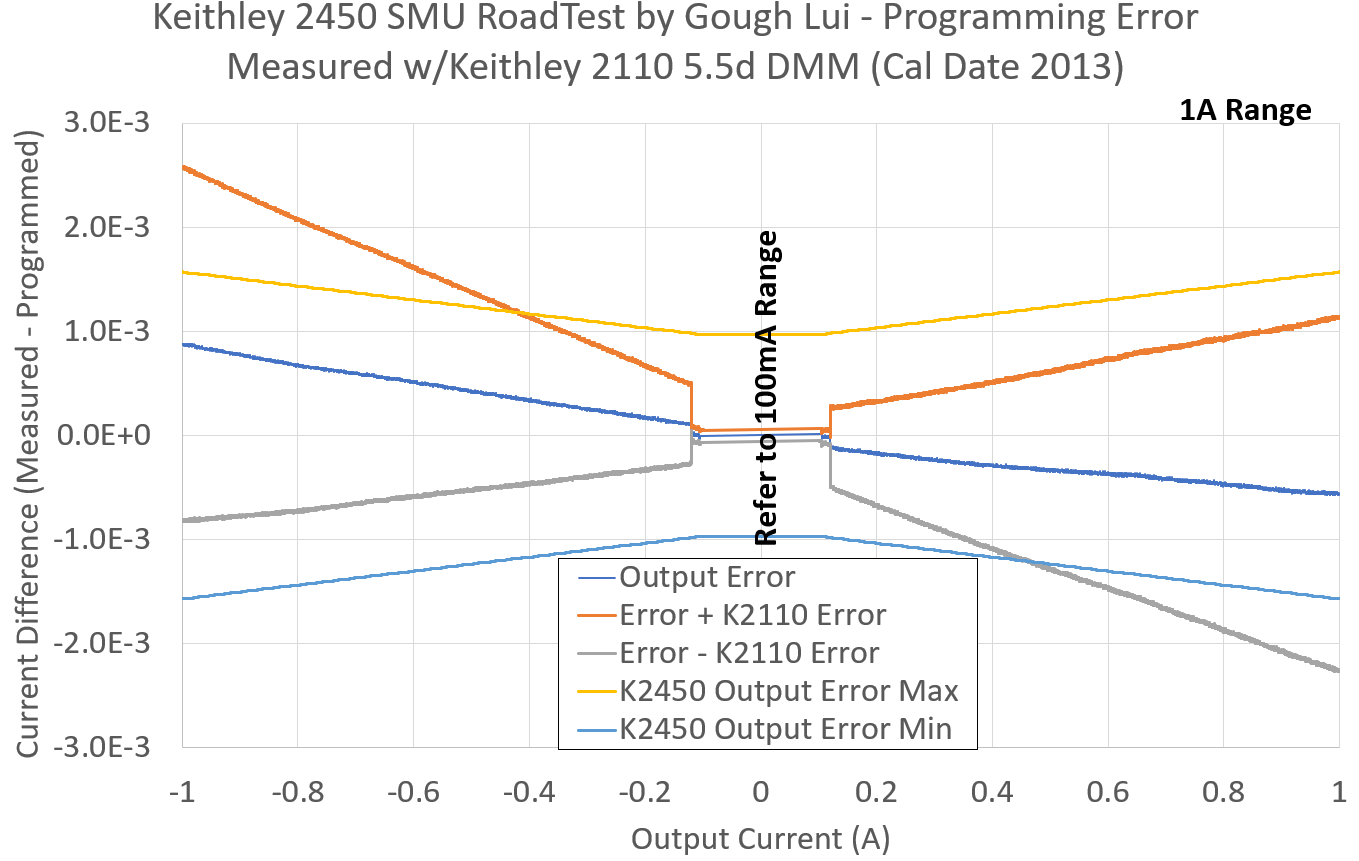
In the 1A range, the gain error of the 2110 shows itself quite clearly, but almost identically to the previous test. Again, this implies the calibration before and after repair are consistent. The margin of error for the 2110 encompasses the zero-error line in all cases, so despite the noticeable disagreement, the instrument is still within its claimed error specifications as a “basic” 5.5-digit DMM.
Combined Current Programming & Readback Accuracy

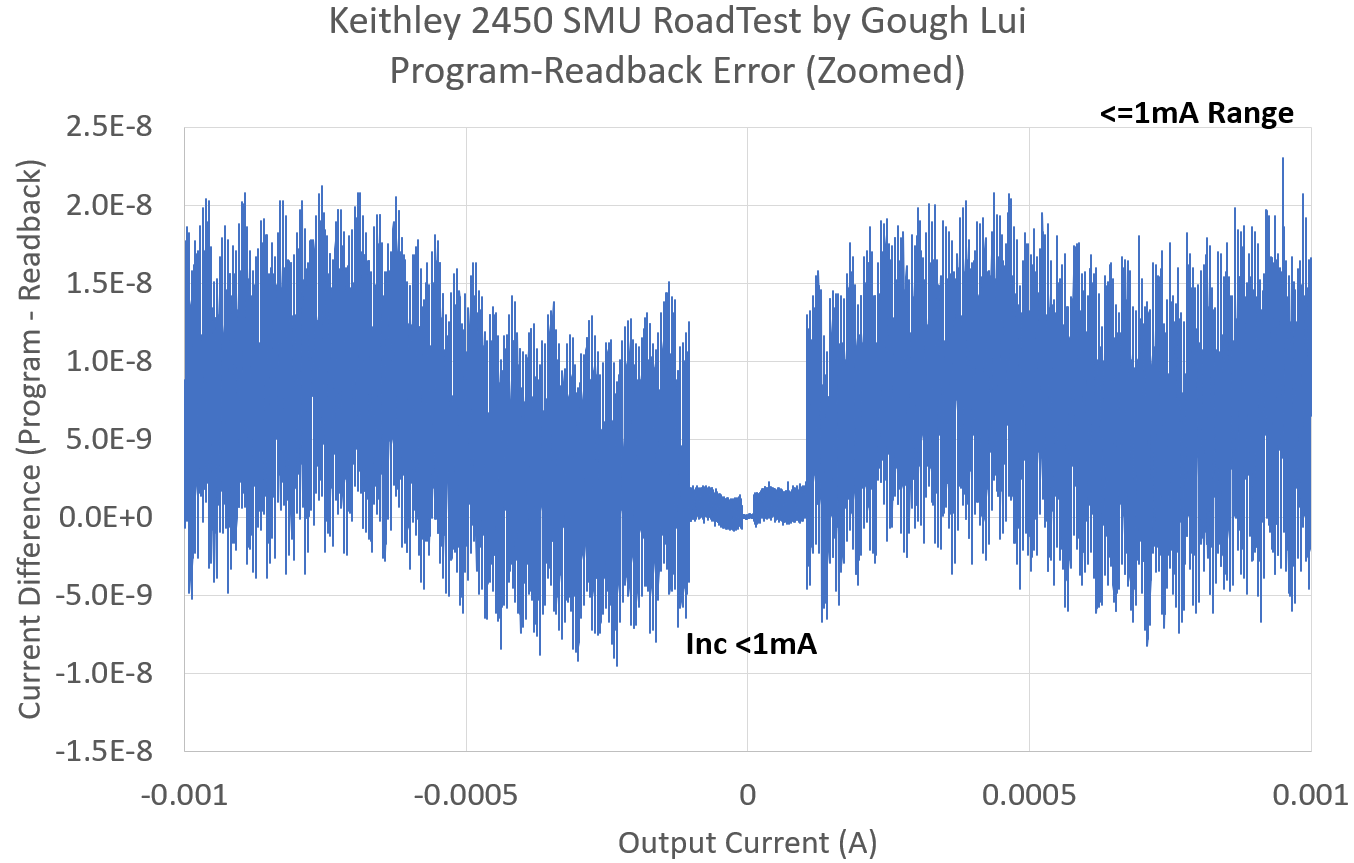
At <=1mA, the current error is within about ~24nA – consistent with previous testing which is an excellent result.
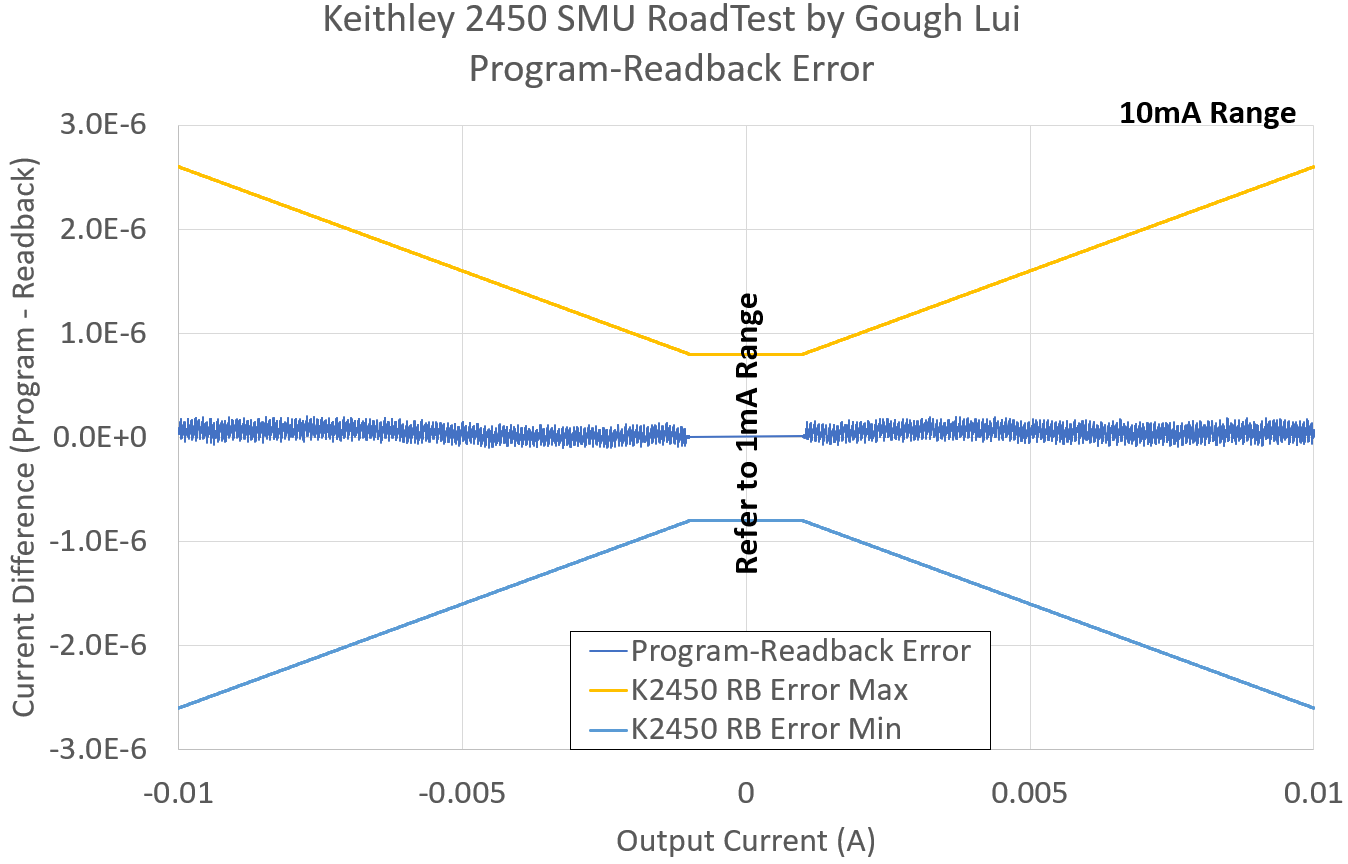
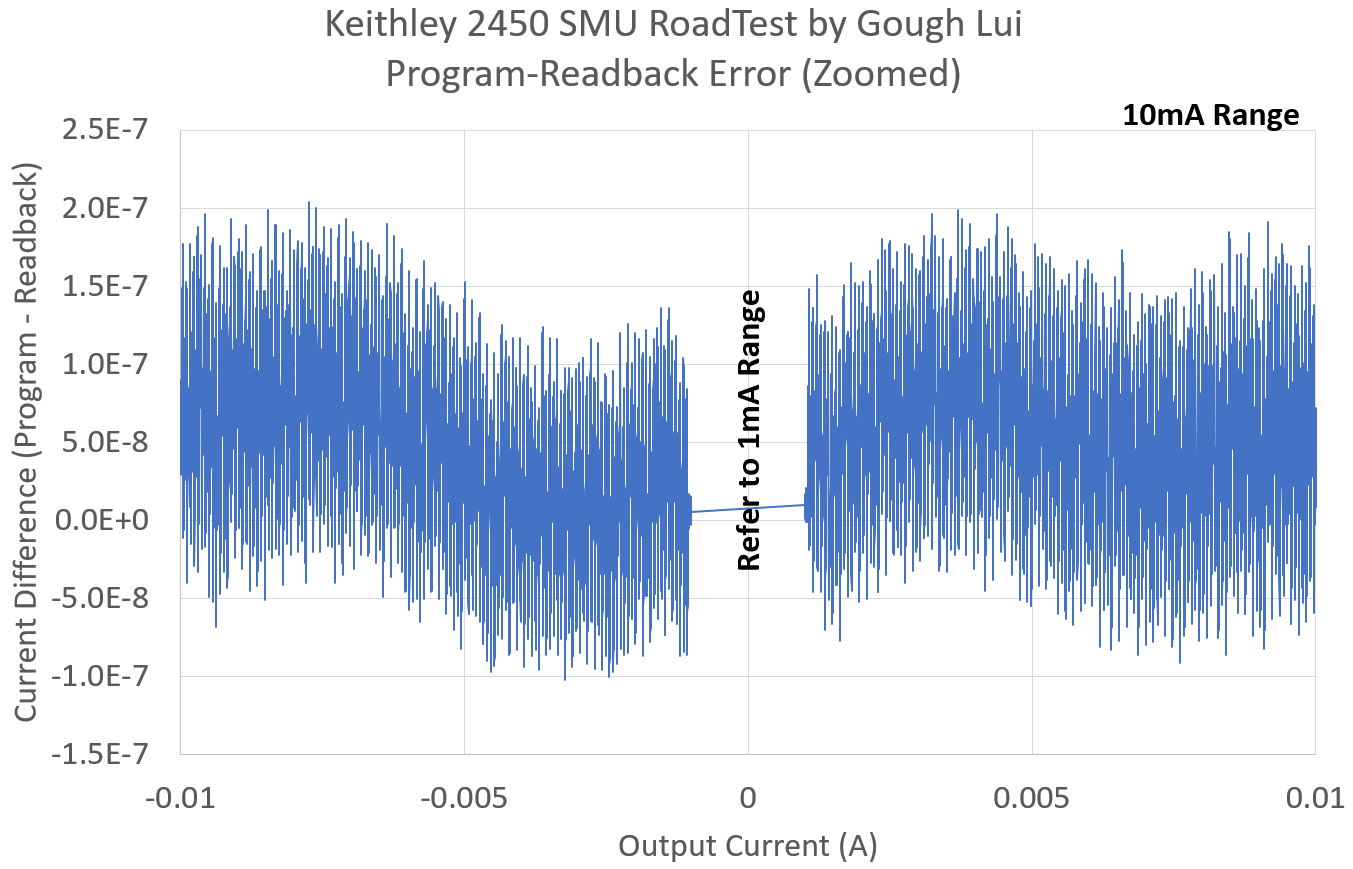
At 10mA, the error is within about 210nA, again well within the claimed read-back error.
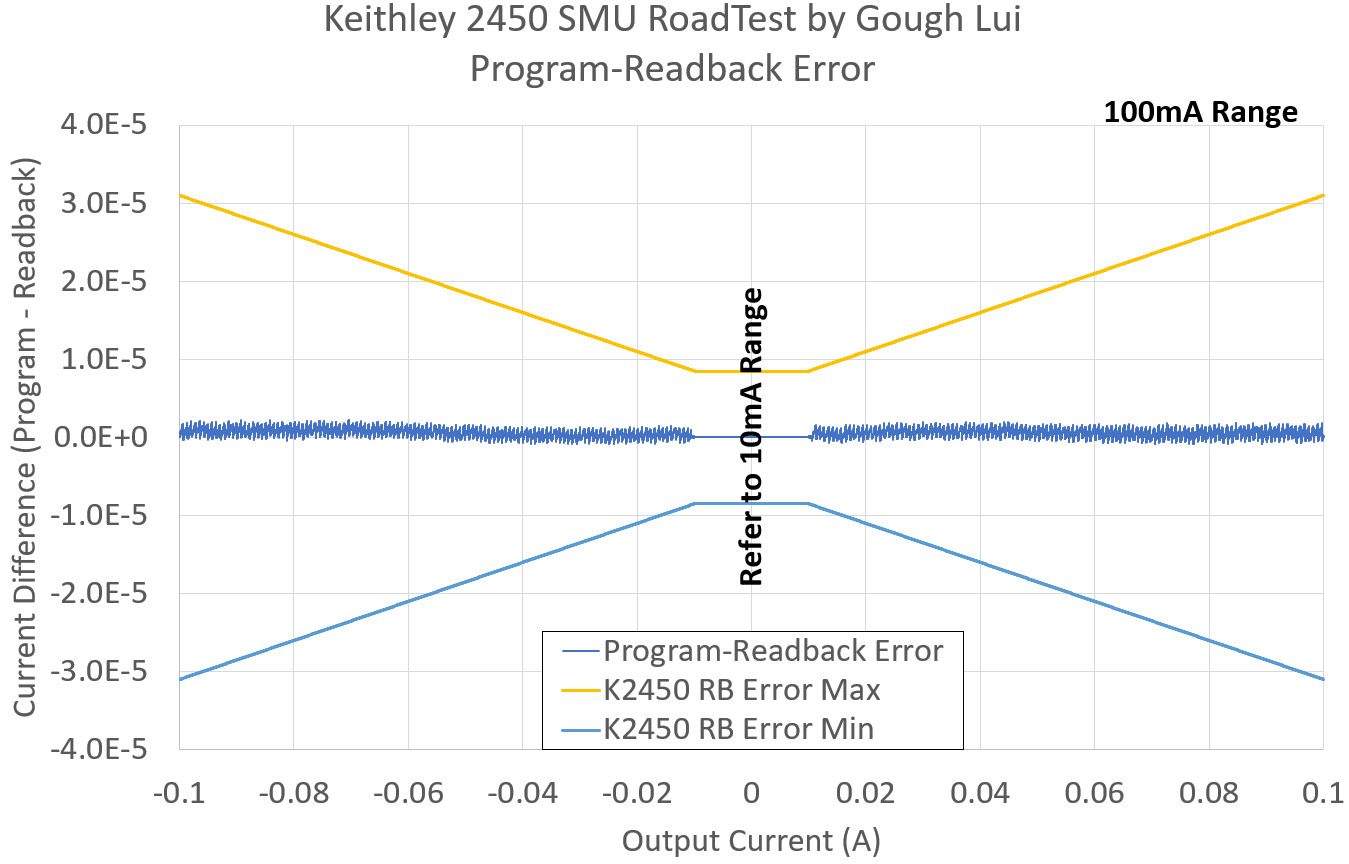
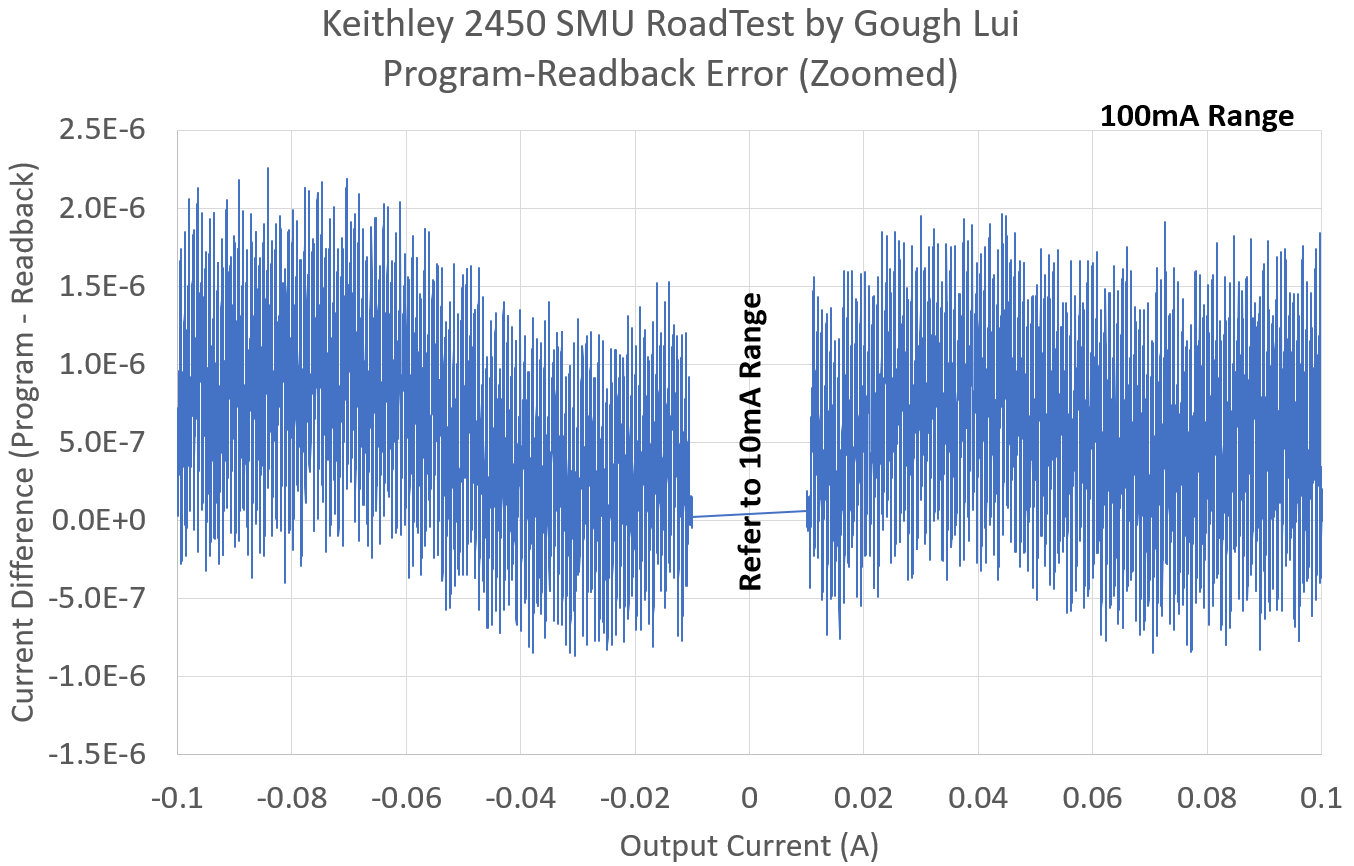
In the 100mA range, this increases to about 2.3uA, in all cases, appearing to be a “scaled-up” version of the “wave” characteristic seen prior.
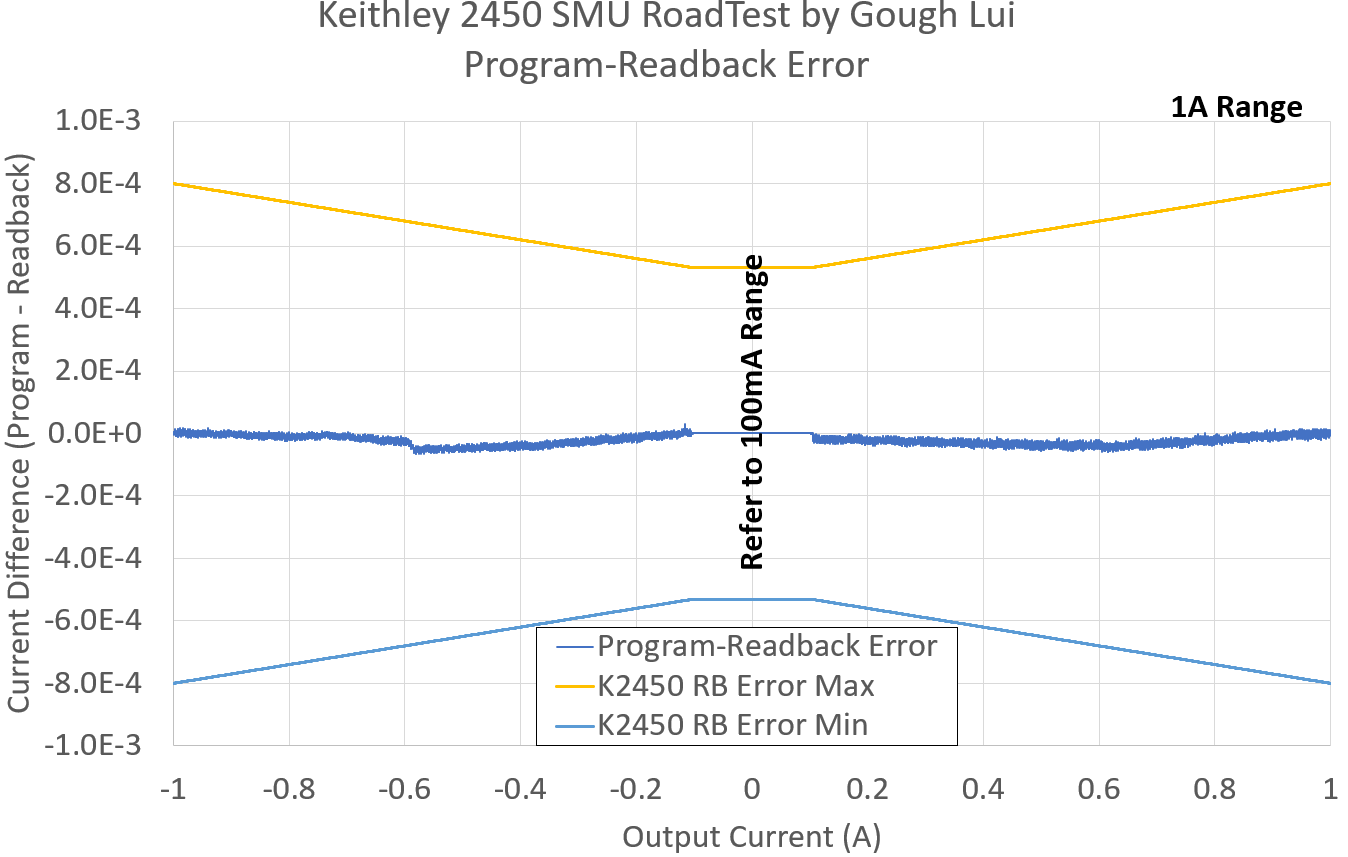
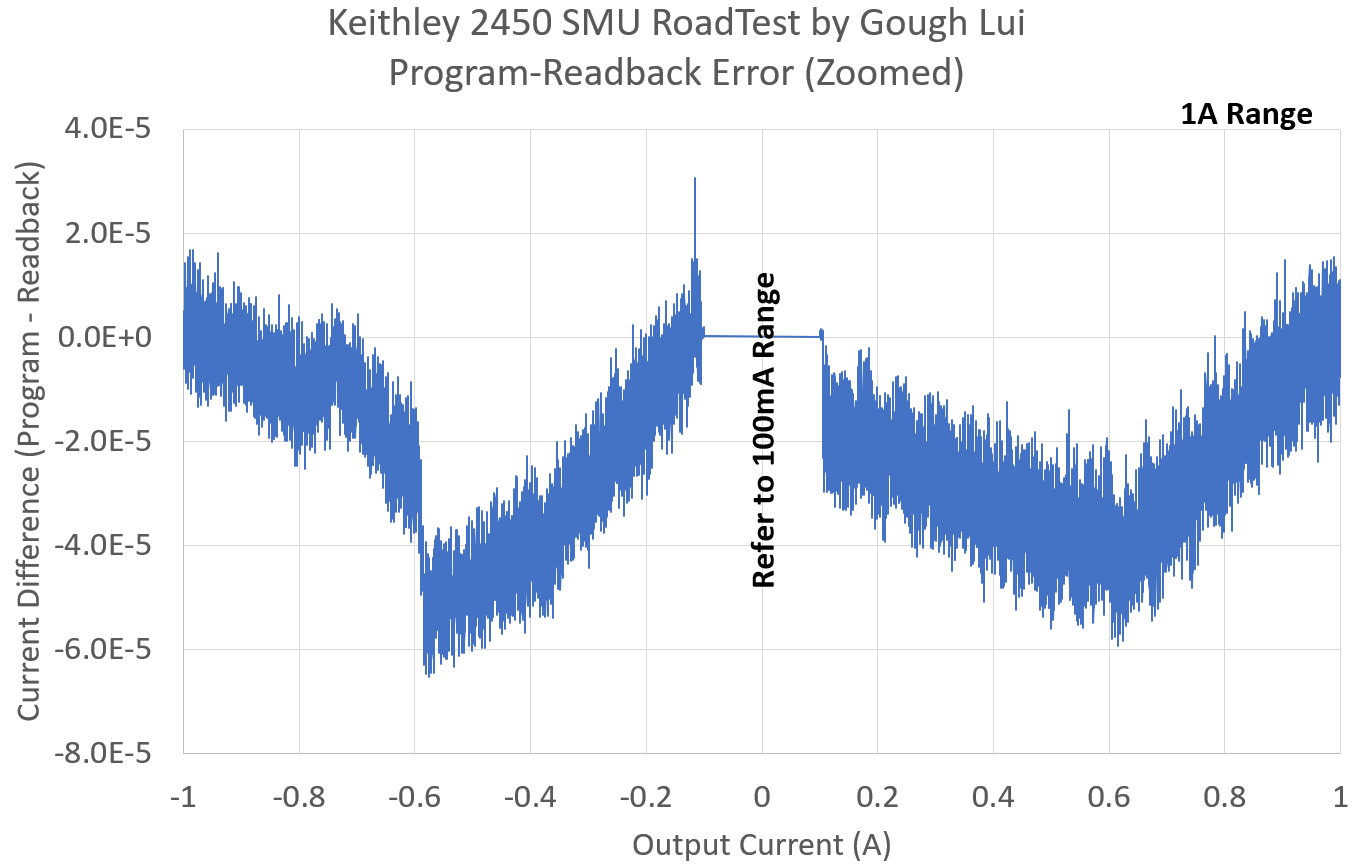
The 1A range shows more deviations than the other ranges, however, is still well within the claimed accuracy limits. Specifically, in the sinking mode of operation, there seems to be a significant dip around 0.6A which seems a little steeper in this test than in the past. A shallower dip is seen around 0.6A sourcing. This corresponds to my experience that the 2450 exhibits its maximum heating around the 400-600mA level, thus the internal temperature of the instrument may be affecting its output.
In all cases, the resulting characteristics are consistent with the SMU’s performance prior to repair.
Testing the Tektronix PA1000PA1000 Power Analyzer (2014)
While the previous section has been quite exhaustive comparing the performance of the 2450 SMU using the 2110 DMM, the following sections are mainly to check the accuracy of my other instruments that have a similar or slightly lower level of precision. As the test results above show, I have good confidence the 2450 has better than the claimed level of programming accuracy to the extent that the combined programming and readback errors are well below the readback error margin alone. As a result, I will compare instrument readings to the 2450’s readback, the instrument’s own margin of error with the 2450’s readback error margin illustrated.
The Tektronix PA1000 Power Analyzer is another RoadTest item, this from 2014 which hasn’t been recalibrated since manufacture. This unit has the ability to measure up to 1000V (of which we can test to 200V with the SMU) and two current shunts of 1A and 20A (which we can test to 1A) all of which have multiple ranges. While primarily intended for AC applications, it is also capable of DC measurements with a basic accuracy about 0.1%.

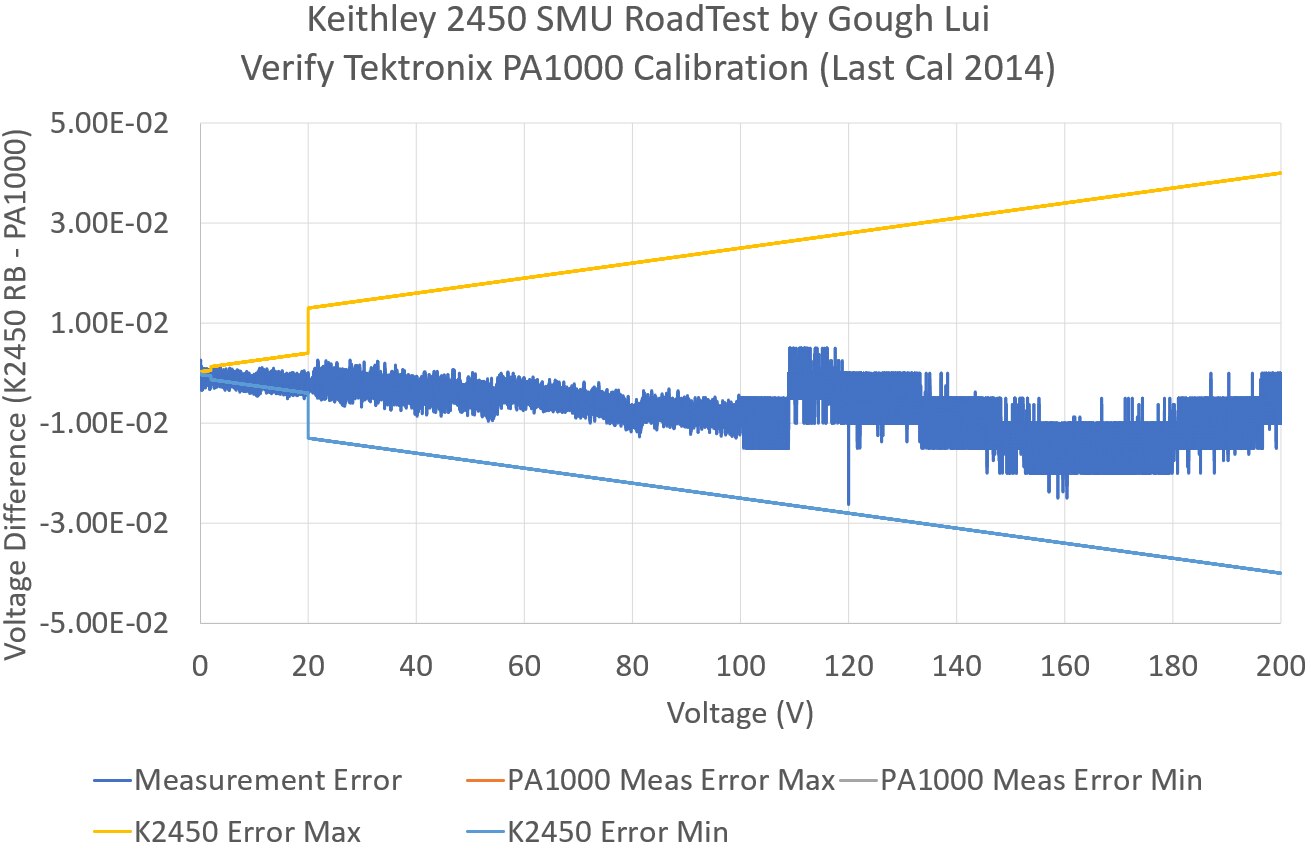
Testing the voltage accuracy, we can see that the PA1000PA1000’s error margins are quite a bit wider than the 2450, making the 2450 a good candidate for testing. The absolute reading difference sits very close to the zero-difference line and mostly sits within the 2450’s error margin, so it seems both instruments are in agreement and the PA1000PA1000 is still well-calibrated. The error reaches about 30mV at 120V.
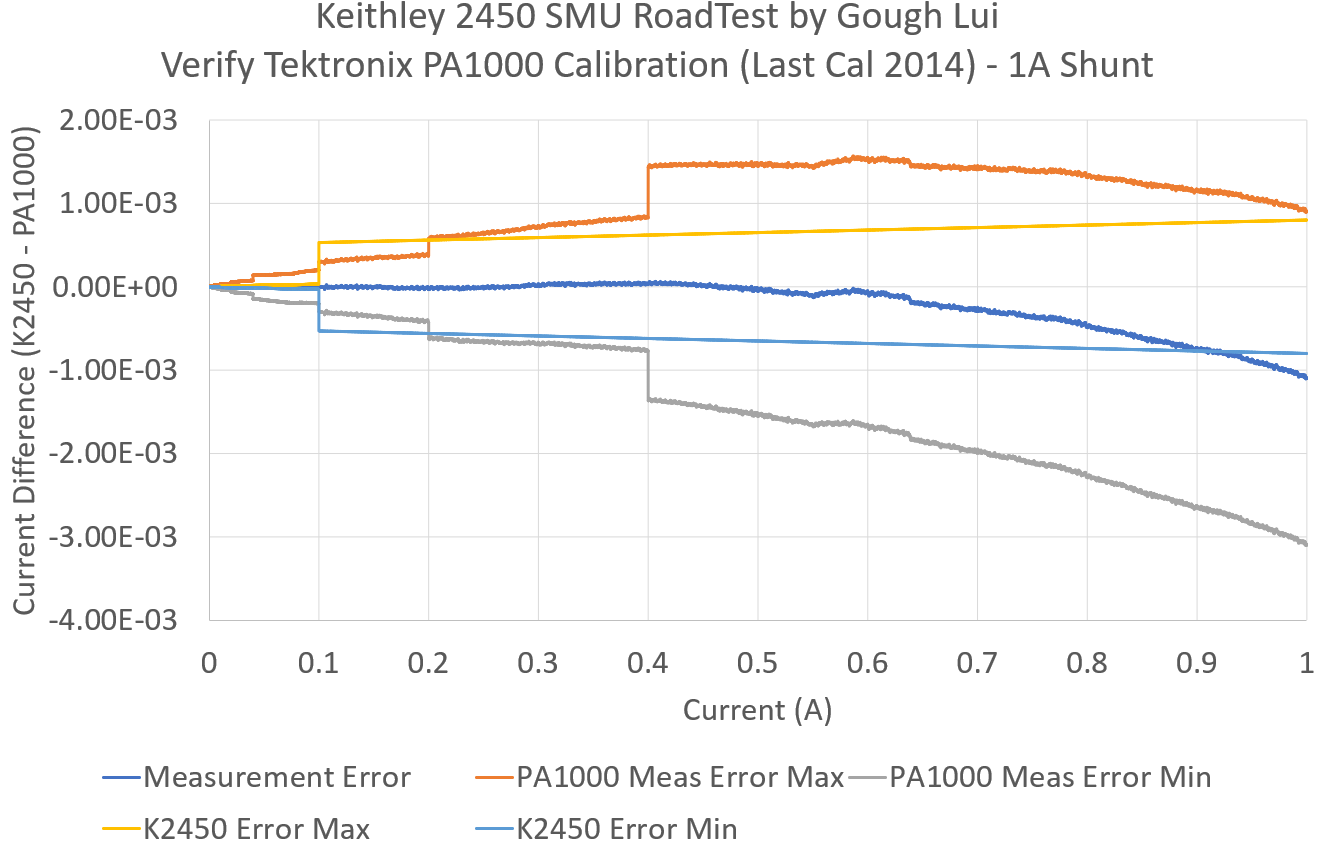
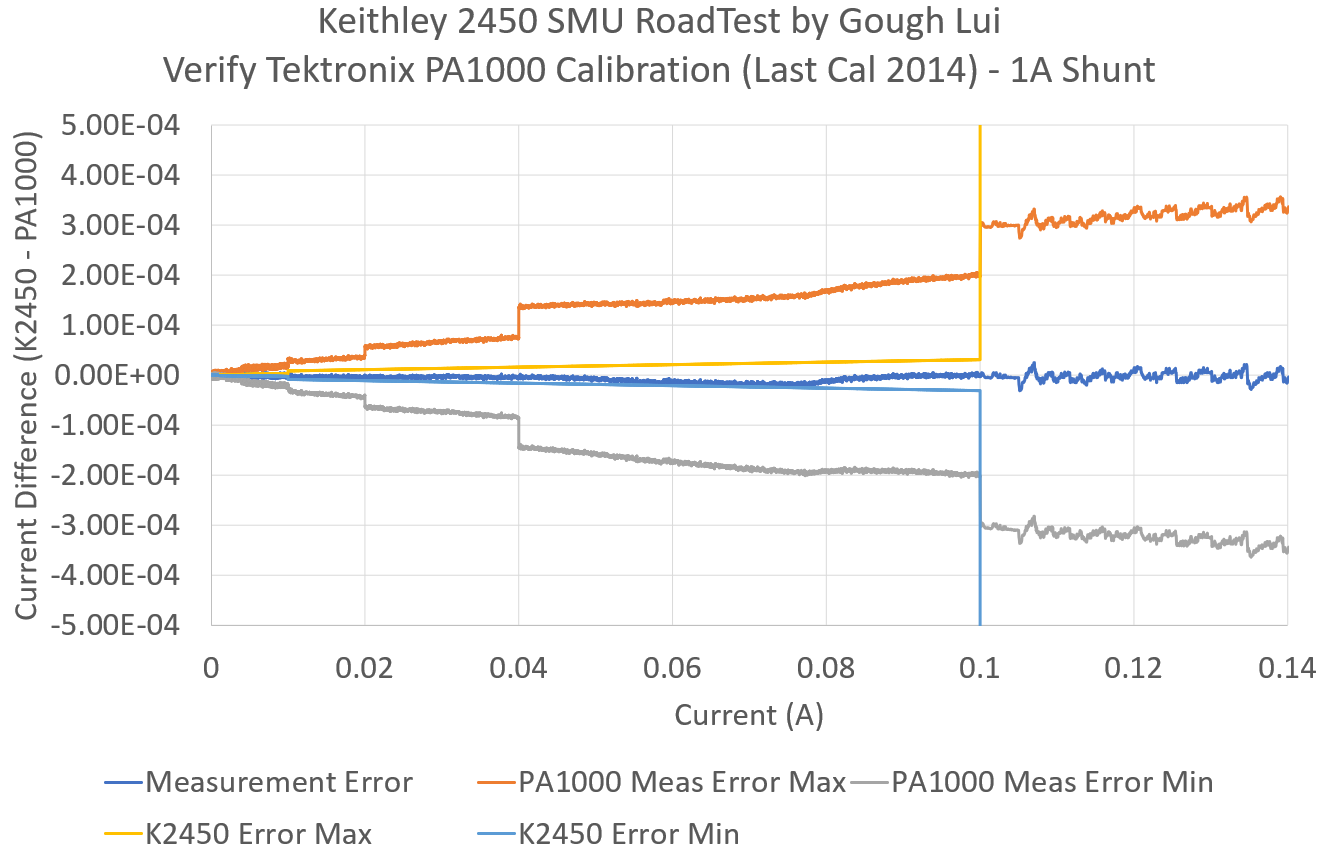
Testing of the 1A current shunt shows the PA1000PA1000’s low-current shunt intended for higher accuracy measurement of low-current loads (e.g. for standby power compliance applications). As a result, the accuracy of the reading from the PA1000PA1000 is actually better than the 2450 but only for a small range (0.1-0.2A), otherwise the PA1000PA1000 is the less-accurate instrument. Up to about 0.5A, the current readings are very consistent, but above that, it seems that shunt heating causes drift in the measurement resistance, resulting in the PA1000PA1000 over-reading current. However, even at the full 1A, the SMU’s error lines are enveloped within the PA1000PA1000’s margin of error, so we have confidence that the unit is still well calibrated and its performance should meet the datasheet specifications.
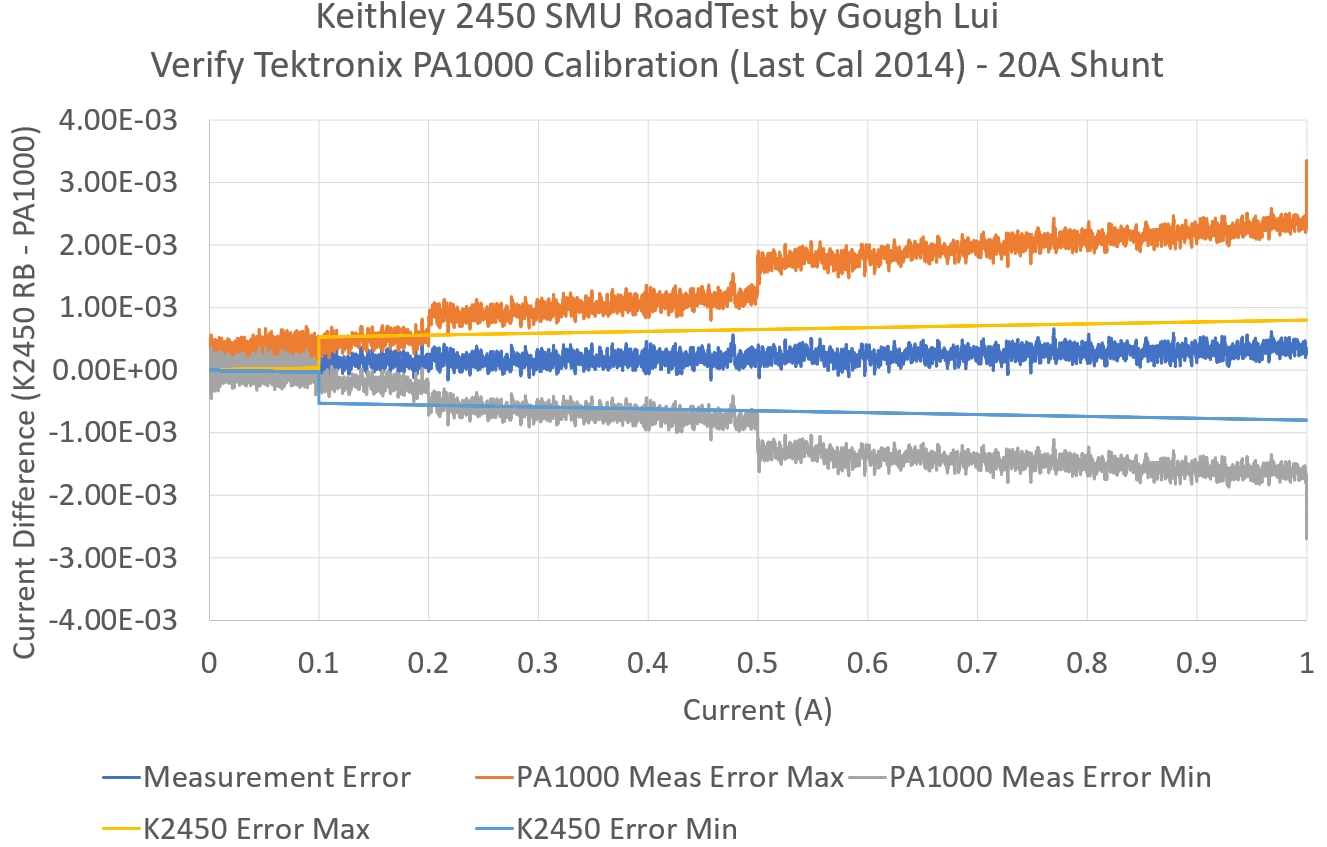
The 20A shunt suffers from a lot more reading noise due to the higher ranges and limited resolution of the converters. As the shunt is designed for much higher currents, we don’t see the same curve in the results – in this case, the reading errors stay within the SMU’s margin of error where the reading noise is low enough, indicating a good result – namely that I can trust my Tektronix PA1000PA1000 Power Analyzer to deliver me results within datasheet-levels of accuracy.
Testing the B&K Precision Model 8600 DC Electronic Load (2016)
The next item on the list for testing is the B&K Precision Model 8600 DC Electronic Load, another RoadTest item, this time from 2016. This unit supports an input up to 120V (which we can fully test) and current up to 30A (which we can check up to 1A).

Looking at the voltage first, we can see how wide the BK8600’s tolerances are – it encompasses the full SMU error margins so we should be able to have good confidence of our check. The difference line seems to lie within the SMU error band, so that’s a good sign.
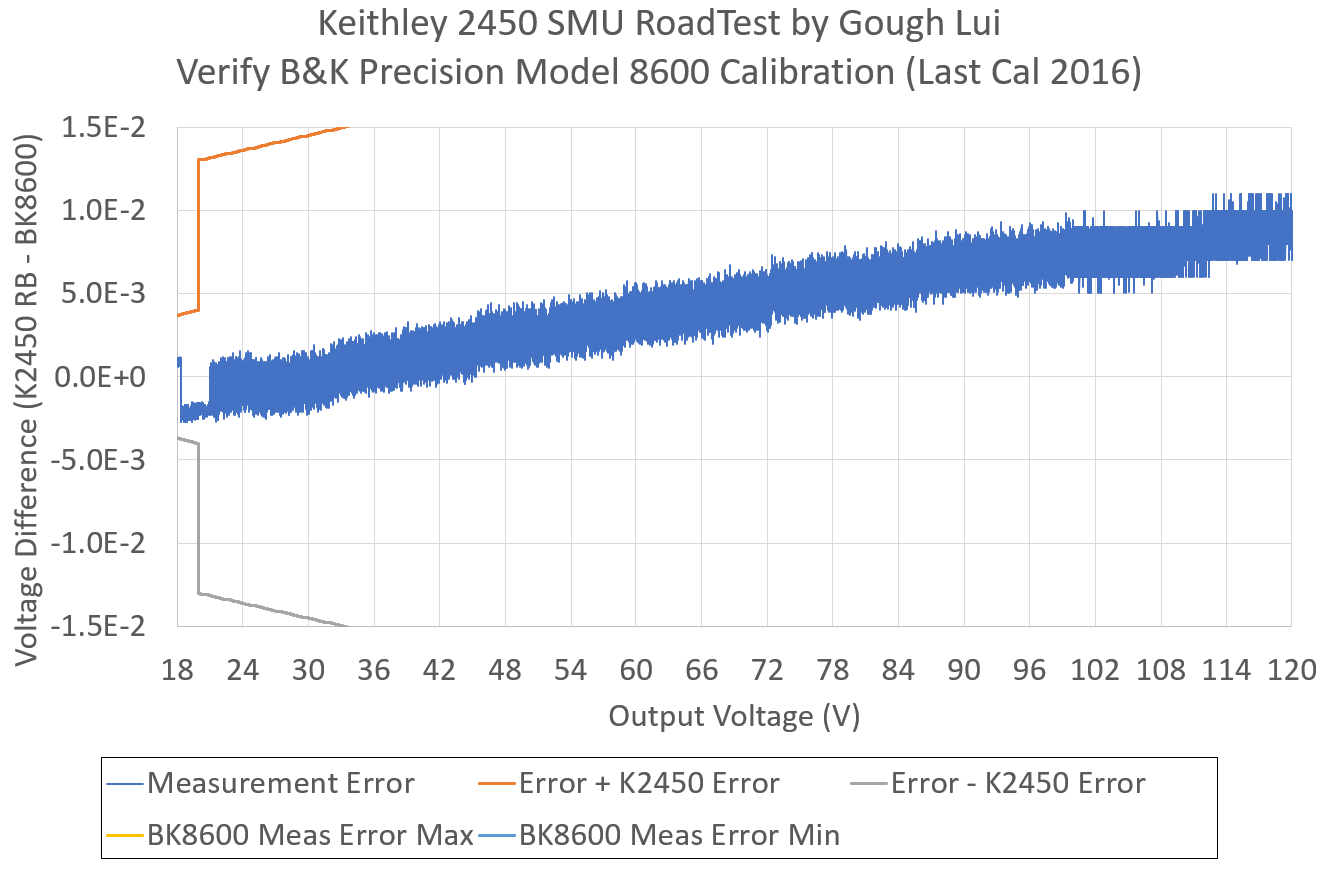
In the high voltage range, we can see the voltage reading is slightly high initially, but then becomes a little low, reaching a difference of about 10mV at 120V. This is well within specifications.
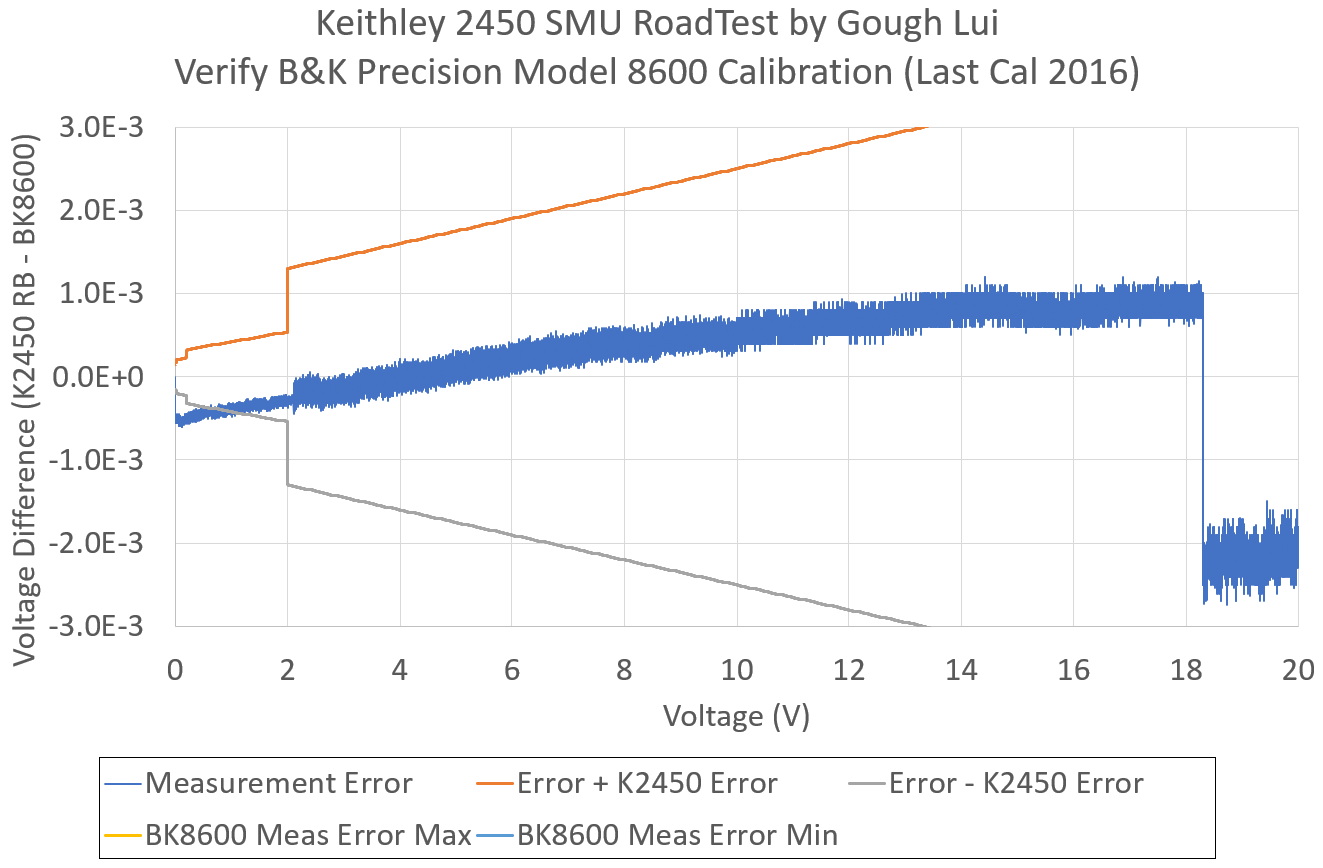
At low voltages, it seems there is an offset of about +0.5mV, reaching -1mV by the time we get to 18V (the limit of the low range). That’s well within specification for the BK8600BK8600, but both may illustrate gain and offset error which may affect the underlying A/D converter set-up as they are seen in both ranges. While the SMU’s natural error tendency is a “curve” which is different from the straight line characteristic seen here, since the readings are within the SMU’s margin of error, we cannot conclude too much from the result.
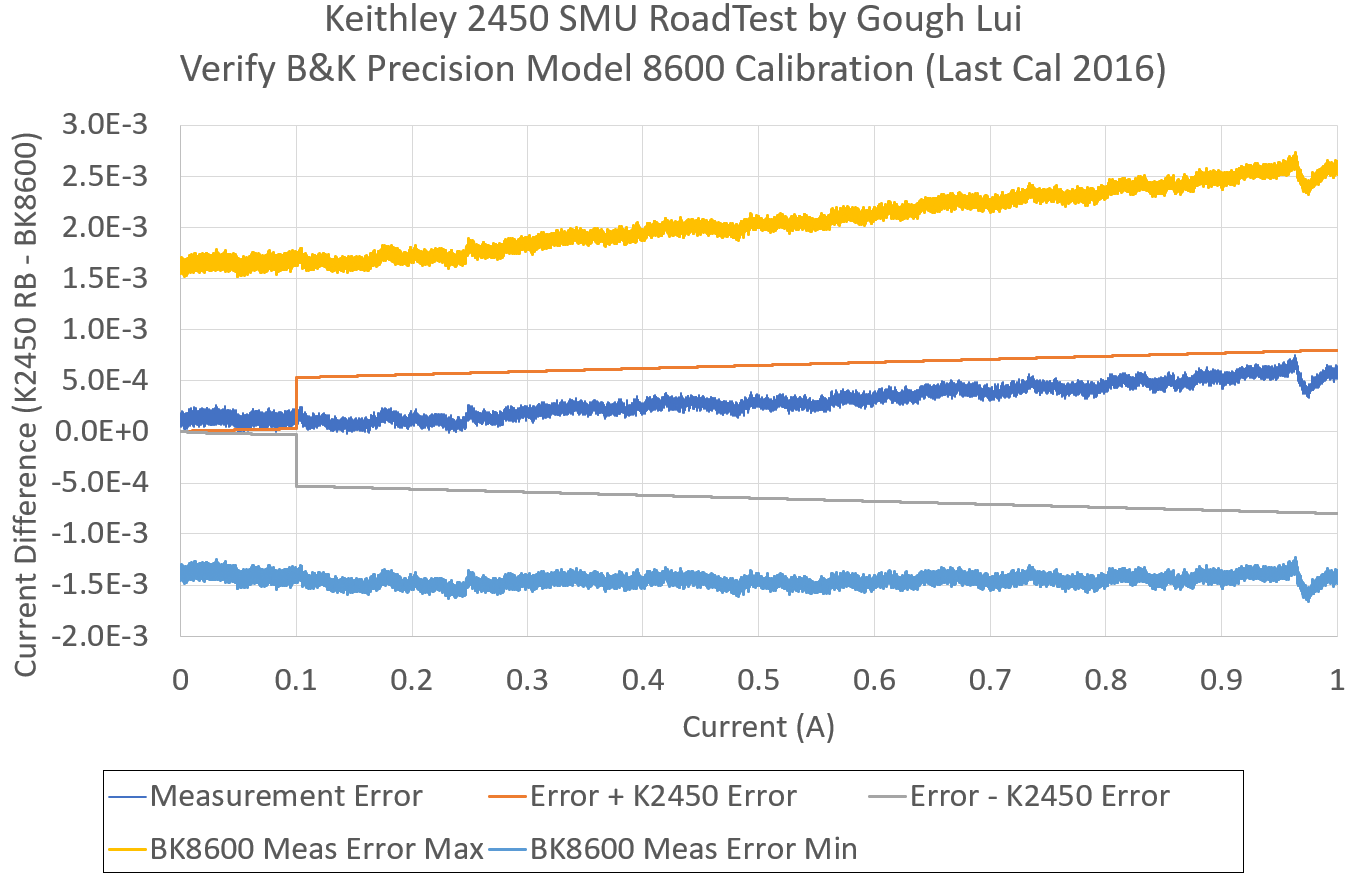

While the SMU can only be used across a small amount of the current capability of the BK8600BK8600, it was still worth a check. On the whole, there is a slight under-reading of about 100uA at the low current end, but errors were well within specifications and mostly within the SMU’s margin of error. Another good result that shows confidence that the B&K Precision Model 8600 DC Electronic Load can still achieve the datasheet-level of reading error.
Testing the Rohde & Schwarz NGM202 Power Supply (2019)
Finally, it’s time to test one of my more recent items, the Rohde & Schwarz NGM202 two-quadrant programmable power supply which I generously received pre-launch for review directly from Rohde & Schwarz. This unit has internal metering which is in the 5.5 to 6.5-digit class with multiple ranges, with advanced FastLog capabilities, making it suited for development of IoT/embedded devices to analyse sleep-mode currents as well as for use with battery simulation and battery testing. Its calibration was checked using the 2110 DMM on receipt with some interesting discoveries including “humps”, but otherwise was well within specifications at the time. Now that a year has passed and I have a more accurate way of testing it, I thought it would be good just to check. The unit has two channels, each of which can handle up to 20V of which we can test the full range, and 6A (source) or 3A (sink) which we can test 1A.
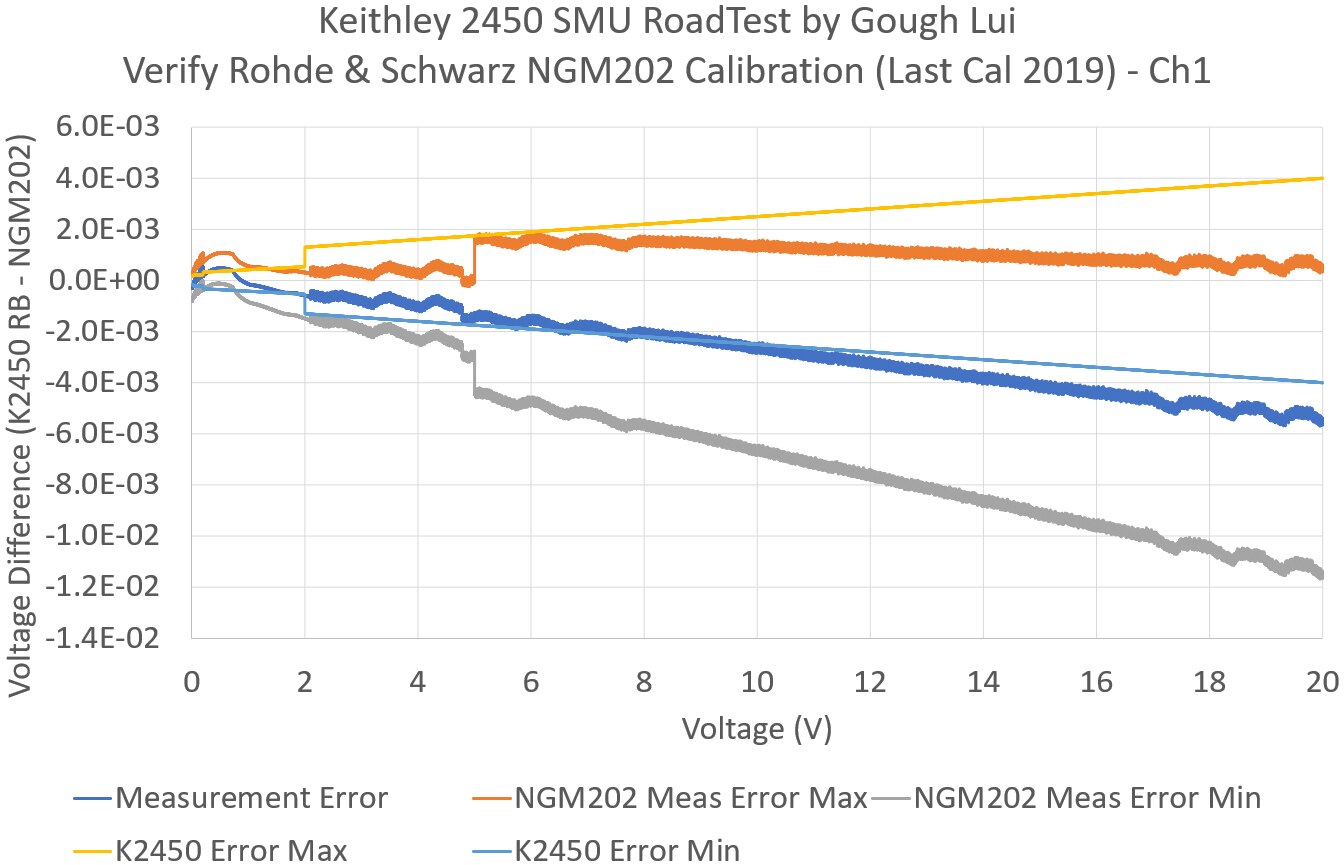

Checking the voltage calibration gives an interesting result. It seems the NGM202 has a gain error that causes it to over-read voltages by about 3-6mV at 20V. It also exhibits “ripples” on Ch 1. The lines do stray out of the SMU margin of error, so there is definitely some error contribution from the NGM202, but interestingly both the ripples and “hump” near the low voltage end were measured in my initial performance testing. The amplitude of error was not measured as high – around 2mV before, but this small error is not unexpected as the disagreement between the 2450 and 2110 is probably about that amount. As a result, I would say the results are consistent and the NGM still very likely in calibration as the zero-error line still almost entirely fits within the NGM202’s error margins even without considering the SMU’s output error.
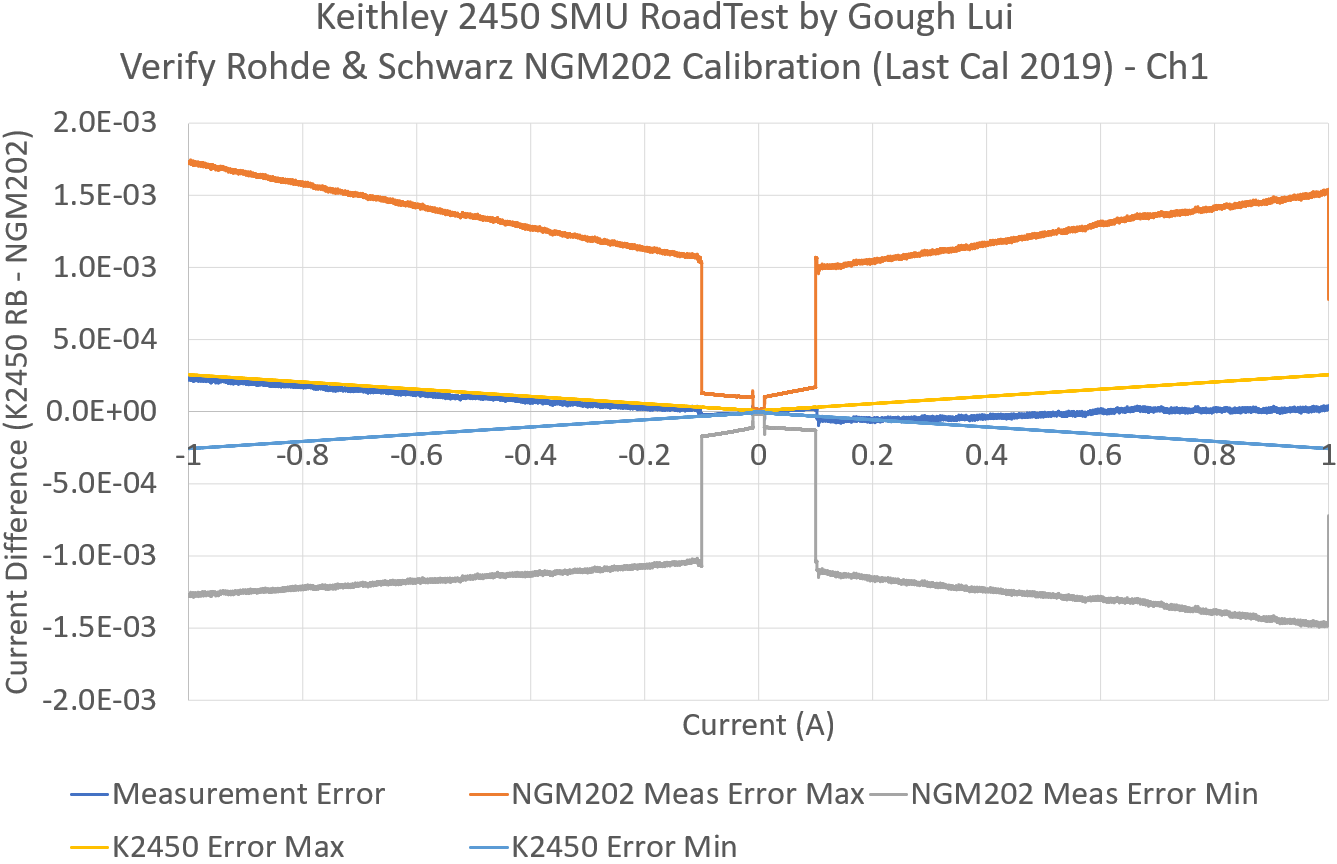
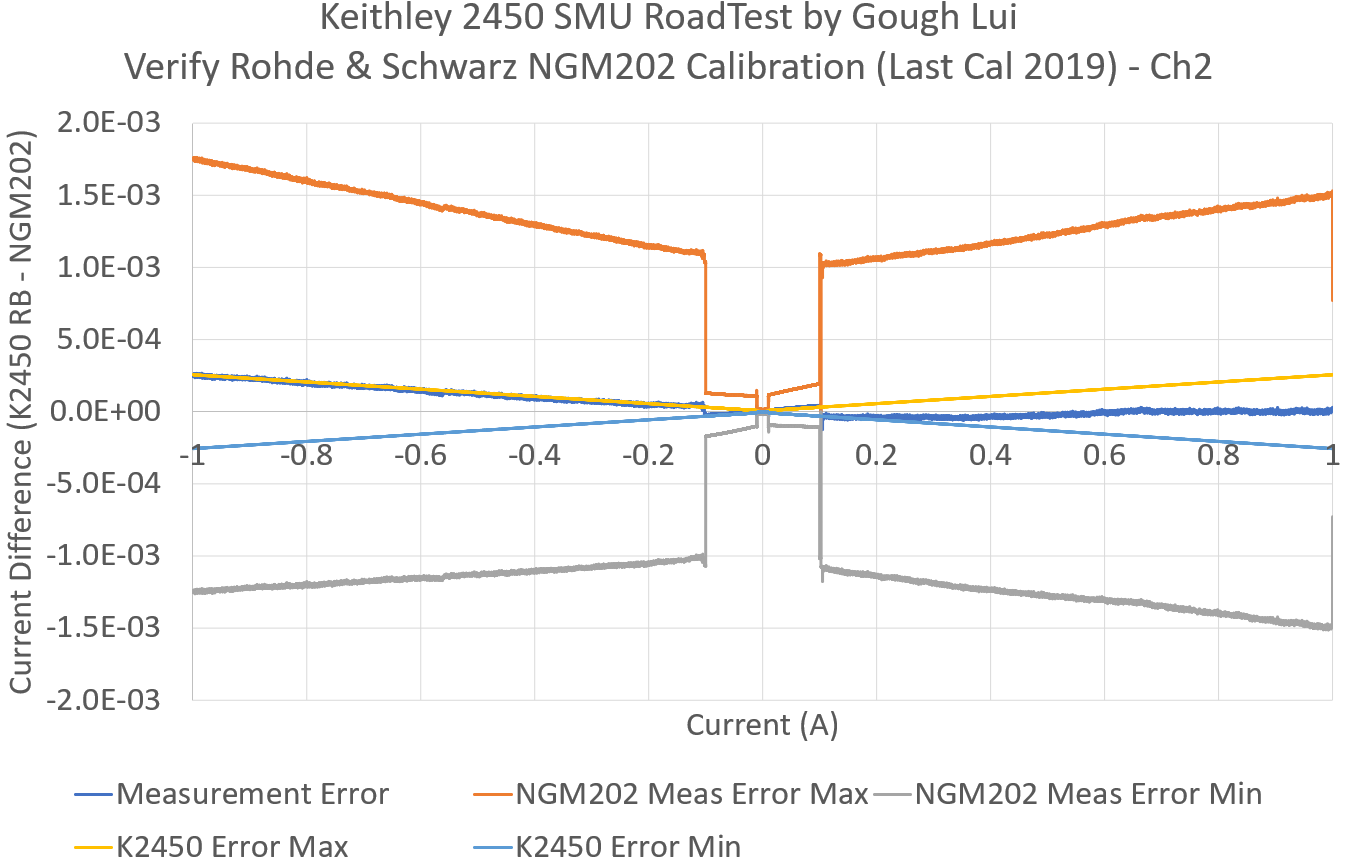
As the unit is a two-quadrant unit, we can test both positive and negative currents. Interestingly, it seems that there is an under-reading gain error on the sinking portion of the test, while sourcing is much closer to zero error. In all cases, the errors are close to or within the SMU’s error margin, meaning we have good confidence that the current is well calibrated.

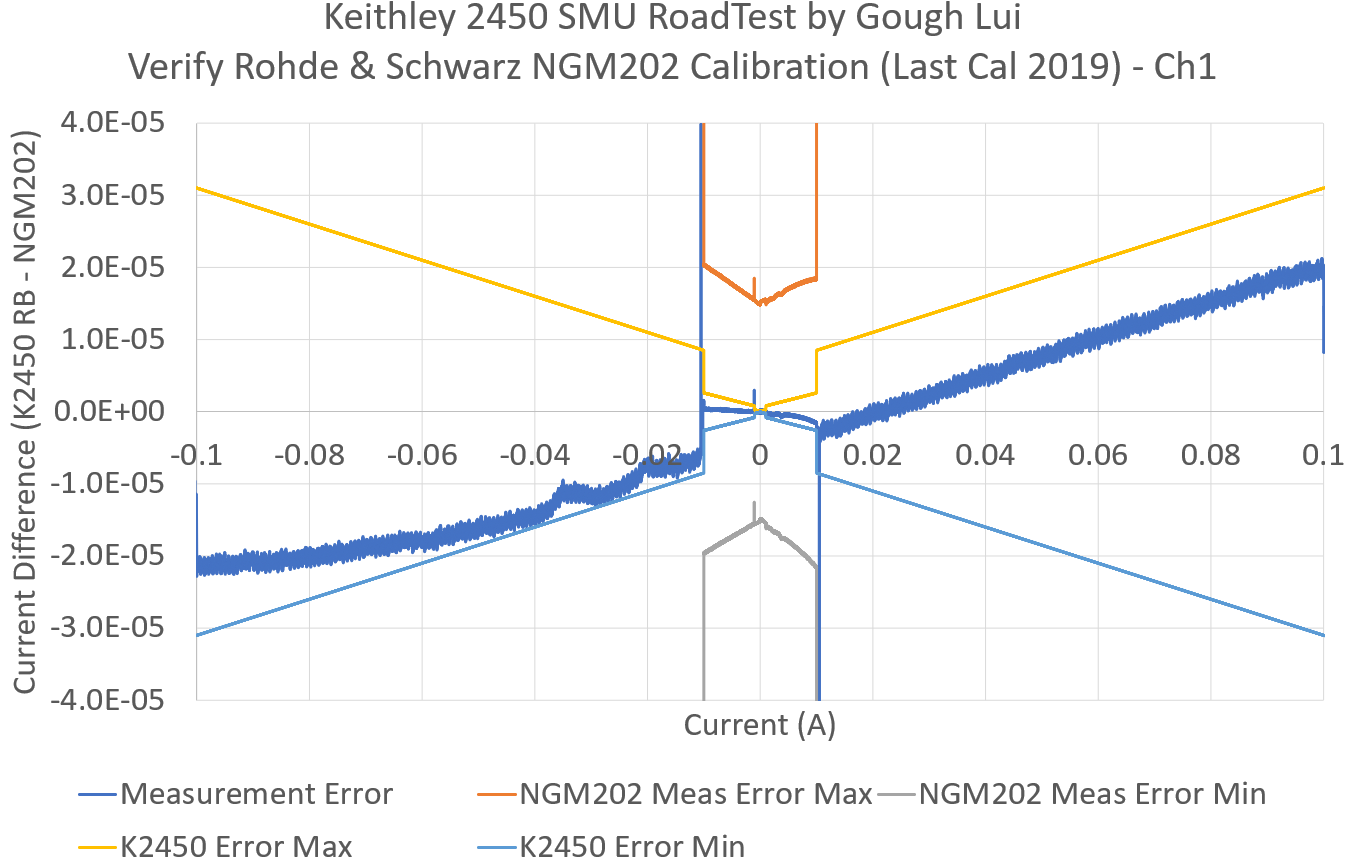
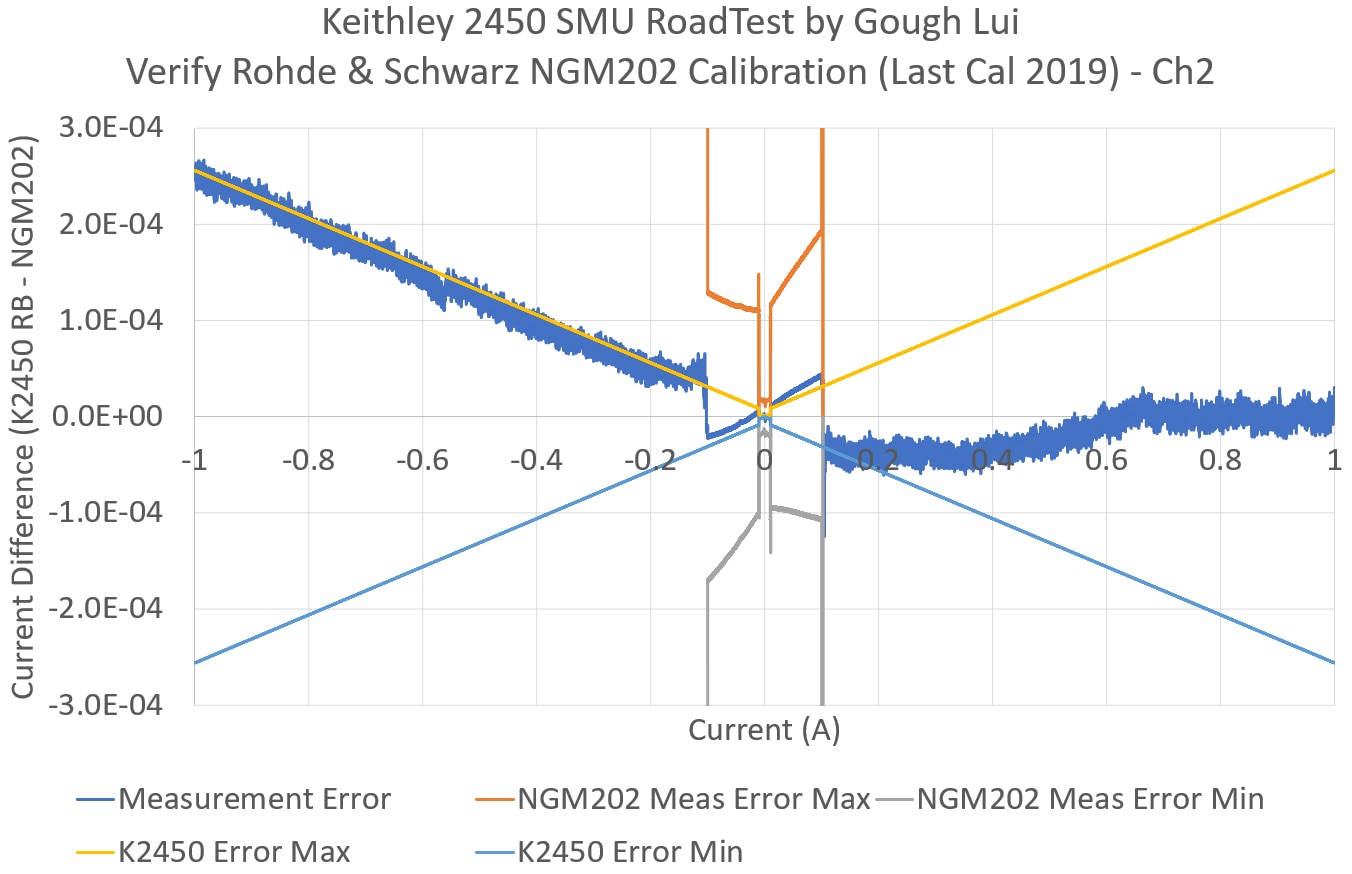

The effect of range changes on the error can be seen clearly in the zoomed-in graphs for Ch1 and Ch2 which show very similar trends. While the voltage is perhaps slightly less accurate, the current measurement on the NGM202 appears just fine.
Conclusion
In a process akin to introducing a new pet into the family, the Keithley 2450 SMU was given a gruelling initiation to the home lab, by being tested over a period of about a month and a half of 24/7 operations. This allowed me to cross-check the calibration of my devices, all of which are “out of calibration”, with the fresh calibration of the 2450. It also allowed for comparison of pre-repair and post-repair results. In the end, it was found that the 2450’s performance was essentially unchanged after the repair process, with the performance far-better than the accuracy specification limits. Deviation trends were consistent, suggesting to me that the calibration was either unaffected by the repair (resulting in a “verification” of the previous calibration) or the calibration process was so consistent that the resulting effect is that the output has the same characteristics.
It was also a good exercise to verify the equipment I use regularly on RoadTests and other reviews, to provide confidence in the readings. Despite the equipment not being calibrated since manufacture, it seems my equipment is as accurate as I expected, so I can sleep soundly at night knowing that I’m not coming to the wrong conclusions due to bad test equipment. Of course, I do have plenty of other metrology equipment, but most of them are 4-digit or below in terms of accuracy, meaning they can easily be cross-checked with the equipment above.
Now that I know the 2450 is all good (and my other equipment is too), I’ll be getting onto doing some actual experiments with the 2450. I’ve already begun – but on my own personal blog – showing a proof-of-concept of using TSP scripting to turn the 2450 into a battery simulator including the source code and a short demonstration video. More will be forthcoming on element14 when I have the time … stay tuned!