


What is the Keithley 2450 SMU like to use and what do I think of it? This blog looks at the process of getting up-and-running with the 2450 SMU, the user interface and features, my opinion on the user experience, the quality of the documentation and a short experiment involving battery discharge and logging.
Initial Setup & Firmware Upgrade
Initial setup of the 2450 SMU is very simple – it’s pretty much as close to plug-and-play as possible, as there are no voltage selectors to worry about on the mains input, being a “universal” input device. Plugging it in and pressing the main power button in the bottom left, the unit springs to life.

Boot-up is relatively brisk, taking around 12-seconds from pressing the button to having the first readings on the screen.
While the unit is basically ready-to-go at this stage, it is important to consider performing a firmware update to bring the latest fixes and capabilities to the device.
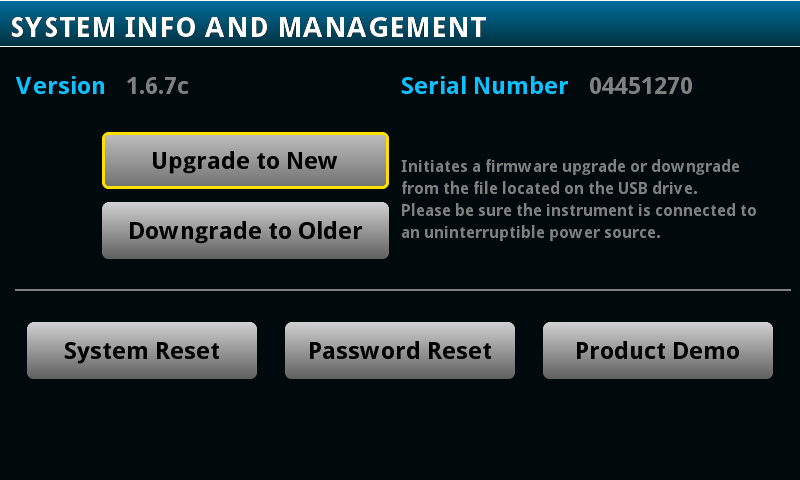
As shipped, this unit has firmware 1.6.7c which is several revisions behind the present 1.7.1e which is necessary to support I-V Tracer.
The process is simple, consisting of downloading the firmware from Tektronix’s website, unpacking the .upg file to a FAT/FAT32 formatted USB flash drive, inserting that into the 2450 SMU and selecting “Upgrade to New”. The process takes a few minutes and can be seen in the following video.
After being prompted to reboot in the final step of the firmware upgrade procedure and then restarting the unit, the unit is operating on the latest 1.7.1e firmware. A similar procedure can be used to revert back to an older version of firmware by instead using the “Downgrade to Older” button and having the older firmware on a connected USB flash drive.
User Interface Features
The default screen after booting looks a little like this. It can be returned to at any time using the “Home” key.

While it looks simple, it’s actually packed with lots of useful indications and shortcuts. Along the top bar, it indicates the source of control (Local), the recording memory buffer (defbuffer1) and its status (about 25% full), the currently running script (No Script), the trigger status (continuous measurement) and errors/warnings (none). The reading for the measured function appears above, with the sourcing function below. Range changes can be effected by pressing on the button next to the currently listed range, while sourcing limits can be immediately configured below.
The bottom half of the screen is called the “swipe” screen – this is because it can be toggled between a variety of views including statistics, programmable text, numerical readings, settings shortcuts and graphs. In the top right corner of the swipe screens are short-cut buttons to bring up the full settings or feature dialogues, thus saving users from having to navigate the main menu. This example is a good illustration of how the user interface tries to balance features with ease of use.
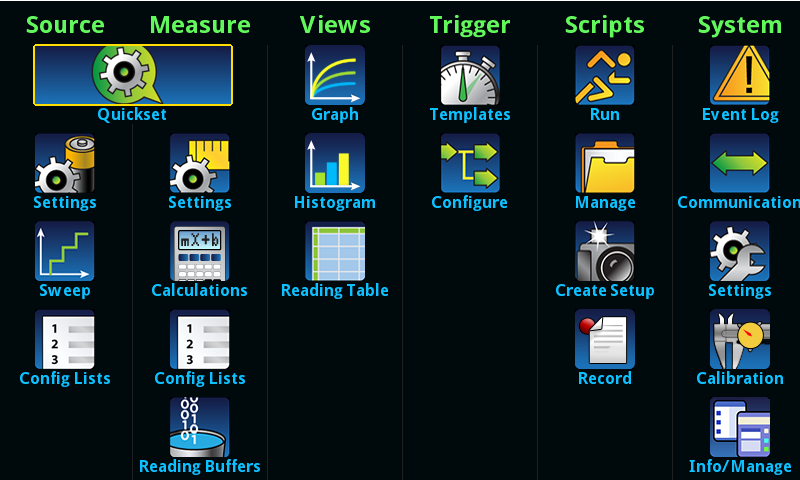
The main menu of the instrument can be invoked with the “Menu” key. Instead of featuring a scrolling menu as many other instruments tend to have, the menu consists of a single screen of icons, separated into vertical groups of Source, Measure, Views, Trigger, Scripts and System. This layout is quite logical and allows for rapid access of features, although the text on this main menu can be a hair on the small side for some users.
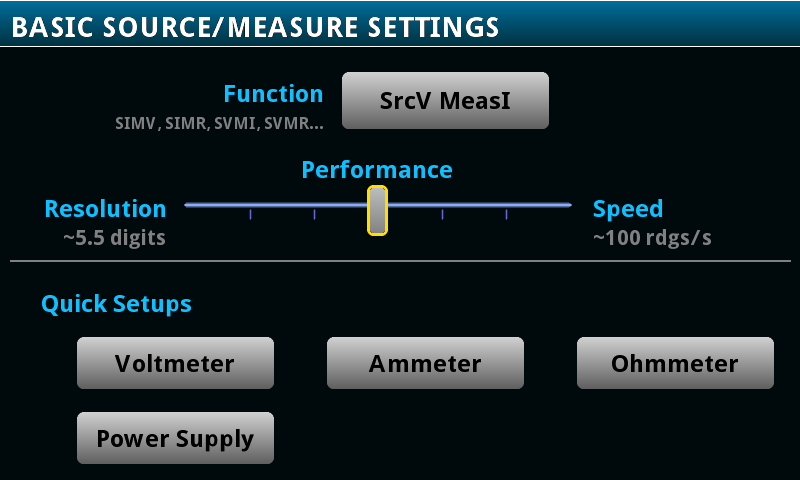
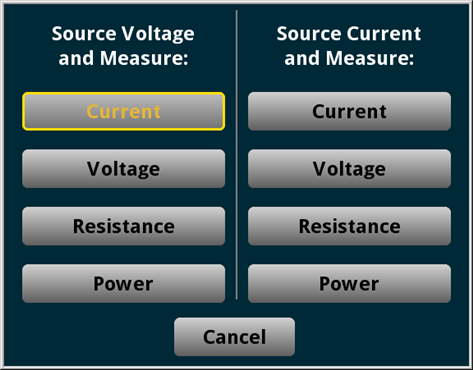
The Quickset menu, for example, illustrates most of the UI elements used. This includes relatively large buttons with bold text which make the touch-user interface easy to use. This menu allows the user quick access to select the sourcing function, configure the PLC and averaging for speed/resolution trade-off, or choose presets for various commonly used instrument configurations of voltmeter, ammeter, ohmmeter and power supply.
The source settings and measure settings provide deeper configuration of the sourcing and measuring functions. The sourcing functions are commonly abbreviated with four/five letters in the top right of the interface – S?M?, short for Source (something), Measure (something). It is possible to source voltage (SV) or current (SI), while measuring current (MI), voltage (MV), resistance (MI(Ω)) and power (MI(W)). Tapping on this text allows it to be rapidly changed.
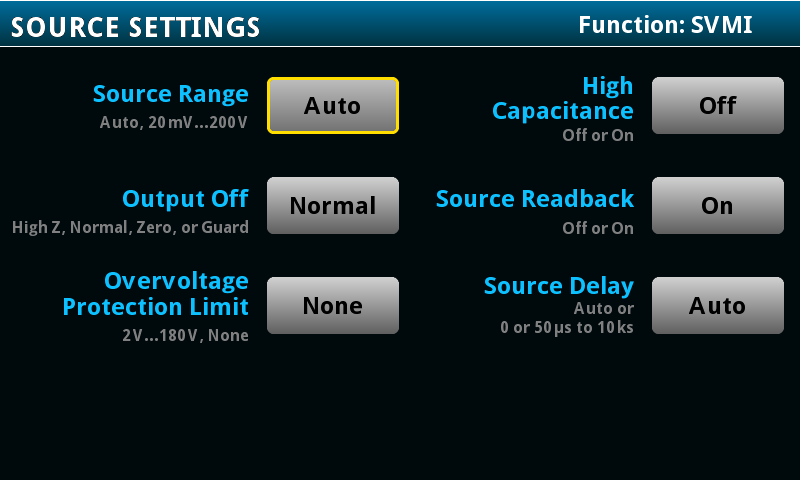
Source settings allow for configuration of source range, high capacitance mode, output off mode, source readback, overvoltage protection limit (OVP) and source delay. These settings can be quite useful – high capacitance increases the time between source and measurement to allow for the reading to settle, whereas output off mode is especially important when connected to sources of energy (e.g. battery) to ensure they do not cause unnecessary current flow into the SMU when powered off. The source readback option allows for measuring the actual source value which increases accuracy (as the specification for the metering is slightly better than sourcing), while the OVP feature allows for protection of the connected DUT by choosing OVP values from a fixed set of values.
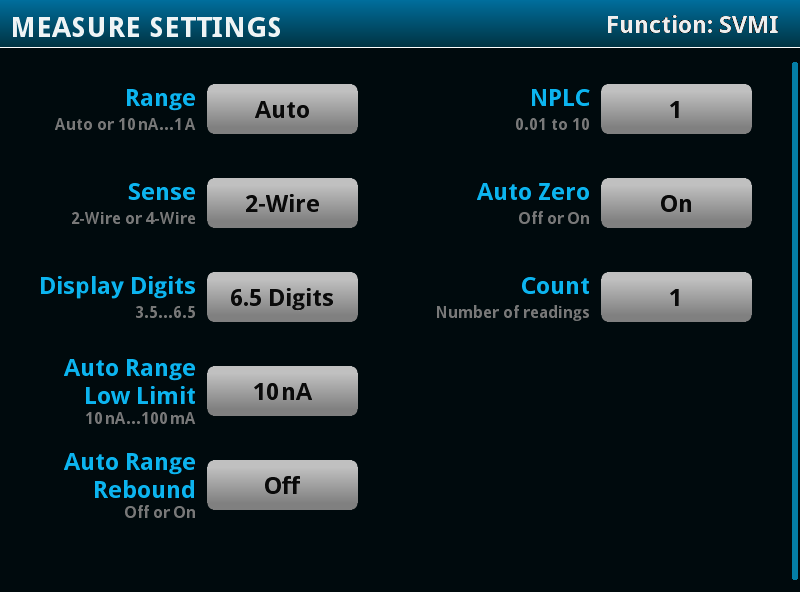
Measure settings similarly allow for configuration of measurement range, powerline cycles (NPLC), sense mode, auto-zero, display digits, count, autorange-low limit and autorange rebound. This allows for a speed/accuracy trade-off with the NPLC, count and auto-zero settings, while the auto-range limit and rebound settings allow for fine-tuning of the auto-range behaviour to avoid stepping into ranges that are too low. Manual configuration of the two-wire or four-wire sensing mode in this dialogue is an important parameter especially for making precision measurements – unfortunately, this is not automatically sensed.
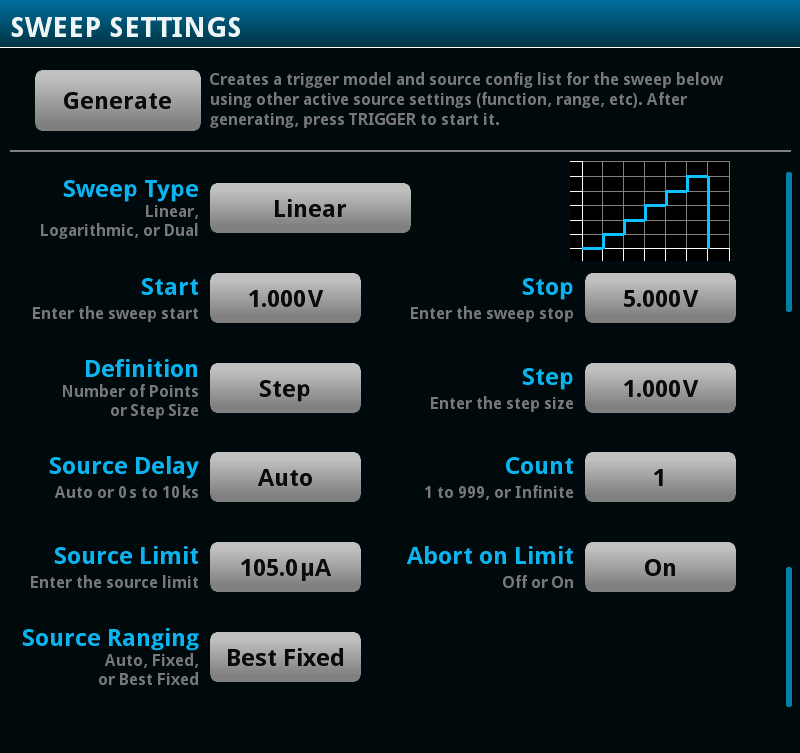
The Sweep selection on the main menu leads to a very powerful menu that allows for automatic generation of a TriggerFlow graph that implements various types of sweeps. This, combined with graphing, allows the 2450 to perform various types of I-V or V-I sweeps without the need for a computer. The sweep generator allows for configuration of the sweep type, start, stop, number of points/steps, delay, count, limit, abort and ranging.
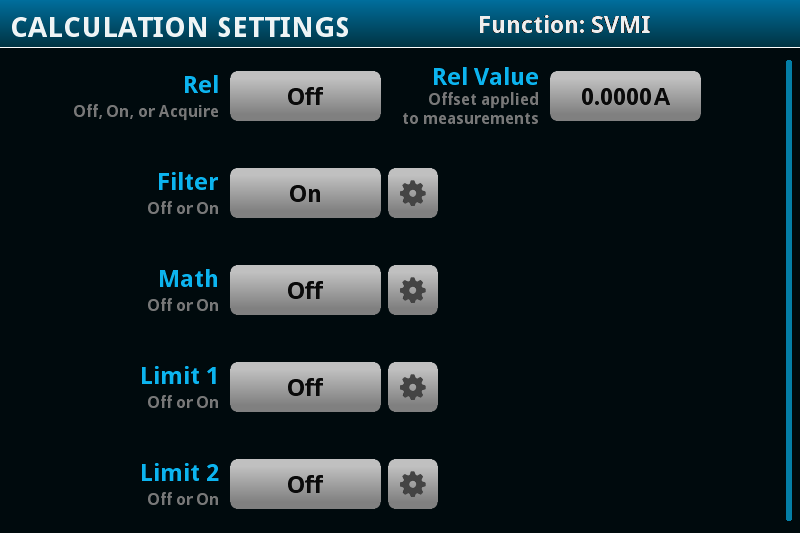
The Calculations selection allows for configuration of calculations performed on measurements, which includes offset, filter, math and limit values.
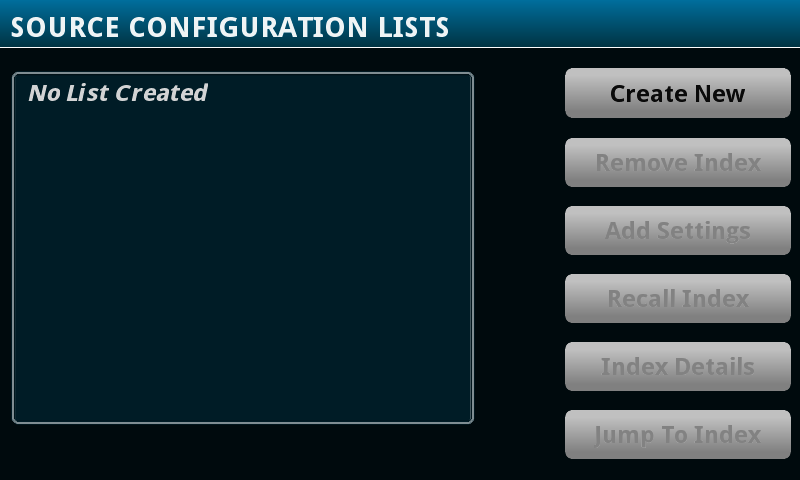
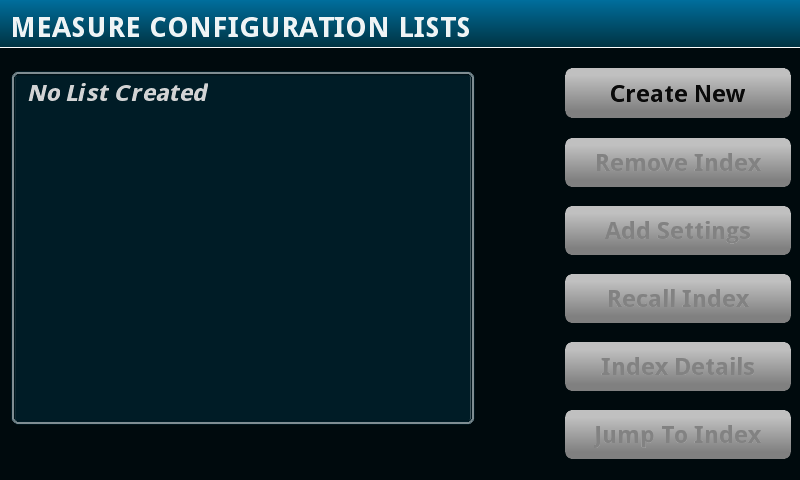
Both source and measure have configuration list features, which allows for an “indexed” array of settings to be stored for sourcing and measurement. This allows for recalling the setup, which is especially useful when working with TriggerFlow graphs.
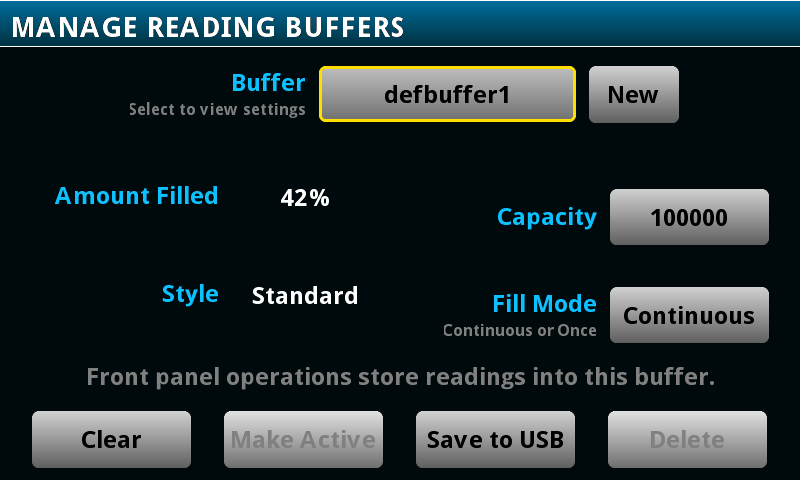
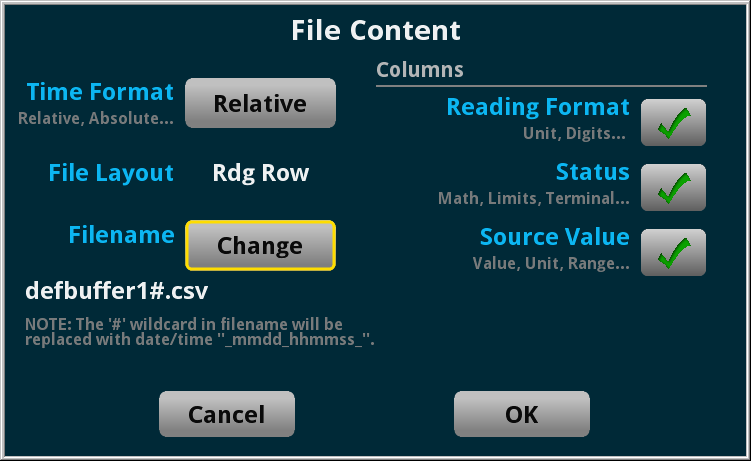
The reading buffers screen allows for management of the reading buffers. This is memory which is used to store readings made by the instrument, which can be graphed or exported to USB through this screen. The name, type of buffer, fill mode and capacity can be configured, with multiple buffers possible up to the memory capacity of the instrument. The data can be exported to an attached USB drive in .csv format with the ability to deselect certain metadata columns.
Views
The views section of the main menu allows for accessing the various onboard features to visualise the measured data.

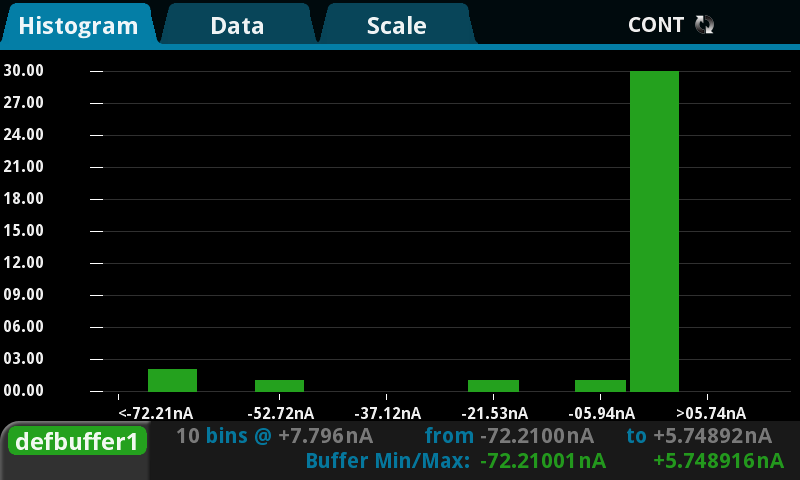
Two main types of graph are available – a line graph or a histogram. Interaction with the graph through the touch-screen is possible, which allows users to intuitively pinch to zoom and pan the graph. Reading values are summarised at the bottom.
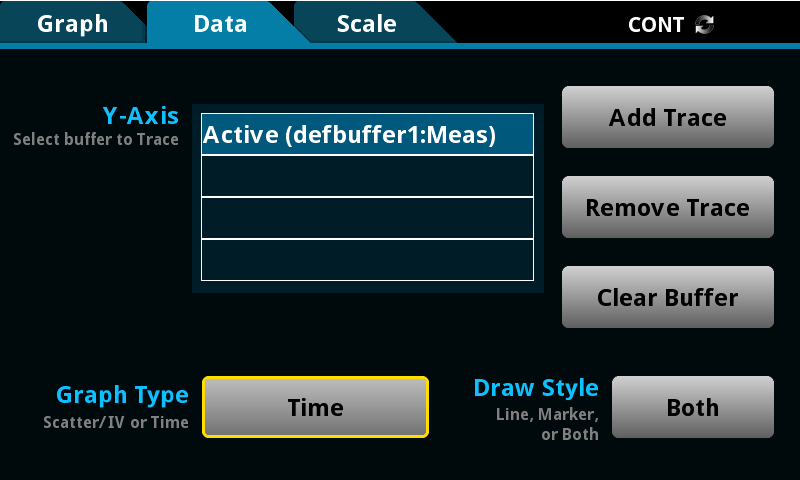
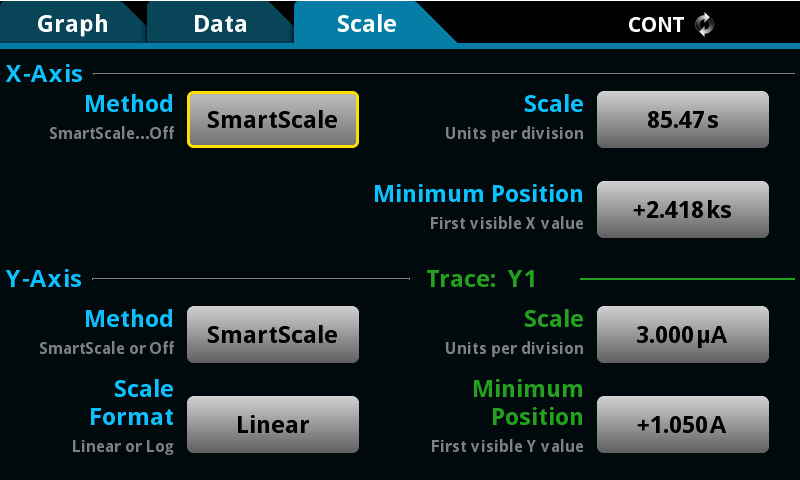
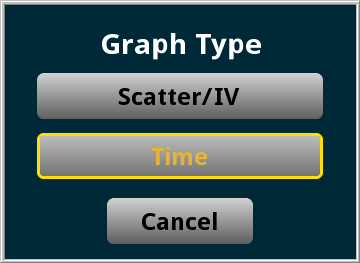
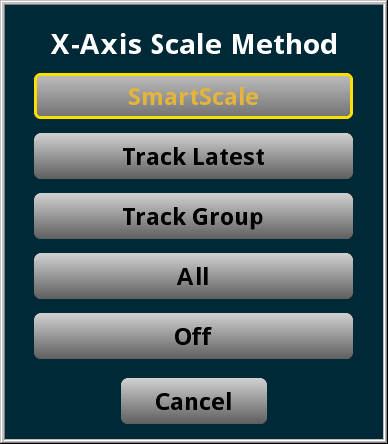
The Data tab allows for selecting the data sources, clearing the buffer and adding additional traces. Depending on the graph data, either a Scatter/IV graph or Time graph can be selected. The Scale tab allows for configuring how the X and Y axes are scaled, with a number of predefined methods that allow for plotting all, or some of the data.
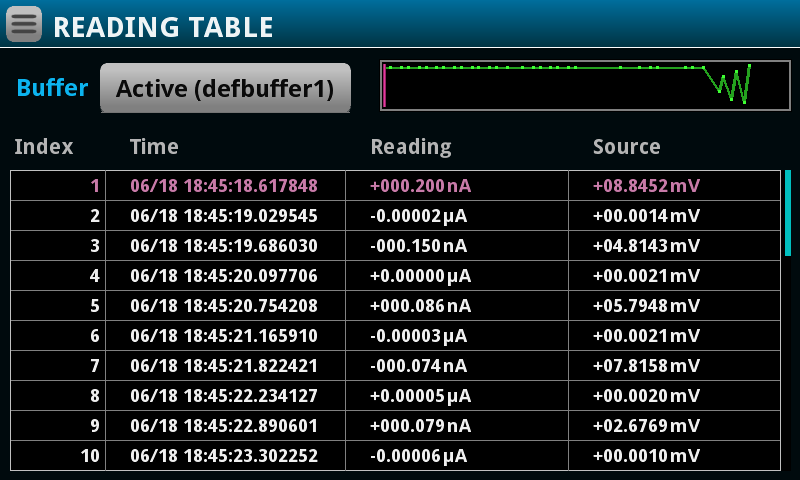
Finally, for those who don’t like having graphs at all, there is the plain old reading table which allows for scrolling a list of values instead.
TriggerFlow
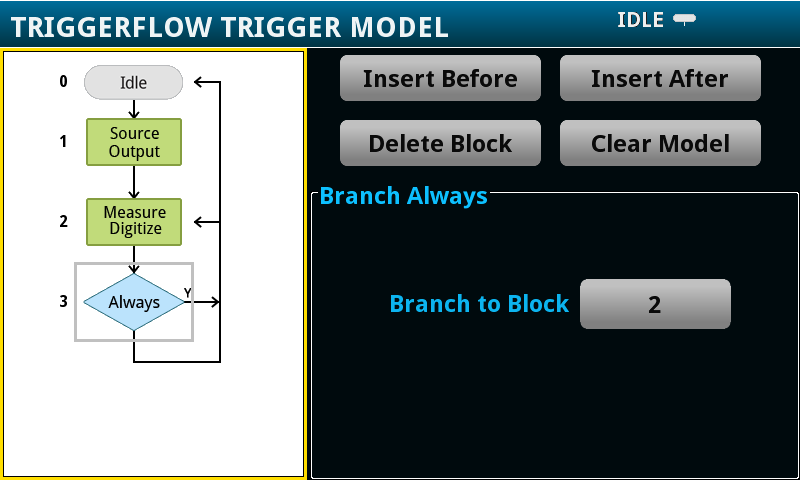
The trigger section of the home screen is dedicated to the TriggerFlow system, which is both powerful and slightly complex, so I decided to break this out into its own section. TriggerFlow can be thought of as a “graphical” flow-chart style programming system that allows the 2450 SMU to perform certain actions upon receiving a trigger. To help users get started, various trigger templates are pre-defined and can be recalled from the Templates selection.
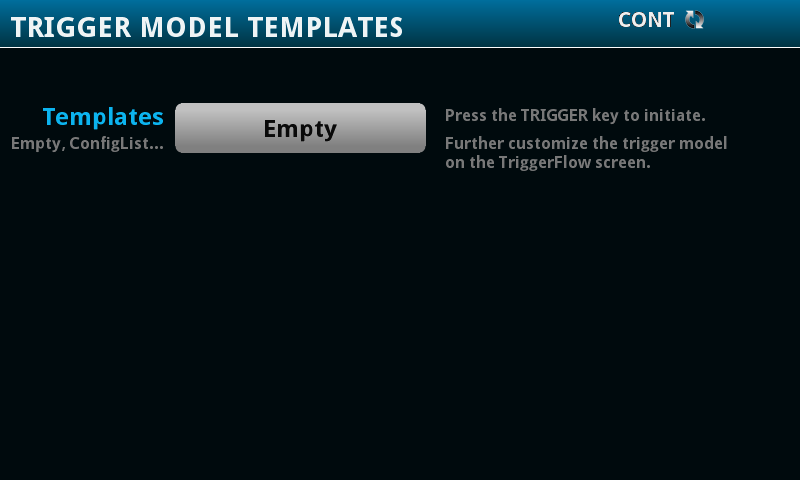
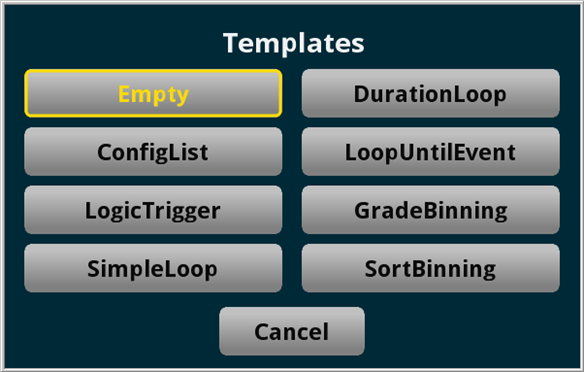
These templates cover a range of common application tasks and can be further customised in the Configure selection which brings up the graphical TriggerFlow model editor.
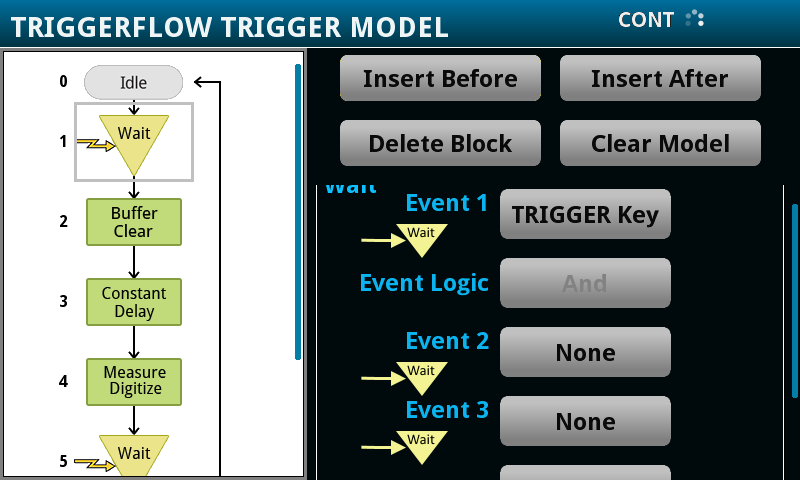

With this editor, it is possible to select and configure options of each block – in the case, the “wait” block. It is possible to add blocks to the model as well, categorised into four different types.
[k2450-trgflw-blocks2][k2450-trgflw-blocks3][k2450-trgflw-blocks4]
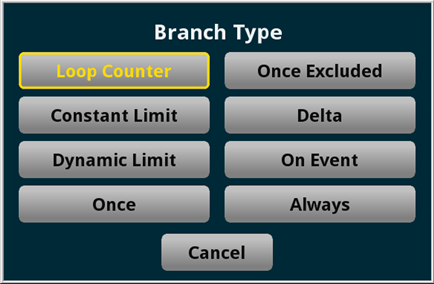
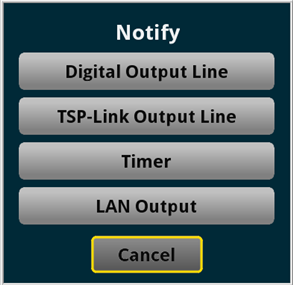
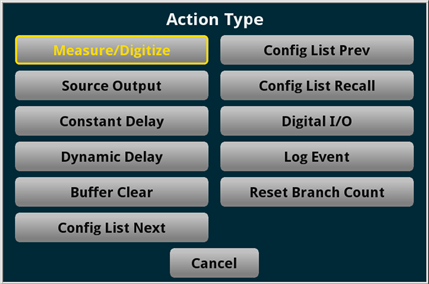
Each of these blocks have further sub-types which provide a lot of versatility to perform different tasks and even interface with other equipment.
I found this initially to be somewhat overwhelming at first, as I am more used to a code-based programming paradigm, but it did not take long to adjust and create some simple TriggerFlow setups for testing the Digital I/O capability. However, for those who like code-based programming, the TSP Scripts capability on the 2450 SMU caters exactly to that.
TSP Scripts
The Test Script Processor (TSP) scripting feature of the 2450 SMU allows for running Lua-based scripts on the SMU itself, allowing it to autonomously make repetitive measurements, execute conditional code, save data to USB, communicate with other LAN/TSP-Link instruments and more. I go into more detail about this capability in the later chapter looking at remote control and programmability.
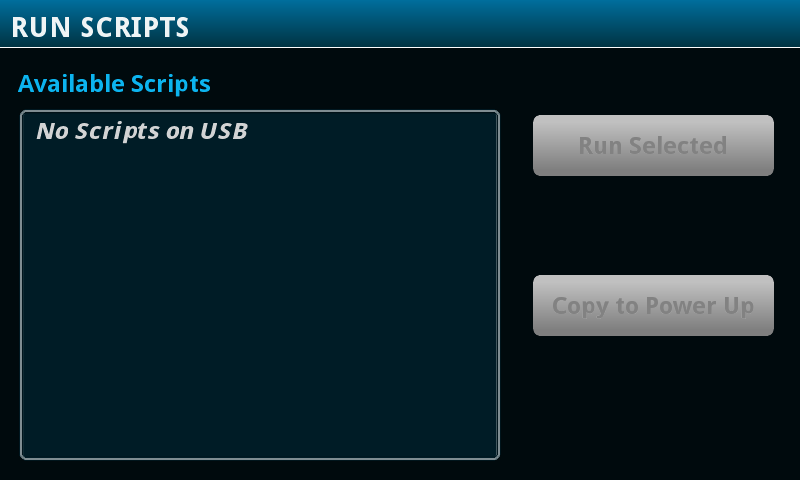
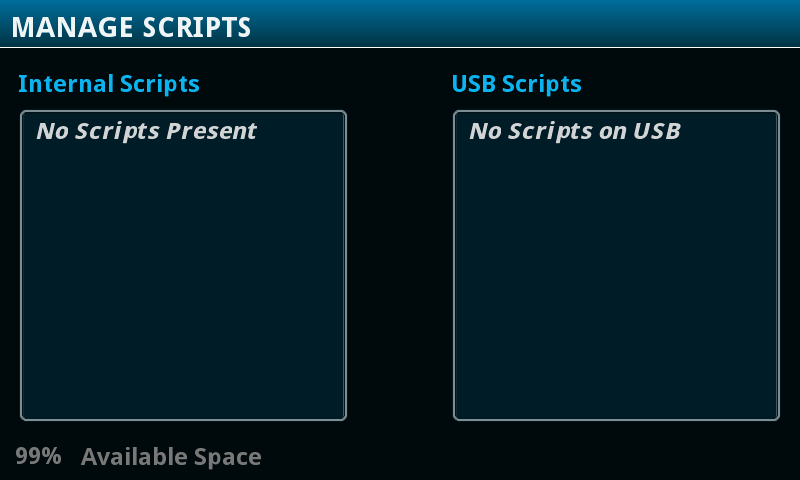
The Run and Manage scripts selections allow you to browse for, run and copy scripts between external USB storage and internal storage. Scripts can also be rapidly accessed from the top bar of the main display, by tapping the area where it normally says “No Script”, allowing rapid selection of scripts for execution without rummaging through these menus.
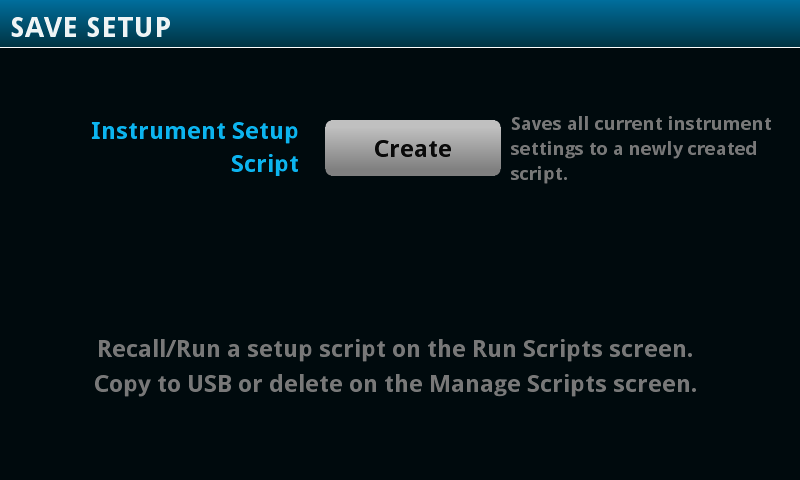
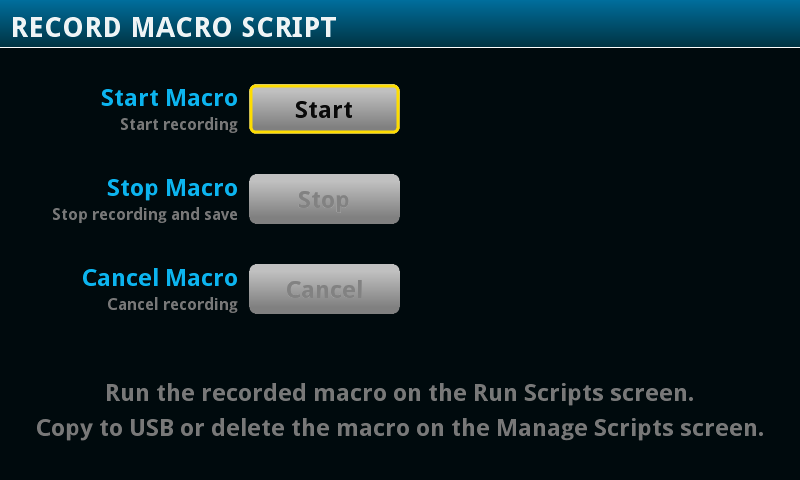
As it turns out, the 2450 SMU actually uses these Lua-based commands internally, so it is possible to save the instrument setup into a script that will restore it when executing the script. It is also possible to use the macro script recorder to record a sequence of actions into a script file. These script files can be edited, but also contain SMU-specific internal function calls which should not be edited.
System Settings
The System column of the home screen provides access to various screens which allow for debugging, configuration of communication and instrument settings, access to calibration data and firmware updates.
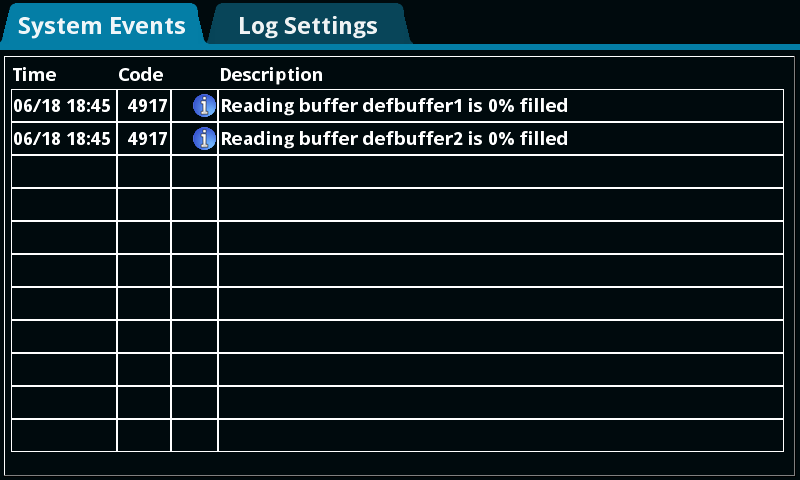
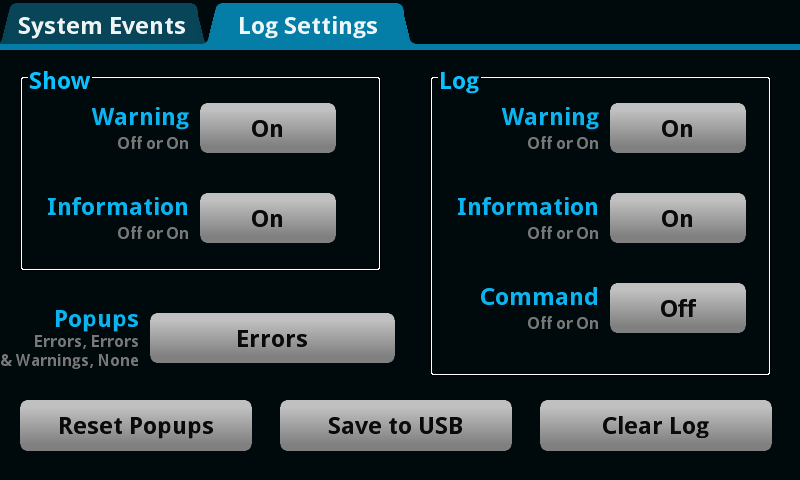
The Event Log keeps a running list of the information, warning and error messages generated by the instrument over time, which helps with debugging and understanding various instrument conditions. Many of these messages can result in the generation of prompts, which can seem a little overwhelming at times. Thankfully, in the Log Settings tab, the behaviour can be altered to reduce the number of alert pop-ups you might see and reduce the level of noise in the logs. The logs can also be saved to USB for diagnostic purposes.
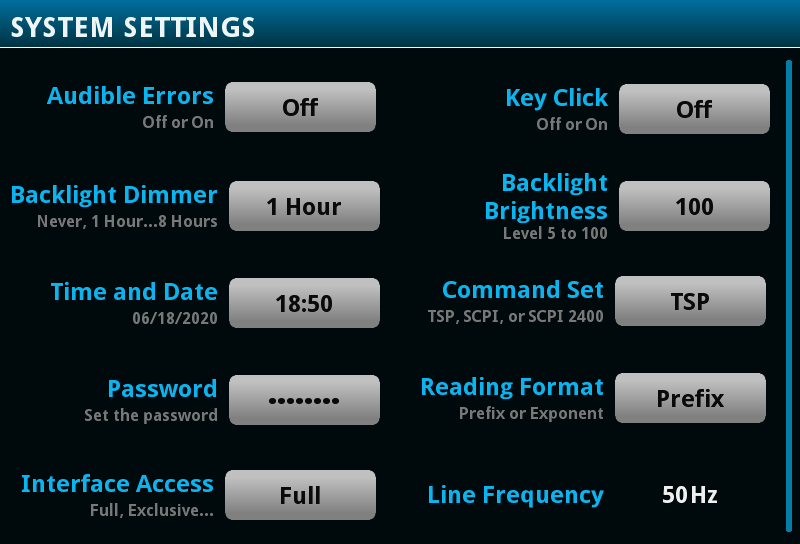
The Communications screen allows for configuration of address parameters related to the various configuration interfaces. System settings allow for configuring some useful options including audible errors and key click noises which can make the SMU “quieter”, as well as the backlight dimmer and brightness options which can extend LCD screen life. Time and date features, interface command set, password locks and reading format can be configured as well.
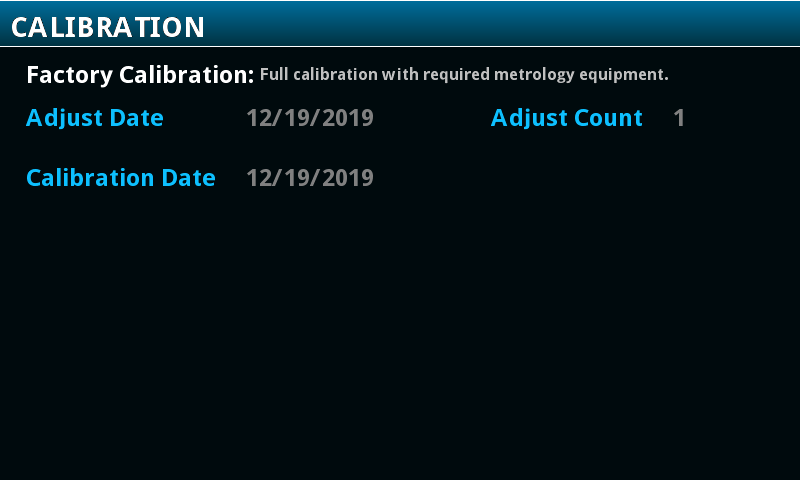
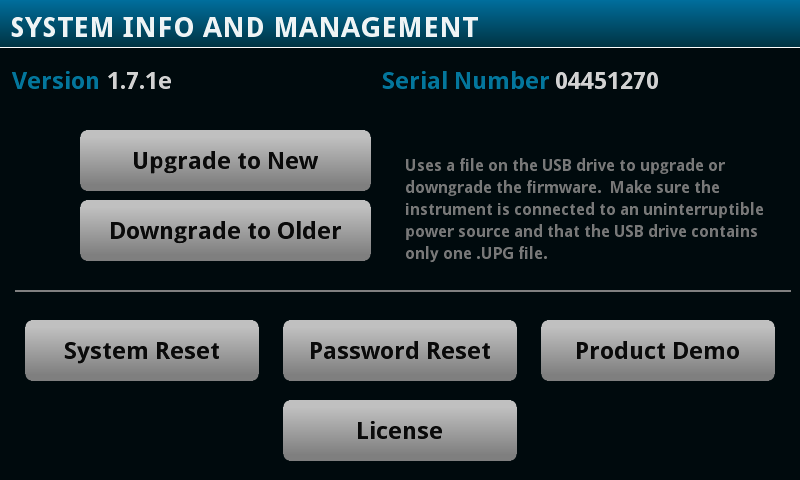
Calibration allows the user to access the date and time and adjustment count at the last calibration of the instrument, but no further details are available. Finally, the Info/Manage screen allows for upgrading and downgrading firmware, resetting non-volatile instrument parameters, various product demos and access to the license agreement.
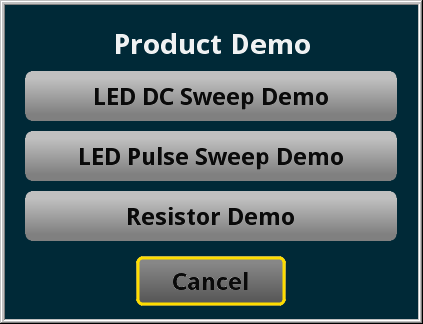
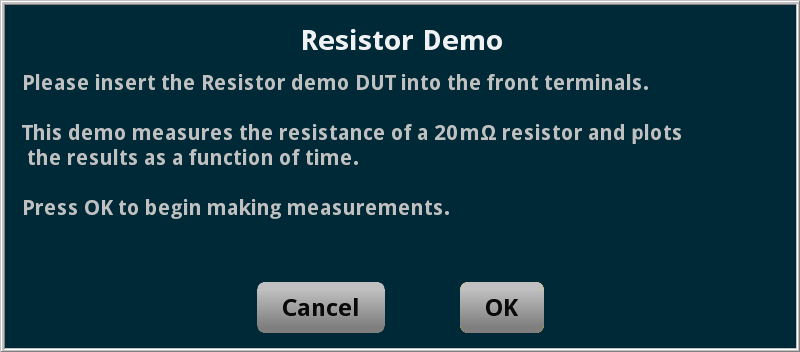
It seems three product demos are available, including LED DC Sweep Demo, LED Pulse Sweep Demo and Resistor Demo. These are designed for use with their demonstration DUTs and pre-configure the instrument to perform various sweeps and graphs. This just about covers everything there is to know about the user interface.
User Experience
As the 2450 SMU is a very flexible and capable device, I found the interface to be a little intimidating at first. The view of the main menu having so many icons and the presence of so many shortcuts seemed perplexing at first, but it was easy to learn and adjust to. Very soon, I became accustomed and even fond of the interface, as it makes it much quicker to navigate to important settings without needing to scroll through lists of menus and without needing to traverse several layers. The basics are definitely easy to pick up and the ability to visualise data and record data on the SMU itself is a big bonus when running experiments without a PC. The ability to use multi-touch gestures to interact with on-screen graphs also provides an easy way to navigate the data and see fine detail despite the limited size and resolution of the screen. The ability of TriggerFlow to provide a form of graphical flow-chart style programmability is also an asset, making it easy to automate the generation of complex waveforms, record data and run experiments with conditional branching. It is, however, another powerful feature that felt a little overwhelming at first. As more of a coder, I preferred the TSP scripting alternative, which allows for authoring scripts on a PC that can be executed on-device. In all, the flexibility of the 2450 SMU is quite unique compared to all of the instruments I have used to date which definitely increased the learning curve somewhat.
The interface does, however, require a mixture of both touch and button interaction to achieve all the functionality. By comparison, use of the rotary encoder seems mostly optional, without many functions (except the I-V Tracer app) strictly requiring its use from my experience. It would have been nice to make things touch-only, but that may have increased on-screen clutter. The one thing I find a little difficult is that screenshots are invoked with a two-button press of home and enter, which can be a bit fiddly. Accessing the instrument by LAN remote front panel to save screenshots is a simple workaround.
My main complaint would probably be the quality of the LCD display and protective plastic layer which sits above it. The LCD appears to be a TN type, with a more limited viewing angle which makes it harder to view especially if you’re looking down toward the screen. As the stand is limited to just one angle, this is difficult to optimise. When combined with the slightly matted plastic front layer which seems to have a repetitive spotty pattern, it makes things a little more difficult to see as it reflects the glare from the room lights and reduces the display contrast even with the brightness at 100%. Other instruments with similar sized screens (e.g. R&S NGM202) have a far more contrasty display with a wider viewing angle, although considering the age of the 2450 SMU’s design, this is perhaps to be expected. Again, the presence of a competent LAN remote front panel implementation eases this complaint somewhat.
By default, the unit seems a little excessive when it comes to warning and error pop-ups. While helpful during initial familiarisation with the unit and configurable, there is this instance of Warning 5074 regarding the output voltage limited by interlock that threw me for a loop for a bit.

While the documentation states that sourcing 42V should be possible without the interlock asserted, attempting to source 21V or above results in this warning message. It was only after a bit of head-scratching that I realised that while this error message appears, the output is operating correctly and sourcing the right voltage. I’ve asked Keithley/Tektronix to look into it and whether it would make more sense for this message to show for an attempt to source 42V or more.
The use of high-impedance output off mode and four wire sensing results in the disabling of continuous measurement. This is likely because the measurement circuits are disconnected from the output when the output is turned off. But when the output is turned on, the measurement does not automatically restart – as noted in the following section. While it may be possible to work around with TriggerFlow, not having it automatically return to continuous measurement with the output on makes things a little less convenient as the user is essentially “blind” to the output value while they fumble to change the trigger mode (assuming they haven’t programmed a TriggerFlow like the case below and instead use the Trigger key instead to activate the output, but with limitations on front panel interaction while the model is running).
However, on the whole, I think the interface definitely achieves a good balance between flexibility and ease of use, making it easy to adjust to for beginners and efficient for experienced users.
Experiment: Battery Discharge & Logging
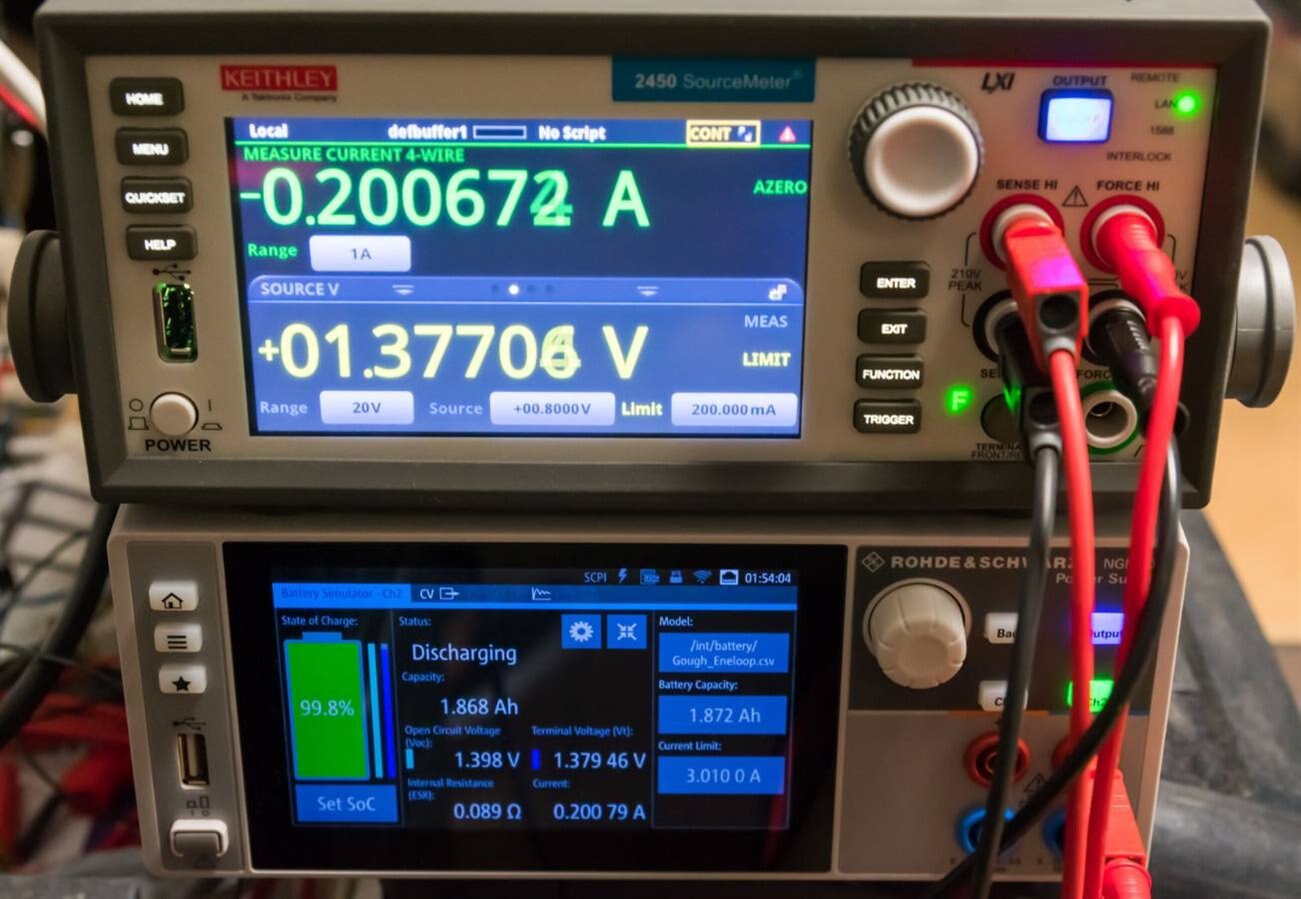
To illustrate the power of the 2450 SMU even when operating standalone on the bench, I decided to run a battery discharge test. However, instead of actually discharging a real battery which can be quite “fickle” and can change in behaviour from cycle to cycle, I decided to enlist the help of the Rohde & Schwarz NGM202’s Battery Simulator option along with a battery model I created from testing a Sanyo Eneloop AA cell. This would provide a stable “battery” for the 2450 SMU to discharge. The image below shows the setup during initial testing – the final test was done with different values.
Heeding the advice of the manual, the output off mode is set to high impedance to use the internal relay to isolate the inputs and avoid a case of current being drawn while the unit is not sinking. The appropriate ranges are configured, four wire sensing is employed, the current limit is set to 500mA, the buffer is cleared and the output is turned on and continuous measurement mode is (nearly) immediately engaged. Once the battery was “discharged” with the voltage hitting 0.8V, I exported the buffer data to a USB flash drive.
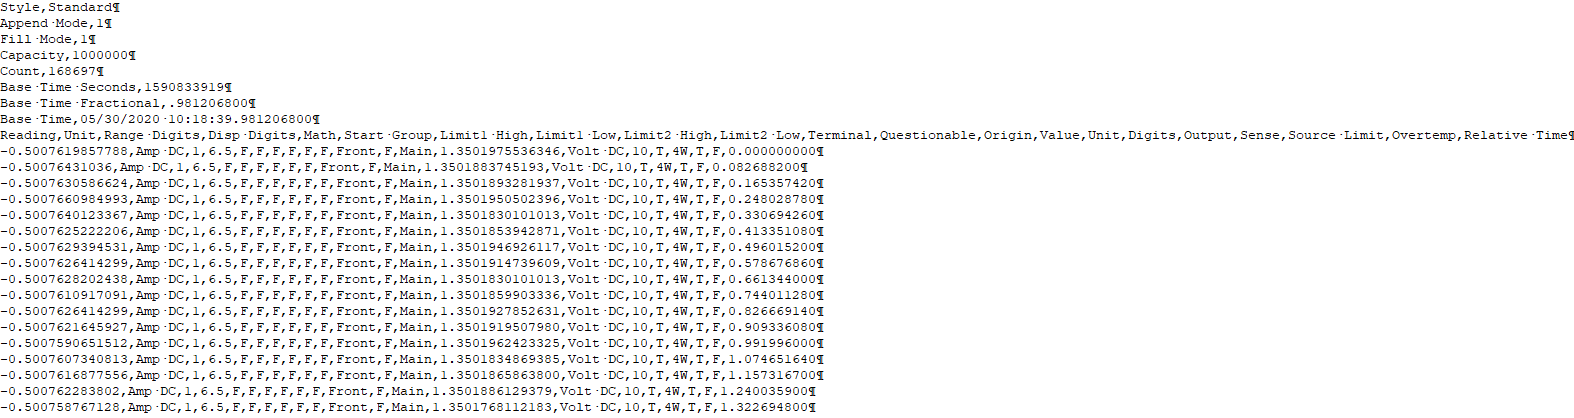
The format of the data includes a header and various fields which describe the configuration, time and values. Very useful and makes calculation of discharge energy much easier – especially the relative time column.

The results were quite amazing to say the least. The simulated battery capacity is 1868mAh, while the computed capacity from the 2450 SMU is 1866.272mAh. The slight (1.728mAh) discrepancy is well within expected error margins of the NGM202’s sourcing capabilities (expected within 9mAh), but part of this is definitely to do with the short amount of time taken between turning the output of the 2450 SMU on, and engaging the continuous measurement feature.
Perhaps if I set a TriggerFlow setup to enable the output and perform continuous measurement using the trigger key or external trigger, that would have avoided this short lag. But it didn’t occur to me at the time of testing – after all, the presence of a large data buffer and the ability for onboard processing is quite different when compared to conventional power supply instruments.
Documentation
The 2450 SMU is supplied with a small plastic-spiral bound quick start guide, with the remainder of the documentation accessible online. The main documentation regarding the 2450 SMU includes a datasheet, user manual, reference manual and security/declassification procedures. The quality of the documentation is excellent, being clear, free of errors (that I could see) and sufficiently detailed. The division between what goes into the user manual and the full reference manual is also well done, such that users who choose to consult the user manual need not be burdened by the full details of SCPI/TSP command listings. Regardless, it is good to see all the commands clearly documented, some with examples, in the reference manual which helps users who are new to the instrument and SCPI/TSP command-sets to rapidly get up and running.
Additionally to this, Keithley/Tektronix also provide quality reference materials regarding making low-level measurements which proved to be quite informative and a great introduction to the intricacies involved and the relative strengths and weaknesses of different types of instruments.
Conclusion
The 2450 SMU is about as easy to set-up as an instrument can be – its universal voltage input means that it’s basically plug-and-play. Initial set-up included firmware updating the unit from 1.6.7c as shipped to 1.7.1.e which supports I-V Tracer and contains a number of improvements. From there, it was easy to get going.
The user interface consists of a touch-screen interface with buttons flanking either side, the use of both necessary to navigate all of the features. While the main screen looks basic, it is actually packed with features and shortcuts allowing for efficient access to the main settings screens without having to access the main menu. The design of the main menu as a single page with no scrolling makes it easy to navigate the instrument’s full suite of settings at a glance. The instrument’s configurability is quite varied, with the ability to configure sourcing and measurement separately, the ability to visualise data onboard the device and execute actions using TriggerFlow graphs or TSP scripts.
At first, the interface felt a little intimidating, but it was easy to adjust to and proved to be quite likeable, finding a good balance between ease of use for the beginner and flexibility/efficiency for the power user. My main complaint would lie in the quality of the LCD display which appears to be a TN type, with a more limited viewing angle which makes it harder to view especially if you’re looking down toward the screen. When combined with the slightly matted plastic front layer which seems to have a repetitive spotty pattern, it makes things a little more difficult to see as it reflects the glare from the room lights and reduces the display contrast even with the brightness at 100%.
The other thing of note is the default setting of warning alerts seems to be a little excessive – the interlock warning for example proved to be rather surprising as it was triggered when attempting to source more than 21V, even though it is possible to source 42V without asserting the interlock according to the manual. This proved to be confusing and I have suggested it be looked into for a change. Likewise, there are also limitations to how the SMU handles high impedance output mode and four-wire mode which results in disabling continuous measurement mode which is not automatically re-enabled when the output is enabled.
Executing a battery discharge test was easily accomplished using the SMU alone. Discharging a simulated AA Sanyo Eneloop cell on the R&S NGM202’s Battery Simulator option resulted in a capacity value within 2mAh with an expected sourcing error of around 9mAh, which was extremely impressive.
The full documentation for the SMU can be accessed online, split into a datasheet, user manual, reference manual and security/declassification procedures. The quality of the documentation is excellent, being clear, free of errors (that I could see) and sufficiently detailed. The division between what goes into the user manual and the full reference manual is also well done, such that users who choose to consult the user manual need not be burdened by the full details of SCPI/TSP command listings. Additionally, Keithley/Tektronix also provide quality reference materials regarding making low-level measurements which proved to be quite informative and a great introduction to the intricacies involved and the relative strengths and weaknesses of different types of instruments.
---
This blog is part of the Keithley 2450 SMU with I-V Tracer RoadTest.