


As an oscilloscope is a very sophisticated device, there are only a limited set of tests that someone like myself without a calibration lab can perform. Nevertheless, they have all been grouped together and reported in this blog.
Front-End Noise
Everyone always asks, what is the front-end noise of the channels? Leaving the BNCs open, I use the highest sensitivity, at the highest bandwidth and sampling rate, for the longest record length to compute statistical results for peak-to-peak and RMS values. Due to the interleaved nature of the MSO24’s ADCs, doing two channels at a time provides the best results. Also, do consider that this is taken in a home environment where there are some sources of RF (e.g. Wi-Fi access points, switch-mode power supplies) which may cause the reading to be higher than in a pristine lab. Signal Path Correction (SPC) was performed immediately before this experiment.

Channels 1 and 3 show an average peak-to-peak of 3.0661mV and 3.1241mV respectively. The RMS values are 289.30µV and 290.96µV respectively.

Channels 2 and 4 report a peak-to-peak of 3.0624mV and 3.2215mV respectively. The RMS values are 288.53µV and 299.46µV. There are some variances across the board, but not significantly. This seems like a fairly typical performance for an 8-bit oscilloscope.
For those who are interested in band-limited noise performance (as some measurements don't require the full bandwidth and some oscilloscopes automatically engage a bandwidth limiter for their most sensitive vertical scale), I've engaged the 20MHz bandwidth limiter for the following measurements.


With 20MHz bandwidth limit on all channels, the peak-to-peak noise is 781.40, 787.76, 775.50 and 779.24µV respectively. The RMS values are 84.446, 82.324, 82.403 and 83.397µV respectively.
Channel-to-Channel Skew
After SPC and probe alignment, I checked the channel-to-channel skew using the visual method on the inbuilt probe compensation waveform.

From far away, the skew looks well matched – the waveforms are practically co-incident.

Zooming in on the trigger, with the channels going into clipping for most of the waveform, the timing looks excellent with a little bit of “snaking” back and forth between channels due to variations in probe connection impedance and cable routing. This is a good result – if there is any skew, it is so low not to be visible.
DC Measurement Error

Input DC measurement error was tested using a Keithley 2450 SourceMeter SMU to generate 1mV voltage steps from -1V to +1V while being measured simultaneously by all four channels, for which the measurement average is taken.

Based on curve fitting across the range where no clipping occurred, the linear gain error ranged from +1.21% to +2.13% which is mostly consistent with the ±2% guaranteed specification (for >2mV/div). The voltage offsets appear to be from 1.9 to 3.9mV at 0V.

Absolute differences at 500MHz depict this trend which shows the slight differences in slope but also a “waviness”.


These trends appear consistent with the 20MHz bandwidth limiter and with the High Resolution mode enabled.

The same data is plotted as a percentage of reading error. At small values, big errors may occur due to quantisation error and offsets. However, at larger values, it seems negative voltages are more accurate with about 1-2% error, while positive voltages are seeing 1-3% error.
AWG AC/DC Voltage Error

The optional arbitrary waveform generator (AWG) was tested for AC and DC voltage error by connection to a Keithley 2110 5.5-digit DMM at 10PLC for maximum accuracy. A script was used to set the output at 1mV increments from -2.5V to 2.5V (DC) using the offset feature or 20mV to 5V (AC) at a frequency of 1kHz.

The DC output linearity was within 0.42% with an offset of 7.7mV by curve fitting.
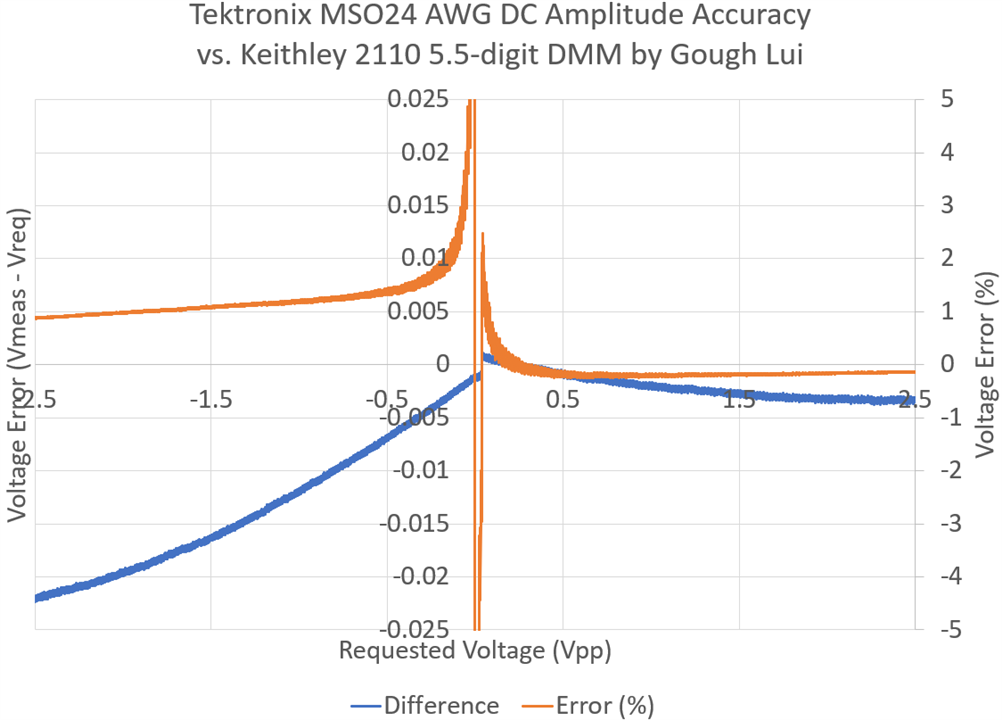
It seems the amplitude offsets were much better for positive offsets (up to 4mV) as compared to negative offsets (which had up to 22mV offset). Expressed as a percentage, it is still seems compliant with the claimed 1.5% + 1mV specification, especially when considering the uncertainty of the DMM as well.

The AC linearity appears slightly better at 0.36% with 0.4mV offset by curve fitting.

The voltage error was around 0.4%, reaching a high of about 17.6mV. The error seems to have a few “jumps” in places which do not align with the Keithley 2110’s ranges and are suspected to be actually generated by the MSO24. This is well within the 1.5% + 1mV specification regardless of how we look at it.
Channel Bandwidth
As I do not possess an easily usable wide-band source to test channel bandwidth, I decided to rely on noise to do the work for me. Using the highest sensitivity setting on one channel, I plotted the average FFT of many acquisitions around the 500MHz (advertised) bandwidth to see what the filter behaviour of the front-end looks like. This may not be entirely accurate or valid, but should still give some indication.

It seems that the bandwidth (of noise) extends to 500MHz in a relatively flat way, rolling off afterward, reaching an approximate -3dB point at 560MHz.
Channel Gain Flatness
While I could have attempted this using noise, unfortunately noise is random and therefore unpredictable. Instead, I chose to characterise this only at lower frequencies up to around 50MHz using the onboard FRA functionality. Channel 1 is designated as the reference for the AWG input, so everything is “with reference” to Channel 1’s behaviour. Standard 50-ohm RG-58U coax terminated in BNC was used to connect AWG to Channel 1 with a tee adapter, then to the channel under test with another tee adapter ending in a 50-ohm BNC terminator. This would ensure the system was properly terminated at close to 50-ohm, neglecting the two 1MΩ high-impedance input channels.

It is nice to see the FRA provides very flat amplitude responses up to 10MHz, then there is a slight crest of about 0.2dB followed by a dip of about 0.6dB by the end of the test. This may be representative of a very slight channel mismatch that could come about due to small things like the tee adapters.

Comparatively speaking, the results for Channel 3 are a carbon copy.

As are for Channel 4. As a result, I can only conclude that the channel performance in AC seems quite consistent.
Standby Power
To test for standby power consumption, I used a Tektronix PA1000 Power Analyser with the PWRVIEW software.

With the power supply alone and no MSO24 connected, the standby power consumption was 0.547W.

With the MSO24 connected, this now reaches 1.195W which appears to be a marginal failure in reaching the 1W standby limit considering the Ures of 0.167W. That being said, since my equipment isn’t quite “lab grade” and it’s been a while since the PA1000 was calibrated, I think this is still close-enough.
Power Consumption
The same methodology was used, but instead, with the oscilloscope running while the test was conducted.

The power analyser suggests a draw of about 31.9W from the mains. Assuming an 87% efficiency for the power adapter, the actual DC power would be estimated to be 27.6W.
Comparing this to the battery pack specifications of 14.52V at 6.7Ah, the battery pack provides a total of 97.284Wh of energy. The claimed operating time from a single battery is “up to four hours”, suggesting a battery load of 24.3W, slightly lower than our estimate but still within reasonable agreement.
Thermal
Thermal imaging measurements were taken with an Xinfrared InfiRay P2 Pro USB-C Thermal Camera of the MSO24 running for over an hour in a relatively cool indoor environment.

The hot-spots tend to be toward the top of the unit, due to the way the cooling system is designed to exhaust heat upwards.

Looking through the grille, the temperature seems to reach about 41 degrees Celsius which is very reasonable, about a 20 degrees Celsius rise above ambient.

It doesn’t seem there is much heat hiding under the kickstand area either.
Conclusion
As an oscilloscope is a very sophisticated device, there are only a limited set of tests that someone like myself without a calibration lab can perform. Regardless, I have tried to measure relevant parameters to check the performance of the MSO24 unit I received.
Front end noise was measured after a signal path correction (SPC) with BNC connections open, at the highest sample rate (2.5GSa/s), with the longest record length (10Mpts) and highest channel gain (1mV/div). The noise from all channels show an average peak-to-peak ranging from 3.0624mV to 3.2215mV and an RMS value ranging from 288.53µV to 299.46µV. This appears to be fairly typical performance for an 8-bit oscilloscope.
An attempt was made to measure skew, however, none was visually identified.
Input measurement error was measured with channels driven by a Keithley 2450 SourceMeter from -1V to 1V. Gain error ranged from 1.21% to 2.13% which is consistent with the ±2% guaranteed specification. Voltage offset ranged from 1.9 to 3.9mV.
The optional arbitrary waveform generator (AWG) was tested for AC and DC voltage error by connection to a Keithley 2110 5.5-digit DMM at 10PLC for maximum accuracy. The DC output linearity was within 0.42% with an offset of 7.7mV by curve fitting. The amplitude offsets were much better for positive offsets (up to 4mV) as compared to negative offsets (which had up to 22mV offset) but the values appear to be compliant with the 1.5% + 1mV specification when DMM error is considered.
The AC linearity was better at 0.36% with 0.4mV offset by curve fitting. The voltage error was around 0.4%, reaching a high of about 17.6mV. The error seems to have a few “jumps” in places which do not align with the Keithley 2110’s ranges and are suspected to be actually generated by the MSO24. This is well within the 1.5% + 1mV specification.
By looking at the FFT of just noise input, it seems that the bandwidth of the input extends to 500MHz in a relatively flat way, rolling off afterward, reaching an approximate -3dB point at 560MHz.
Experiments using the FRA feature showed very consistent channel amplitude responses with only small mismatch at higher frequencies (>10MHz) of <1dB.
Standby power consumption measurements were made using a Tektronix PA1000 Power Analyser and PWRVIEW software. The standby power consumption of the power adapter alone was 0.547W. With the MSO24 connected, it measured 1.195W with a Ures of 0.167W making it a “marginal” result for 1W standby power compliance. Operating power was measured at 31.9W from the mains, estimated to be around 27.6W from DC. This compares slightly higher than the 24.3W estimate based on battery pack capacity and stated operating time.
Thermal images taken with an Xinfrared InfiRay P2 Pro USB-C Thermal Camera show a maximum temperature of around 41°C around the top grille area, representing a temperature rise of approximately 20°C over ambient.
With this, it seems the Tektronix 2-series MSO is performing as expected and the results mostly corroborate datasheet figures where available.
---
This blog is a part of the Tektronix 2-series MSO RoadTest Review.