


I installed a solar system on my roof at the very end of 2017. I have a description of it in a previous post: Solar System Description .
I thought that it would be a useful exercise to examine the performance of the system over the first 2 years and compare it against the design goals/expectations.
The system that I installed was optimized for cost rather than performance. It was designed to have around 10% margin above my annual energy usage. Projections were based on historical averages for solar energy in Oregon.
Here is the initial estimate from the design software:

We knew the 5902 kWh number was too high because we did not do a detailed simulation for the effects of shadowing from my neighbor's trees and I even get some shadowing from his roof line (chimney) during the winter because of the low sun angle (south facing panels). We talked about using micro-inverters to to mitigate the shadowing effects but there was a substantial cost increase vs the string inverter that I'm using. The good news is that I've worked on reducing our energy footprint (LED lights, high efficiency appliances, smart thermostat, solar window shades, etc.) so our annual electric energy usage is about 5400 kWh vs about 8000 kWh for similar homes in my area. The other factor that we did not properly account for is the loss of panel efficiency due to rise in panel temperature (the panels are mounted on a black composition shingle roof).
Here is the original ROI projection which shows the break even point at about 4 years:
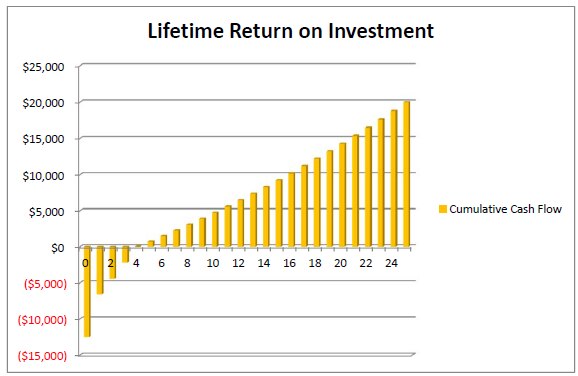
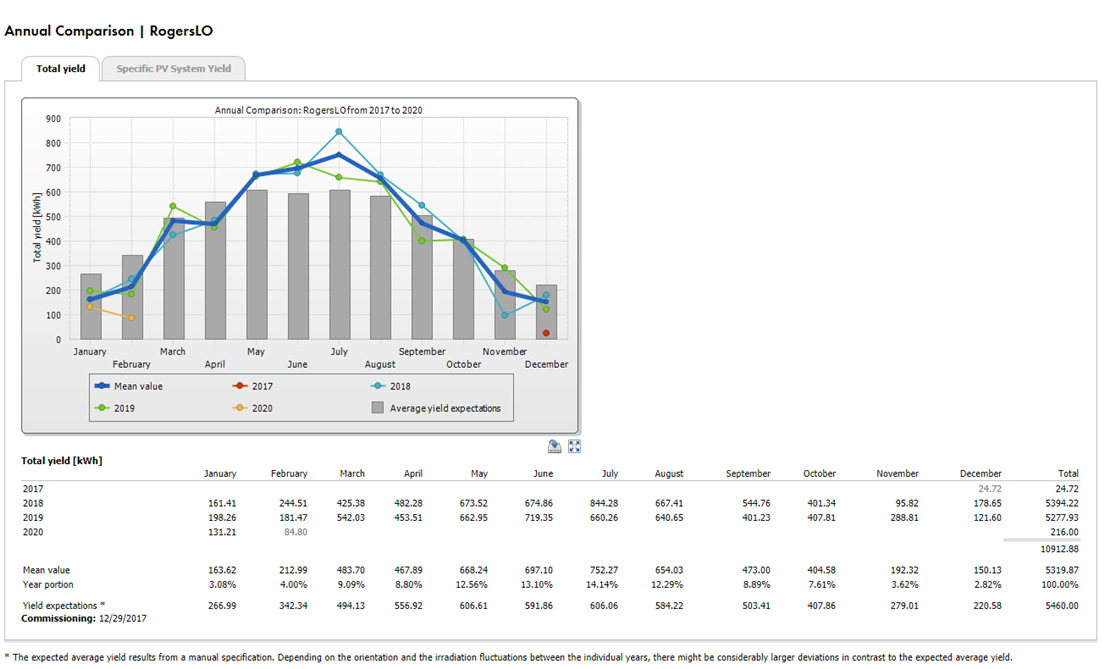
After the first year I readjusted the yield estimates and it looks like we essentially generate what we use on an annualized basis. So, we're basically running with no excess energy margin. We have a grid tie system so we only have to pay for excess energy that we use (there's also a monthly infrastructure charge of $12). With the Net Metering program that we're in, there is no real cost advantage to generating excess energy because they do not pay you for any excess that you generate on an annual basis. And excess credits do not carry forward year-to-year. Our true up cycle ends in March.
Here's a view of how we've done over the life of the system versus my adjusted yield estimate (5460 kWr/year):
Here is a energy usage comparison from our power company compared to 100 similar homes (single family residence with equivalent sq footage) within 0.4 miles:
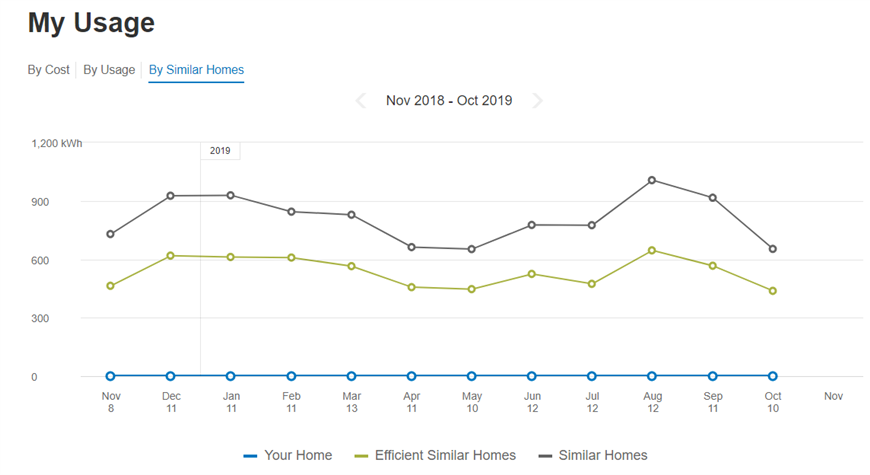
Our monthly net energy usage is zero because you can utilize energy credits accumulated during the summer months against the winter usage.
Summary
So, the design fell short of what we had intended. We're basically running with no margin so that as the panels age our energy production will fall short of our usage. Our break even point is at about 25 MWh which will occur in just under 5 years. The system total to date is about 11 MWh. The net lifetime ROI will still be about $15K because of the State and Federal energy tax credits and the State Energy Trust rebate on installation cost.
My wife asks me if I'm happy with the system because I complain a lot. Overall, I'm glad we did it. At least we've done our little piece of reducing our carbon footprint (about 7.6 tons of CO2 to date - if you believe what the inverter reports). The worst part of having a solar system is that it makes you realize how few days of sunlight we have during the NW winters  . No wonder we all have SAD.
Top Comments