element14 Community
element14 Community
    Register Log In
  • Site
  • Search
  • Log In Register
  • About Us
  • Community Hub
    Community Hub
    • What's New on element14
    • Feedback and Support
    • Benefits of Membership
    • Personal Blogs
    • Members Area
    • Achievement Levels
  • Learn
    Learn
    • Ask an Expert
    • eBooks
    • element14 presents
    • Learning Center
    • Tech Spotlight
    • STEM Academy
    • Webinars, Training and Events
    • Learning Groups
  • Technologies
    Technologies
    • 3D Printing
    • FPGA
    • Industrial Automation
    • Internet of Things
    • Power & Energy
    • Sensors
    • Technology Groups
  • Challenges & Projects
    Challenges & Projects
    • Design Challenges
    • element14 presents Projects
    • Project14
    • Arduino Projects
    • Raspberry Pi Projects
    • Project Groups
  • Products
    Products
    • Arduino
    • Avnet Boards Community
    • Dev Tools
    • Manufacturers
    • Multicomp Pro
    • Product Groups
    • Raspberry Pi
    • RoadTests & Reviews
  • Store
    Store
    • Visit Your Store
    • Choose another store...
      • Europe
      •  Austria (German)
      •  Belgium (Dutch, French)
      •  Bulgaria (Bulgarian)
      •  Czech Republic (Czech)
      •  Denmark (Danish)
      •  Estonia (Estonian)
      •  Finland (Finnish)
      •  France (French)
      •  Germany (German)
      •  Hungary (Hungarian)
      •  Ireland
      •  Israel
      •  Italy (Italian)
      •  Latvia (Latvian)
      •  
      •  Lithuania (Lithuanian)
      •  Netherlands (Dutch)
      •  Norway (Norwegian)
      •  Poland (Polish)
      •  Portugal (Portuguese)
      •  Romania (Romanian)
      •  Russia (Russian)
      •  Slovakia (Slovak)
      •  Slovenia (Slovenian)
      •  Spain (Spanish)
      •  Sweden (Swedish)
      •  Switzerland(German, French)
      •  Turkey (Turkish)
      •  United Kingdom
      • Asia Pacific
      •  Australia
      •  China
      •  Hong Kong
      •  India
      •  Korea (Korean)
      •  Malaysia
      •  New Zealand
      •  Philippines
      •  Singapore
      •  Taiwan
      •  Thailand (Thai)
      • Americas
      •  Brazil (Portuguese)
      •  Canada
      •  Mexico (Spanish)
      •  United States
      Can't find the country/region you're looking for? Visit our export site or find a local distributor.
  • Translate
  • Profile
  • Settings
KEITHLEY
  • Products
  • Manufacturers
  • KEITHLEY
  • More
  • Cancel

KEITHLEY

  • Blog
  • Forum
  • Documents
  • Events
  • Polls
  • Members
  • Mentions
  • Sub-Groups
  • Tags
  • More
  • Cancel
  • New
Join KEITHLEY to participate - click to join for free!

image

Welcome to the KEITHLEY page on element14. Here you can find things such as our latest news, training videos, and product details. Additionally, you can engage with us in our forums.

Have a Question?
Recent Discussions & Questions
  • r.ngugi
    Latest Advancements in Semiconductors Parameter Analyzers
    over 1 year ago
  • r.ngugi
    Monitoring Battery Cell Temperature with a Keithley 3706A System Switch and Multimeter
    over 1 year ago
  • r.ngugi
    Introducing KickStart Software v2.11.0
    over 1 year ago
  • r.ngugi
    Podcast notification ︎!
    over 2 years ago
  • r.ngugi
    What's on your Bench?
    over 2 years ago
Related Products
The Tektronix line of Keithley products spans an extensive range of electrical test instruments and systems used for high-performance production testing, process monitoring, product development, and research - multimeters, source measure units, arbitrary function generators, power supplies, switching and data acquisition systems etc.
Latest News
  • How to Measure a MOSFET I-V Curve

    r.ngugi
    r.ngugi

    This blog first appeared on the Tektronix website.

    image

    One of the best ways to ensure a MOSFET is functioning properly and meets specifications is to determine its characteristics by tracing I-V curves. There are a number of output characteristics requiring I-V tests; you can derive gate leakage, breakdown voltage, threshold voltage, transfer characteristics, and drain current all by simply tracing I-V characteristics and verifying the device is working as it should.

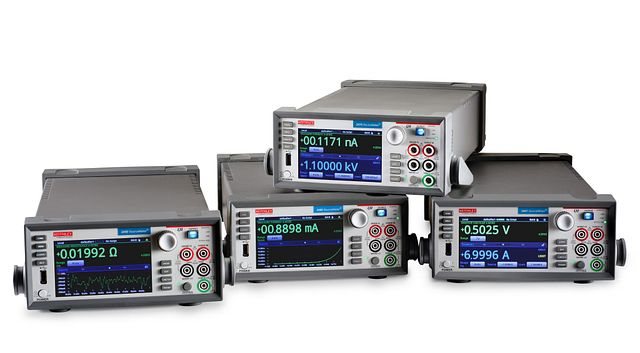
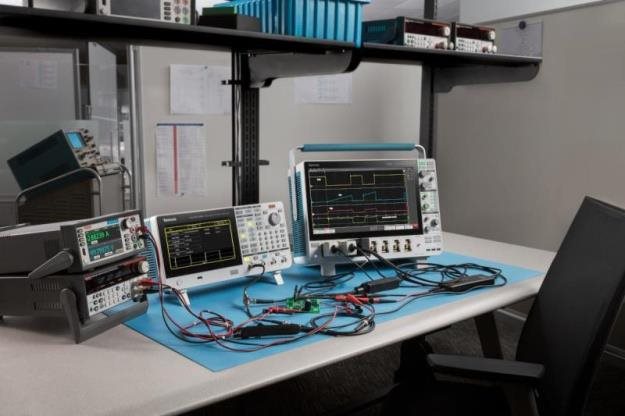
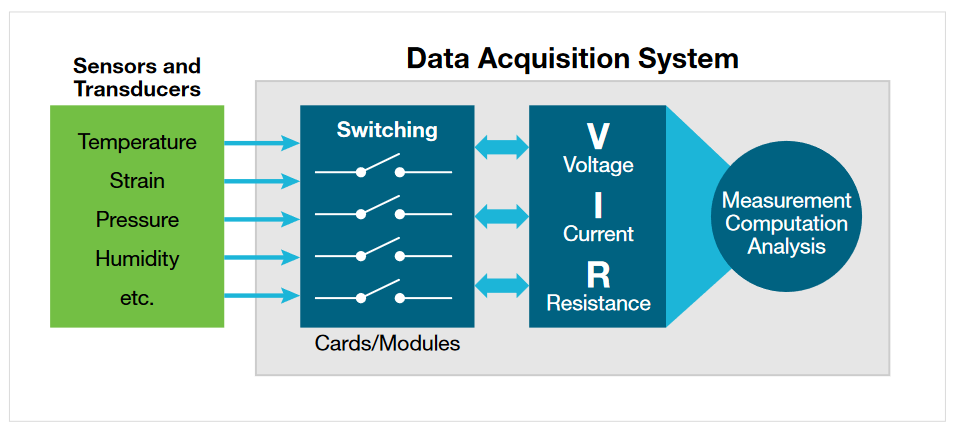
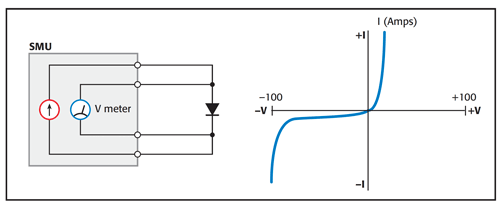
    Keithley’s source measure units (SMU) are core instruments for MOSFET I-V characterization tests. Their ability to source voltage while measuring current or source current while measuring voltage can be combined with both DC and sweep operations to perform measurements such as forward voltage (VF), reverse leakage, and reverse breakdown voltage (VB) without changing a connection to the device under test (DUT) (Figure 1).

    image

    Using built-in features, multiple SMUs can be synchronized for parametric measurements like threshold voltage, beta, and transconductance.

    Measuring I-V curves of a MOSFET with Keithley Source Measure Units

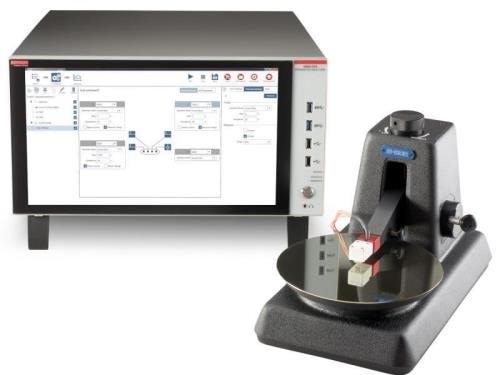
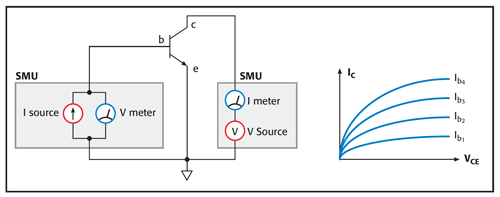
    A family of MOSFET curves can be obtained with just two SMU instruments (Figure 2). For each base current from SMU1, SMU2 sweeps VCE and measures IC.

    image

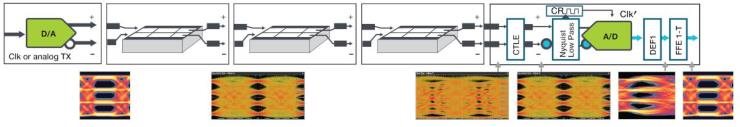
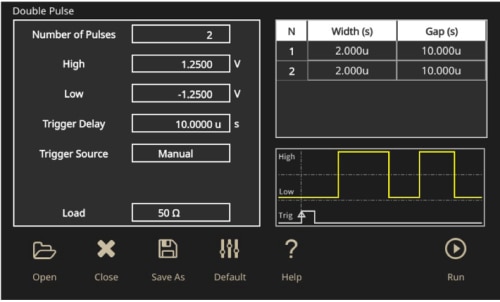
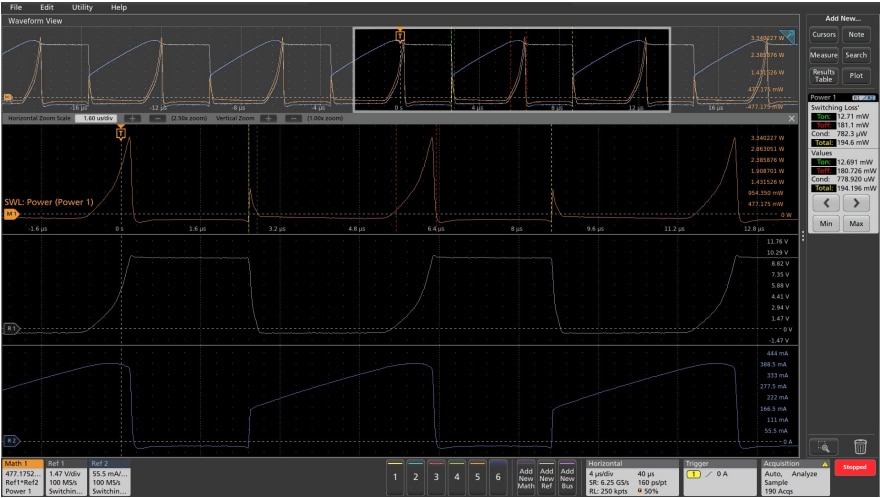
    Pulsed I-V characterization, wherein voltages and currents are applied for a very short time and at a limited duty cycle, is another common way to measure I-V curves. Pulsed I-V measurements can reduce test times and allow for MOSFET characterization without exceeding its safe operating area or causing the device to self-heat and parameters to shift.

    Two pulsed I-V channels are typically used to measure these MOSFET I-V curves with one channel connected to the gate and the other to the drain. The ground of each channel is connected to the MOSFET source pin.

    To construct the transistor curves, the gate channel first applies voltage to the gate, then the drain channel sweeps VDS through a range of values, measuring the resulting current at each point. Next, the gate channel applies a different voltage to the gate and the process repeats, constructing the next MOSFET I-V curve in the set.

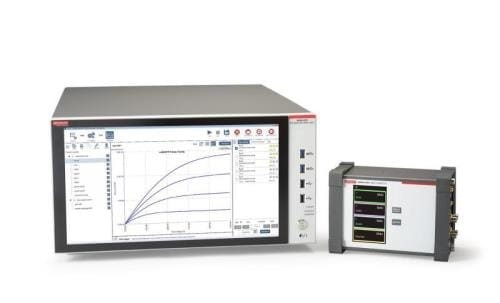
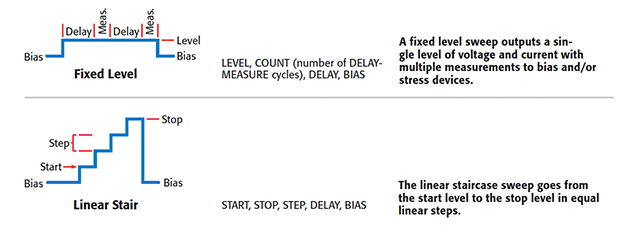
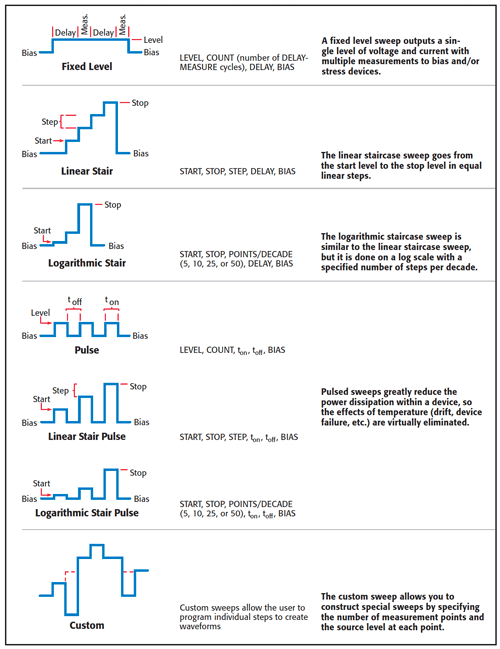
    Keithley’s SMU instruments simplify this process with built-in pulsed and DC sweeps, including linear staircase, logarithmic staircase, and custom sweeps (Figure 3). Sweeps coupled with other throughput enhancements like built-in limit inspection, digital I/O, and a component handling interface are ideal for high-speed, non-stop production environments. All sweep configurations can be programmed for single-event or continuous operation.

    image

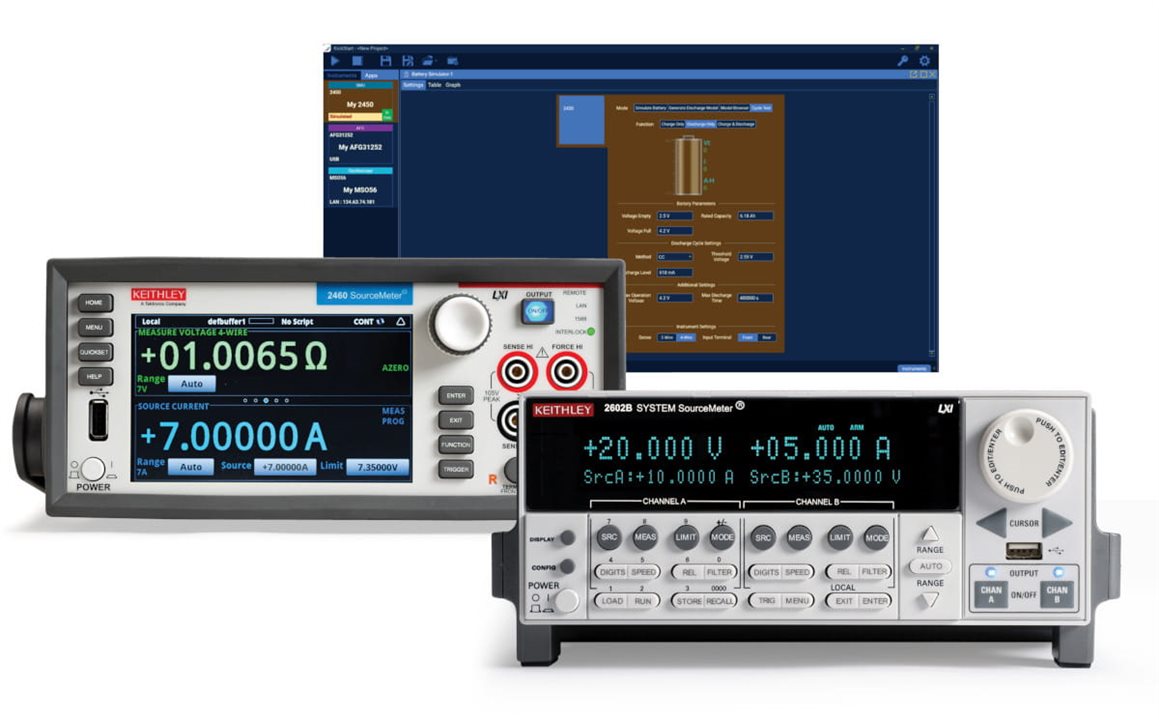
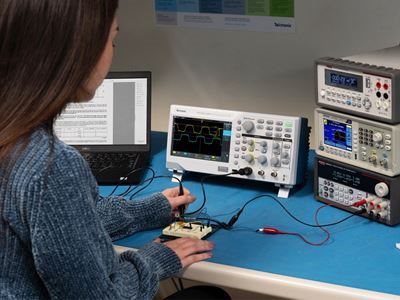
    Tektronix Keithley Instrument and software solutions for MOSFET I-V characterization

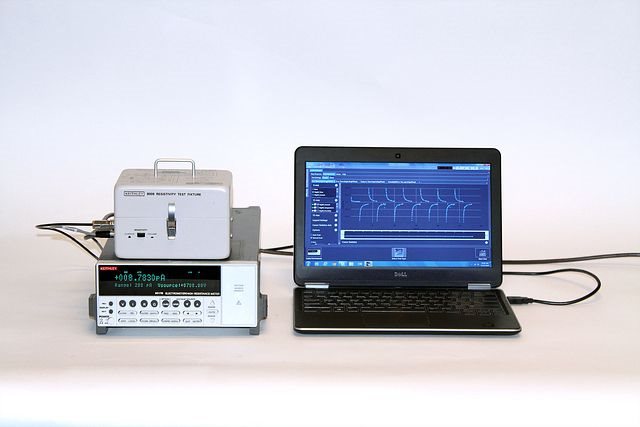
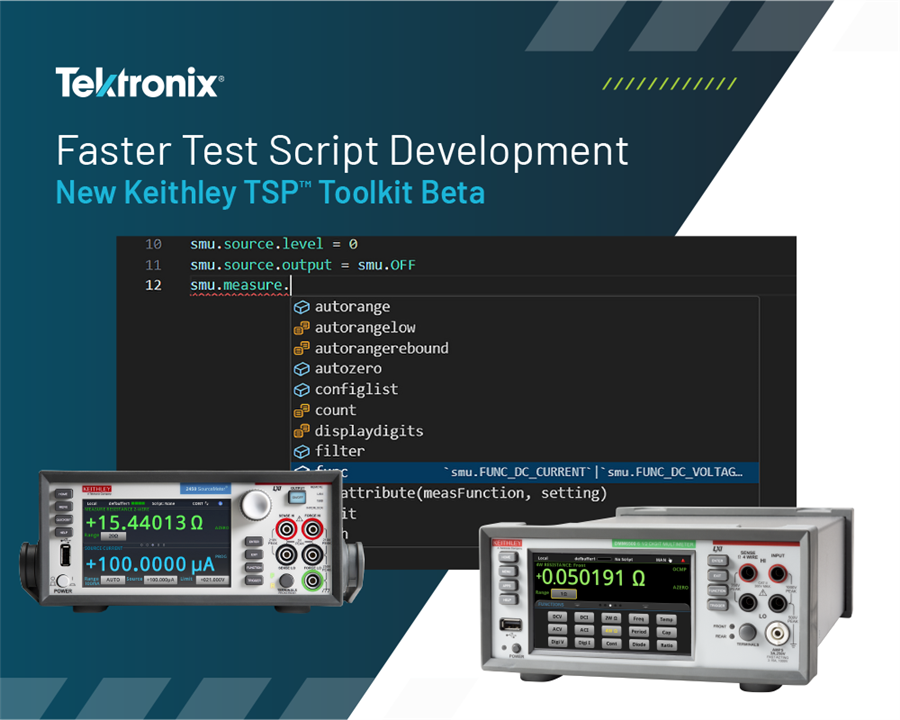
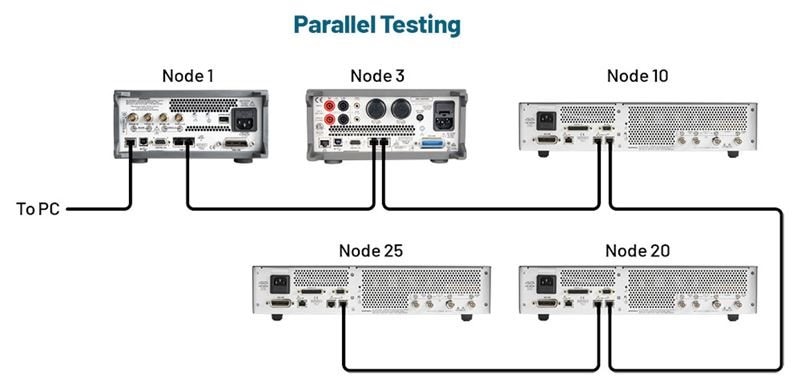
    Figure 4 illustrates various hardware and software solutions for MOSFET I-V characterization. In the first example, Series 2400 SourceMeters are connected to a PC. In the second example, Series 2600B SourceMeters are connected with TSP-Link technology, which seamlessly integrates multiple SMUs into a single system that can be programmed and controlled as a single instrument through the master 2600B SMU or a PC.

    image

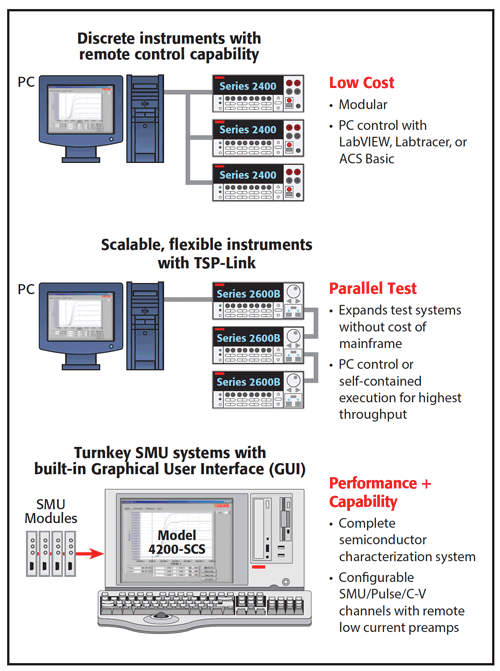
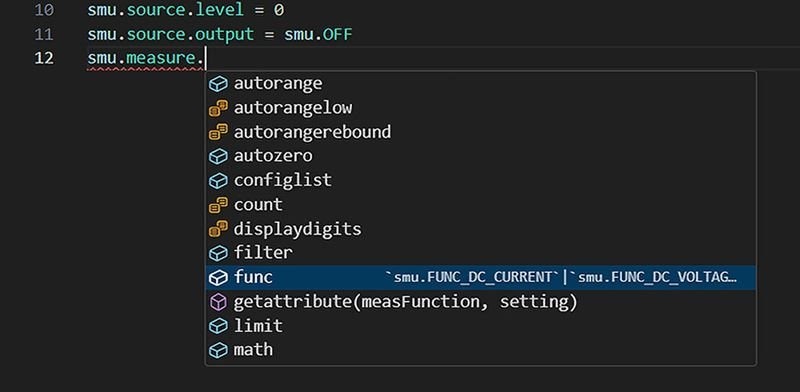
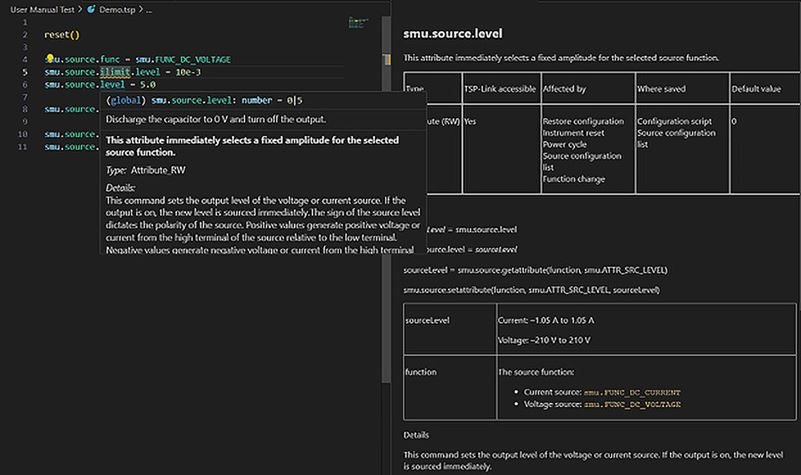
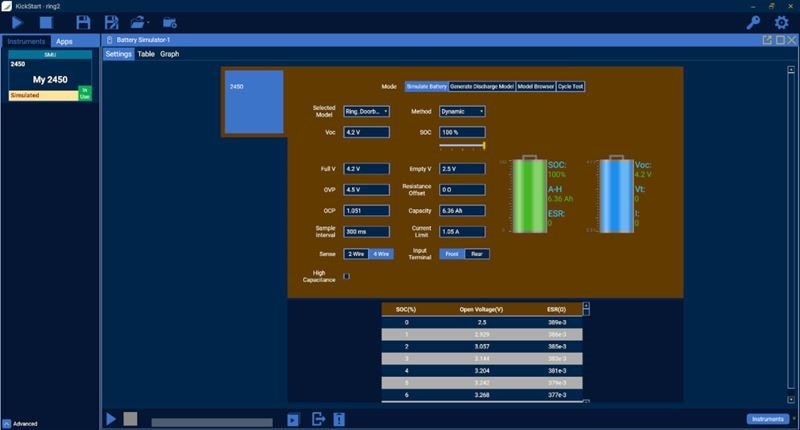
    Kickstart I-V characterizer software enables quick test setup and analysis, performs current versus voltage (I-V) testing on a variety of materials and devices, and can control up to four SMU instruments in each test

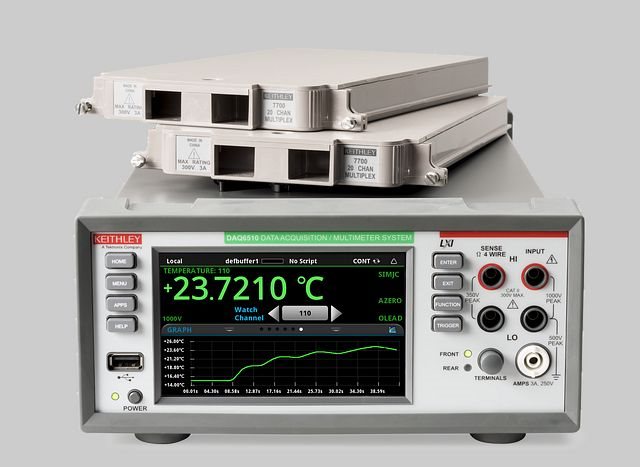
    The third example uses the Keithley 4200A-SCS Parameter Analyzer. This system includes an embedded PC, Windows® operating system, and mass storage. It’s a complete signal characterization solution for FETs and test structures. It supports up to nine SMU modules and provides an array of Windows-based software that is so intuitive, even a novice can use the system with ease. This point-and-click software supplies a full range of functionality, including managing tests, generating reports, automating test sequencing, and creating user libraries. The Model 4200-SCS is a complete one-box solution that combines sub-femtoamp resolution with real-time plotting and analysis.

    Engineers also have the option of combining any Keithley SMU with I-V curve tracer software to perform I-V curve tracing and characterize two-pin devices like diodes. If you need help finding the solution that’s most appropriate for your needs, contact the experts at Tektronix.

    • 9 Aug 2024
  • Characterize Self-Discharge Behavior Faster with the DMM7510

    r.ngugi
    r.ngugi

    This blog first appeared on the Tektronix website.

    image

    Rechargeable batteries are appearing in more devices than ever before. We are requiring these batteries to hold more energy, last longer and charge faster. This is even more critical in applications such as electric vehicles, where batteries must perform to the highest standards while remaining small and lightweight. This makes EV battery testing critical to catch failures in the batteries before they are placed in a product.

    What is Self-Discharge?


    Lithium-ion batteries produce electricity when a chemical reaction occurs on the anode, releasing ions and electrons that travel to the cathode. The opposite occurs when the battery is charged, lithium ions move from the cathode and collect at the anode. Ideally, the reaction that occurs on discharge is prevented from occurring when the battery is completely disconnected from a circuit. This is not true for practical batteries.

    Self-discharge refers to the tendency of a battery to discharge over time, even when nothing is connected to the terminals. This internal current is usually very small, but defects in the battery can cause higher current to flow. The defects can originate from a number of places in the manufacturing line, including conductive contaminants on the electrodes or separator, pinholes in the separator or micro-shorts due to dendrite formation during cycling. A battery with higher self-discharge current will not hold charge at the same level as the other batteries in a pack, leading to reduced performance and increased likelihood of failures.

    image

    Measuring Self-Discharge

    It is challenging to measure the self-discharge current of the battery directly, as any load on the battery will cause the battery to discharge which changes the measurement. We can characterize the self-discharge behavior of the battery by monitoring the open circuit voltage. The open circuit voltage reflects the state of charge of the battery and will decrease as the battery self-discharges. A defective battery that is charged and allowed to rest will have larger changes in the open circuit voltage over time.

    image

    The Keithley DMM7510 is a great option to observe the self-discharge behavior of the battery by monitoring changes in the open circuit voltage. Depending on the discharge current in the battery, it can take days to weeks to see a significant change in the battery’s open circuit voltage. The DMM7510’s 7.5 digit resolution ensures that you can detect smaller changes in the battery’s open circuit voltage, saving valuable test time. On the 10 V measure range, the DMM7510 can measure single microvolts. The DMM7510 is also highly accurate, with an accuracy of 14ppm* on the 10V range, so you can make reliable and repeatable readings. The DMM7510 is equipped with powerful TSP scripting capability so you can easily automate the measurement and data analysis such as pass/fail criteria. The DMM7510 makes measuring self-discharge behavior simple, allowing you to spend less time identifying faulty batteries and more time producing.

    *14ppm of reading + 1.2 ppm of range, 10 V range at 1 year

    • 7 Jun 2024
  • Measuring Serial Data Signals: Choosing an Appropriate Oscilloscope Bandwidth

    r.ngugi
    r.ngugi

    image

    This blog first appeared on the Tektronix website.

    1. Taking Measurement Bandwidth into Consideration for High Speed Serial Data

    When measuring high speed serial data signals and devices, whether for compliance, for design, or for troubleshooting purposes, measurement bandwidth is an important concern. The measuring oscilloscope can have a large or small bandwidth relative to the signal’s frequency content. What is the correct bandwidth for particular standard? And how has this relationship changed with recent standards?

    Here we’ll review the rationale for prescribing the measurement bandwidth, and how that rationale has evolved with the latest standards.

    Basic spectral properties of a high-speed serial data signal (Figure 1) show characteristic lobes of energy at the odd harmonics of the signal. The fundamental (1st harmonic) is at ½ of the fBaud, where fBaud is the frequency that numerical equals to the symbol rate of the signal, e.g., for a signal at 53 GBd the fBaud is 53 GHz; and the Nyquist frequency, fNyquist, is at ½ of 53 GHz.

    The signal of the Device Under Test or DUT (blue) is clearly rolling off quickly, and no usable energy beyond the 2nd harmonic is visible. This is a desired characteristic for signaling at 10s of GBd: high speed energy much past fNyquist is not important to the transfer of information: the electrical channel will suppress it anyway; furthermore, it might cause additional undesirable crosstalk. Finally, an attempt at recovery of the highly suppressed energy would be too noisy and would generate a higher error rate than a receiver design that rolls off soon after the necessary minimum, i.e., the Nyquist frequency.

    In contrast, a high-speed laboratory signal source (green) might have higher lobes of energy. Yet this too is academic – this source is overdesigned, it will generate too much past the typical DUT transmitter (Tx), and its energy won’t even propagate into the DUT except with extremely high-speed connectors and cables.

     image

    Figure 1. Basic Spectral Properties of an Amplitude Modulated Signal; also shown is the response of a Bessel-Thomson 4th order filter (in red) with bandwidth matching the fNyquist  i.e., 0.5 * fBaud as used for PAM4 reference filters.

    As mentioned, the BERT signal (green trace example in Figure 1) is extreme in its richness of high frequency energy many times past Nyquist frequency. But since that energy is there, do we need to measure it?

    Over the time, various standards have wrestled with this question and established rules for recommending the correct bandwidth. By way of an example, we will use IEEE 802.3 wired / fiber-based signaling to discuss this.

    The development of a required measurement bandwidth in the high speed electrical IEEE 802.3 standards is shown in Figure 2 and Figure 3; please note the time range (in years) is approximate.

    image 

    Figure 2. Bandwidth for Measurement of Electrical Standards, over Time (Approximate Time Schedule)

    image

    Figure 3. Bandwidth for Measurement of Optical Standards, over Time (Approximate Time Schedule)

    The comparison shows clearly that the measurement bandwidth is decreasing over time: why?

    The electrical signal (from the Tx to the Receiver or Rx) today is more bandwidth-limited by the media – the lossy channel over which the signal is propagating – than it used to be in the NRZ (PAM2 NRZ) signals. Note that the size of the eye is now, in PAM4 signaling, only about 1/3 of the whole amplitude swing.

    It’s also interesting that in optical signaling the measurement bandwidth has been significantly slower – relative to electrical media – for quite a few years. Let us see why.


    2. Why Measurement Bandwidth Has Decreased over Time

    In older, simpler systems, the signal from the transmitter is not exposed to a large loss in the channel. The receiver can recover the reasonably open eye directly or with just a light equalization. See Figure 4.

    image

    Figure 4. Simple Electrical Link; Note the Far-End Eye Is Still Mostly Opened

    In contrast, complex systems operating at a higher channel loss over f/fBaud are recovering a very small signal past the Nyquist frequency; significant effort has to be applied, and the eye will typically not open without a large amount of RF gain. However, a large RF gain spells trouble in the form of noise amplification – and noise causes errors in transmission.

    image 

    Figure 5. Complex Electrical Link; Note the Far-End Eye Is Still Fully Closed (3rd from Right)

    As the more complex transmission system (Figure 5) has to perform complex equalization, i.e., equalization with more gain, that system must also filter out most of the noise found at high frequencies, i.e., frequencies above Nyquist. This rapid bandwidth limiting improves noise performance when the transmission channel is highly lossy.

    3. Relationship of DUT Receiver Bandwidth to Measurement Bandwidth

    The guiding philosophy for measurement bandwidth is that the measurement should observe only a slightly larger spectral window than the DUT receiver.

    In simpler systems as were used in the past, this was often implied by the 5th harmonic, rule. In today’s more complex systems, where (as shown above) the channel exhibits a large loss (as a fraction of f/fBaud), the DUT Rx has to severely limit high frequency noise by rolling off more sharply. This will be somewhat approximated in the measurement system by lowering the measurement bandwidth, e.g., to 3rd harmonic range.

    3.1. The Role of 4th Order Bessel-Thomson System

    Another consideration is that since the newest – e.g., PAM4 – systems operate with highly noise limited data recovery, it is imperative that the measurement device’s roll-off doesn’t present artifacts into the time-domain view of the signal. The low-pass filter built into an oscilloscope therefore has to be without ringing or large overshoot in time domain. For this reason, a 4th order Bessel-Thomson filter is mandated by the standards. This is a filter design optimized for smooth phase response and smooth voltage transition. Besides specifying the filter, the standard also mandates that this filter has to be followed past the -3 dB point, i.e., if a 40 GHz Bessel-Thomson 4th order filter is specified, it does not mean that a 40 GHz DUT oscilloscope is usable; in fact, even a 50 GHz oscilloscope will not be complaint to the standard because the beneficial Bessel-Thomson roll-off would be truncated too soon.

    See Figure 1, red trace, for a Bessel-Thomson 4th order filter matching the signals signaling rate (-3dB at fNyquist, as in typical PAM4 standard. Observe how little energy remains after the effect of both the signal roll-off combined with the red-line Bessel-Thomson 4 filter.

    What does this mean for today’s standards?

    4. Fastest Standards in 2021 / 2022

    Electrical standards. The expectation is that IEEE 802.3ck is finishing one of the fastest practical electrical standard, with data throughput of 100 Gb/s per lane, with variants such as the 400GBASE-CR4 or 400GBASE-KR4 or 400GAUI-4, in 2021, and with final ratification likely in mid-2022. The signaling symbol rate of these standards is 53.125 GBd, hence the Nyquist frequency of the signal is 25.5625 GHz.

    It is expected that the standard will mandate an oscilloscope measurement bandwidth of 40 GHz bandwidth (i.e., -3 dB) Bessel-Thomson filter of 4th order with the end of controlled roll-off at around 55 GHz. Such acquisition will be fast enough to capture the majority of the signal and its potential fidelity problems while not compromising the SNR of the measured signal with excess bandwidth beyond what is implemented in the DUT receivers.

    The OIF-CEI standard uses the same concepts but uses a slightly different filter. We’ll discuss that in a future post.

    Optical standards. The measurement of optical signal using PAM4 signaling, aka Optical Direct Detect PAM4 NRZ, has been established for several years now as part of the IEEE 802.3bs effort behind the 400GBASE-DR4 standard. In optical signaling, the considerations for receiver bandwidth are different from those of electrical signaling present in, for example, IEEE 802.3ck. At 53 GBd the optical signal in a single mode fiber experiences relatively little bandwidth roll-off (relative to electrical channels), and for this reason the equalization process is simpler, and there is less impact from reflections on short links, so the optical receiver will not be severely affected by such reflections. Due to these link properties the measurement bandwidth mandated by the optical standards is at only 0.5*fBaud, i.e., at the Nyquist frequency, as measured on the electrical side of the receiver.

    This turns out to be a Bessel-Thomson filter with bandwidth electrical of 26.5625 GHz for 53 GBd signals; in typical single mode systems, the end of controlled roll-off is just past 60 GHz.

    Why is there – in optical standards – a difference in bandwidth electrical and bandwidth optical? The optical-to-electrical conversion in an optical receiver squares the power relationship between the optical and the electrical side; therefore, the optical bandwidth is different – higher – than the electrical bandwidth. (The bandwidth is at a fraction of full power; the square-law of a typical O/E changes that ratio.) The optical bandwidth is not used to specify the relationship between the Bessel-Thomson filter and the Nyquist frequency.

    In some case the optical link is stressed for capacity “at any cost” in electronics (e.g., very expensive links, such as submarine links between continents). The whole design – including the signal roll-off – is then dominated by concerns for spectral efficiency and much sharper roll-off of transmitter energy and of the measurement tools applies.

    Conclusion

    The bandwidth for measurements in high speed serial data systems is lower (as a fraction of symbol rate) for higher speed standards than it used to be in less equalized standards of the past. This development simply confirms the design tradeoffs that the link designers have to make today. The measurements are performed with bandwidth of around at the 0.5 * fBaud, rolling off in a time-domain friendly way of the 4th order Bessel-Thomson filter in most standards. A slightly faster roll-off is likely in the future.

    • 24 May 2024
  • Energy Storage Devices: a Battery Testing overview

    r.ngugi
    r.ngugi

    image

    This blog first appeared on the Tektronix Website.

    Energy storage device testing is not the same as battery testing. There are, in fact, several devices that are able to convert chemical energy into electrical energy and store that energy, making it available when required.

    Capacitors are energy storage devices; they store electrical energy and deliver high specific power, being charged, and discharged in shorter time than batteries, yet with lower specific energy.

    Supercapacitors are another type of energy storage device; they share certain characteristics with both capacitors and batteries, achieving higher specific energy than capacitors. Tektronix/Keithley first got involved with testing supercapacitors through our clients in the automotive market that were primarily looking for instruments to characterize supercapacitors in regenerative braking systems.

    And then, of course, there are the rechargeable batteries — specifically the Li-ion batteries (LIBs) that started to dominate the market and became a broad new area of test and measurement.

    Let’s take a short tour of battery testing.

    Graphene and Advanced Cathode Materials Research

    Graphene testing and nanotechnology techniques like using carbon nanotubes to control graphene and electrochemical properties caught the attention of our engineers and test specialists. Graphene oxides have been critical to the development of modern Lithium Ion batteries because they help stabilize and improve batteries’ chemical, thermal and electrical properties.

    When Li-ion batteries were first being developed, the research involved testing graphite oxides and graphene with composite material. Keithley started to investigate how to characterize and ensure the best electrical conductivity performance at the most reasonable cost.

    Keithley’s sensitive low-level measurement solutions and parameter analyzers such as the 4200A are widely used in testing and producing special materials like graphene, specifically in battery cell R&D departments.

    Electrical measurements on conductivity were made with a Keithley 622x DC and AC current source and Keithley 2182A Nanovoltmeters connected to a four-probe fixture setup.

    Cells Electrochemical Characterization

    For a thorough electrochemical characterization, it is necessary to support charge and discharge testing on energy storage devices and batteries, in particular. The electrochemical performance characterization requires two specific measurements: cyclic voltammetry and galvanostatic / potentiostatic charge-discharge cycles.

    For these specialized tests, Keithley released the 2450-EC, 2460-EC and 2461-EC Potentiostats, which are specialized versions of our Source Measure Units (SMUs).

    SMUs can be programmed to apply a linearly variable electric potential for the electrolysis, while simultaneously scanning and recording the output current. All phenomena are strictly dependent on temperature, so we were typically combining these systems with special dataloggers like DAQ6510 that could track multiple environmental sensor responses in a time-aligned way.

    image

    Figure 1: DAQ6510 is a precision data acquisition and logging system that creates a new level of simplicity compared with the often complicated configuration and control found in the industry

    Li-Ion Batteries Manufacturing: a quick look into production

    Li-Ion battery production is an extremely interesting market; LIBs are a popular choice for several applications that, for simplicity, we will group into three main categories:

    • 1. The consumer market, which includes battery-operated IoT, medical wearables, smart home and general portable electronics
    • 2. The transportation market, which is in large part the automotive EV battery testing market
    • 3. The broad and complex stationary applications market, which includes uninterruptible power supply (UPS), data centers, renewable energy systems (RES), and batteries for grid-level storage.

    Each of these main macro applications not only differ in energy and power density requirements, the battery form factor, discharge rate, efficiency, and safety, but must adapt in order to support ever-changing lifetime requirements. This translates to more complex specs, such as the number of charge/discharge cycles and other performance-related parameters.

    Also, the needs of each from a test and measurement perspective differ significantly. Over the last several years, many national and international industry projects and consortiums have been created to work throughout the entire battery value stream, growing and sharing their expertise.

    Multiple associations in Europe assembled players focused on battery production technology in different departments, from the machine and component supply, raw material provisioning and preparation, electrode production and the stages of assembly, from the cell level to module and pack production. All of these were propaedeutic steps in preparation to support the need for several battery plants in Europe—the so called “Gigafactories”.

    These large facilities are supposed to produce battery systems for electric vehicles, which fall in the second of the three aforementioned markets: transportation/automotive.

    Battery System Testing in Automotive

    An automotive battery system is complex with a lot of electronics incorporated in a solid, protected housing. It contains a battery pack with relatively complex cooling and control systems, electrical and thermal sensors, and some communication wiring. The control unit acts as a “brain” and is called BMS or battery management system.

    A battery pack is a system composed of several battery modules. Each battery module is composed of several individual battery cells.

    If the chemistry is efficient at the cell level, you need to make sure that the optimization still exists at the module or system/pack level as well.

    Different test sets are developed at the cell level, module level and system level. The same test Instrument may find space in different production stages and for different levels of batteries.

    Let’s take a quick look at some of the value chain phases.

    Cell-level Materials and Subcomponents, Electrode Manufacturing Testing

    There is a lot of material (like complex polymers) processing in the early stages of the production of key components used in cell manufacturing. You need to make the separators, the case, the electrodes etc.

    Tektronix and Keithley solutions relate to the electrical measurements taken on electrodes for instance. It is necessary to trace the impedance on electrodes to make sure the materials chosen for the anode and cathode do not massively contribute to the battery input impedance and stay in the range of a fraction of an ohm across a certain frequency range. Generally, customers design a specific fixture capable of accessing all interfaces between collectors and other layers; it is a necessary step for the accurate determination of electrical conductivity of different samples. A special chuck can be used to connect to it with the four-point probe technique.

    Keithley state-of-the-art Nanovoltmeter 2182A combined with 622x Current AC and DC sources support such measurements. As said in the previous paragraph, these measurements are made mostly in the research stages and considered particularly useful when dealing with electrochemical noise measurements. The DC source applies a very precise constant current on the electrodes while the digital nanovoltmeter measures the correspondent drop in voltage.

    Cell-level Assembly, Stacking, Tab Welding, Filling

    Before filling the electrolyte into the cell, defective products need to be removed from production. To identify defective products, you can run a test on the insulator (also called the separator) that involves a charging-dwelling-discharging sequence and measure the leakage current.

    When issues with the separator exist (membrane problems, decomposition etc.), the failure is easy to detect as the level of current is in the range of tens of mA. When insulation is good, the leakage current can be quite low (in the pico Ampere range). The insulation resistance test is also repeated in the module assembly and pack assembly stages to prove the insulation is good for different parts with respect to ground (chassis).

    The Keithley model 6517B Electrometer/ High Resistance Meter offers insulation resistance measurements at various calibrated insulation test voltages. The 6517B has very low current sensitivity and a built-in 1kV voltage source with sweep capabilities. This simplifies performing leakage, breakdown, and high-resistance testing as well as surface resistivity measurement on insulating materials.

    image

    Figure 2: Keithley electrometer can embed a high voltage source for testing insulation

    Cell level Formation- Aging – End of Line (EOL) testing

    The formation and electrical testing of individual battery cells occurs in the last steps of the production line and generally represent a significant bottleneck for mass production.

    One of the key characteristics of a battery cell is its performance over the course of its life, so cells are put through an aging process to investigate cell degradation.

    A typical characterization of performance over time is achieved by cycling the cells. Cycling is essentially a repeated charging and discharging process.

    A current and voltage profile representative of the intended application under typical application-related stress conditions (e.g. temperature variation) is applied to cells.

    It is important to note that lifetime requirements for cells, modules, and systems are determined by the application where they will be used (e.g. electrified mobility, Consumer Electronics, etc.).

    There are several cycling (charging-discharging) protocols defined by standards for each specific application (e.g. IEC 62660-2).

    Depending on the methodology, a programmable power supply source is used to apply a constant current - constant voltage (CC-CV) charge procedure, taking the cell from an initial set voltage to a final set voltage. Then the voltage is fixed, and the current is reduced until a certain capacity is reached.

    A discharge cycle is generally applied via a programmable electronic load.

    All these cycles are repeated several times with some variable “relaxation” time between charge and discharge.

    These tests are typically executed in a temperature chamber; the variation in temperature that a cell experiences is also dependent on the intrinsic thermal variation during charging and discharging.

    A multi-channel system based on several source measure units like Keithley SMUs, which capable of measuring while sourcing or sinking, can be used in this stage. The system typically requires multichannel DMMs with specific resolution, accuracy, and stability over time and across environmental conditions.

    image

    Figure 3: Keithley Source and Measure units can cycle battery cells with high precision, accuracy and stability

    Players compete in introducing the most efficient methodology on end-of-line testing and formation. Meanwhile system integrators challenge themselves in developing efficient test procedures and parameter extraction regarding cell quality monitoring.

    Test racks in this space are generally highly automated, involve multiple instrument units, and generally perform the following measurements:

    • - Internal resistance measurements (DC)
    • - Open circuit voltage (OCV)
    • - Leakage current
    • - Charge/discharge pulsing

    The automation of data collection is critical here and helps the following grading phase, when cells are sorted according to their performance test results.

    Internal Resistance and OCV Measurements

    The performance of a battery and its efficiency during the charge and discharge process can be evaluated in a few different ways, and there are several indicators to look for. The battery internal resistance characterization is one of them. It basically means accurately characterizing the battery’s changes under several charge/discharge current rates, state of charge (SoC), temperature and other aging indicators.

    OCV is the voltage measured at the terminals of the battery after enough rest time (sometimes called relaxation), and it is a key measurement for Li-Ion battery cells.

    OCV also varies mostly according to battery SoC and, to a lesser extent, according to the temperature. These details can be used to create a battery equivalent model, which is used to design a battery management system (BMS), in addition to assessing the battery specs and condition.

    The internal resistance in the battery accounts for the voltage drop across battery’s terminals when a load is connected compared to no-load voltage and can be derived from OCV measurements.

    OCV is generally not just a measurement, but a set of measurements. In fact, we call it the OCV characterization of the battery, and we trace an exhaustive analysis derived from a curve on an SoC versus OCV plane.

    To trace this curve, you need to bring the battery to specific states of charge. This is typically performed by charging or discharging current in a pulsed way using a smart source/load then waiting for some amount of rest time, and then measuring the open-circuit potential at the electrodes.

    A Keithley SMU like the 2461 is the perfect instrument to perform this test. In fact, it can either source or sink the cell current in a controlled way while measuring the cell current and voltage with a four-wire (Kelvin) connection with contact check. All of this is easily automated and controlled by a programmed embedded microprocessor. This specific SMU offers controlled pulsing capabilities for both charging and discharging.

    The accuracy of the voltage measurement in OCV is a discriminating factor for the choice of the instrument. In some cases, the typical 6 ½-digit measurement resolution, the thermal stability, and most importantly, the accuracy of an SMU can be considered insufficient.

    For this reason, some test setups involve a special digital multimeter, the Keithley DMM7510, that is a standard in Li-Ion battery cell testing. Its low-noise, 32-bit A-D converter allows 7 ½-digit resolution and metrology grade accuracy.

    Busbar Weld Impedance Safety Test Workstation in Battery Packs Manufacturing

    A battery module is composed of multiple cells that are connected in parallel or series to achieve the desired voltage output. All cells are laser-welded to a busbar—a long conductor that is isolated from the ground and is responsible for carrying high current for the distribution of power from the battery. The VSH-Busbar weld impedance test characterizes the impedance of the weld. Small resistances in the weld can generate enough heat to degrade the batteries and lead to early failures or unsafe operating conditions. By measuring the resistance before testing the battery operation, defective modules can be quickly removed from the line.

    Measuring the impedance of the weld involves sourcing a current across the weld and measuring the voltage to calculate the resistance. Test execution speed and measurement accuracy are the two most important considerations when measuring the weld impedance. This can be done using SMUs like the Keithley models 2460 or 2461 and either the model 3706A System Switch and Multimeter or the model DAQ6510 Data Acquisition and Logging Multimeter System.

    The 2460 and 2461 SMUs are capable of sourcing up to 7A for battery systems that require high current. The impedance of the weld can be as small as a few milliohms, so it’s important to use a sensitive enough meter to measure very small voltages. The model 3706A features a 7.5-digit digital multimeter (DMM) and can measure 10s of nanovolts on the 100mV range. Since a battery pack could have close to 80 welds on one busbar, Keithley instruments support mainframes with configurable slots for multi-channel plug-in modules, eliminating the need for rewiring. The process of closing each channel to measure it is obviously automated for speed and efficiency.

    image

    Figure 4: A schematic example of an automated system for impedance test in battery production

    ATE Design in Battery EOL Testing

    When the battery-operated device is a vehicle, things become quite interesting.

    First, you tend to deal with a significantly large number of cells to test, and the test equipment is sophisticated and requires very high reliability. ATE design in this application space needs to support multiple tests on multiple devices. The characterization methodologies also need to be simple and a low-cost alternative to the more advanced and higher-resolution scientific alternatives, which tend to be time-consuming and expensive to set up.

    At the cell level, there may be “electrochemical workstations” to set up. But when dealing with modules, the focus is on higher current testing. Finally, the test on complete systems (packs) can involve high currents and high voltages (1000A and 1000V or more are quite common today).

    Single cell testers are typically multi-channel systems. What matters here is the voltage and current resolution of the measurement and its stability under varying environmental conditions.

    BMS ATEs are designed to accurately monitor cell voltages and temperature, and monitoring the changes in impedance is key.

    image

    Figure 5: Typical test rack with multichannel high accuracy DMMs and related switching unit

    Impedance Measurement of Cells

    The battery impedance of cells is a key measurement taken during the formation and aging stages. All batteries experience a reduction in performance with cycling. This can be due to the degradation of one or more components or interfaces. There are different methodologies that can be applied, from electrochemical impedance spectroscopy (EIS) to direct diagnostic measurements.

    EIS is a non-destructive technique that provides a considerable amount of information in a relatively short time span while preserving the integrity of the battery. To conduct this test, a small AC signal is applied over a wide frequency range and the response is measured. Measurement methodologies involving a span on frequencies are applied to individual cells, but they aren’t applicable for larger sizes and larger operating power modules. In the automotive battery management system (BMS) space, the test is carried out on multi-cell batteries of varying capacities and mismatched cells have to be carefully tracked. Cell mismatch can occur due to battery overcharge, discharge shorts, or simply because of aging.

    The Consumer Portable Battery-Operated Electronics: testing needs

    What about the testing needs in the market of IoT, medical wearables, and smart home devices?

    Embedded devices used for IoT applications are strictly connected to the battery choice, since this impacts the expected lifetime of the device. Batteries needs to be sized to support device workloads for a long period of time. The battery market for IoT relates to small (also “micro”) batteries with thin, flexible, and sometimes unconventional form factor.

    When choosing the right battery for their specific application, designers have to consider multiple parameters, including:

    • Battery type and declared specs
    • Operating temperature range and storage conditions
    • Potential energy losses and circuitry leakage
    • Application requested ranges and power consumption profile

    Let’s focus on the last bullet for a second. Designers need to be aware of the power consumption profile and precisely control the schedule of each executed task by any of the device units (processors, transmitters, etc.). IoT device workloads are sequences of tasks periodically launched in execution with short-duty cycles.

    The rate of discharge is strictly dependent on this power schedule, and the intensity, duration, and frequency of these “power usage” pulses. Also, it’s important to control the voltage range of the application, and be aware of the maximum, nominal, and cut off voltage for each subcomponent to correctly operate it.

    Based on all the aforementioned considerations, an embedded designer needs to perform:

    • A dynamic model battery simulation
    • A dynamic current charge / discharge testing (with pulsing sink capability)

    image

    Figure 6 : Battery Simulators need to support modeling like profiles of open circuit voltage and internal resistance as a function of the battery's state of charge

    The typical test bench will include:

    • A basic oscilloscope operating at max 500MHz (typically lower) like the Tektronix TBS2000B or MDO 3 series
    • A multi-channel DC power supply with battery simulation capability (generally linear) like the Keithley 2230 model
    • An electronic load, possibly programmable, like that offered by Keithley SMUs
    • A DMM with sufficient resolution (DMM6500 when 6 ½ digits is sufficient or for low-power consumption applications, the DMM7510 is recommended to step up to 7 ½ digits)
    • An instrument data control software environment (typically PC-based) like Kickstart.

    Voltages in this application space do not exceed 10V - 15V max, but current sink in some power-hungry conditions can reach a few Amps (3-4A).

    Keithley battery simulators span from the solid 2306 series for production to the 2281S bench solution.

    • 17 May 2024
  • Quickly Develop Test Scripts with the New Keithley TSP™︎ Toolkit Beta

    r.ngugi
    r.ngugi

    image

    This blog first appeared on the Tektronix website.

    Semiconductor manufacturers, validation engineers and reliability engineers can now get faster test script development while automating Keithley test instruments such as SMUs, DAQs or DMMs by downloading the Keithley TSP Toolkit Beta, the new TSP (Test Script Processor) script development environment, which takes the form of a Visual Studio Code extension. In this blog, we’ll explore TSP technology and how the Keithley TSP Toolkit can help you quickly and easily develop test scripts.

    What is Test Script Processor or TSP Technology?

    Test Script Processor, or TSP, technology is both an instrument automation command set and programming language. TSP-enabled instruments, like Keithley SMUs, DAQs, and DMMs, contain an embedded scripting engine that can execute basic programming functionality and instrument control commands.

    You can initiate tests with a single TSP script call from the PC, or run the test on the instrument automatically, without the PC. This drastically reduces test time compared to traditional testing methods using SCPI commands that require individual commands to be sent from the PC to the instrument.

    TSP scripts also offer the most flexibility, allowing you to create a wholly custom test system with benefits such as high-speed triggering, parallel testing and increased throughput.


    image

    A parallel test instrument configuration using TSP-Link technology.


    Quickly and Easily Develop Test Scripts with TSP Toolkit

    The Keithley TSP Toolkit is an updated script development environment that includes all the functionality and instrument support of Test Script Builder (TSB) plus many quality-of-life features that improve the development experience.

    TSP Toolkit will feature the modern UI of the Visual Studio Code IDE, complete with syntax-highlighting and the increased readability it affords, along with the convenience of the many extensions available on the VSCode marketplace.

    Programmers, integrators and those with established automated test frameworks will appreciate having access to other scripting languages like Python in the same environment that they use to write TSP scripts. The Keithley TSP Toolkit extension will also feature autocompletion alongside in-line and hover help, reducing pesky mistakes from copy/pasting TSP commands improperly and eliminating the need to manually parse through dense reference manuals to confirm proper command usage and syntax.

    image

    Keithley TSP Toolkit extension command autocomplete feature in action.

    image

    Keithley TSP Toolkit command hover help feature in use.


    While the Keithley TSP Toolkit extension is open source and is currently in development, a Beta version has been made available on the Visual Studio Code marketplace. The TSP Toolkit Beta can be used to develop automation scripts for all TSP-enabled Keithley instruments.

    Source Measure Units

    Digital Multimeters

    Data Acquisition Systems

    2400 Graphical Touchscreen Series

    DMM7510 7.5-Digit Graphical Sampling Meter

    DAQ6510 6.5-Digit Data Acquisition and Logging Multimeter System

    2600B Single and Dual Channel Systems

    DMM6500 6.5-Digit Multimeter with Graphical Touchscreen

    3700A System Switch / Multimeter

    2650 Series for High Power


    Keithley TSP-enabled instruments.

    The TSP Toolkit Beta is available as a VSCode extension and can be used to develop TSP scripts alongside your other favorite VSCode extensions, such as those for Python, C# and many others.  Download the TSP Toolkit Beta for an improved development experience.

    • 10 May 2024
  • Battery Testing Made Easy

    r.ngugi
    r.ngugi

    image

    This blog first appeared on the Tektronix website.

    The best way to test any kind of rechargeable battery is to start with the upgraded KickStart Battery Simulator App from Tektronix / Keithley, which provides battery testing, battery emulation, battery simulation and battery modeling.

    With a growing number of battery-powered devices in our homes and factories, on our desks and roads, and in our pockets, it is imperative that the batteries we use continue to be safe and reliable.

    Battery-powered laptops became common in the 1990s. Handsets have been powered by batteries from the beginning of cellular telephony (which really took off with the introduction of smartphones in the 2000s). The automotive industry is now in the process of transitioning to hybrid and fully electric vehicles (HEVs and EVs).  

    The internet of things (IoT) is adding a wide range of battery-powered devices: security systems, thermostats, doorbells, lighting, and more.

    Battery Safety Starts With Testing

    Battery safety and reliability starts with design, manufacturing, and testing. Keithley has already made battery testing reliable with its KickStart Software, but knowing we are all going to be relying more and more on batteries, Keithley engineers just made it faster and easier too.

    Test engineers have long been able to use KickStart for applications such as battery simulation and discharge model generation. The previous solution required using a 2380 Series Electronic Load and a 2281S Battery Simulator, however.

    The latest version of our KickStart Software makes it all simpler, easier, and more accurate.

    Battery Testing With Less Equipment

    The enhanced Battery Simulator App released in KickStart Software version 2.11.0 gets test engineers down to a one-box solution. Test engineers can use any one of a variety of our source measure units (SMUs), including our 2400 Graphical Touchscreen Series SMUs or our 2600B Series SMUs.

    While the new approach certainly clears space on a test bench, having a one-box solution is so much more versatile than that – it makes the solution portable. It is now significantly easier, for example, to develop and test battery cell materials in the lab for use in EV battery packs.

    Battery Emulation With Less Effort

    The Keithley KickStart Battery Simulator App provides users the ability to easily generate battery models, simulate batteries, and perform battery cycle tests using the app. And as always with KickStart, no programming is required.

    The solution comes with 12 battery emulator models ready to be used, and it is also easy to import and export models to and from KickStart software. Test engineers can immediately begin testing consumer wireless devices, automotive, and industrial applications without having to write a SMU custom script.

    Of course, for those who wish to do so, the application makes it possible to generate, edit, and simulate custom battery models.

    image


    Better Battery Testing Results

    The KickStart Battery Simulator App boasts the capacity for a maximum of eight total instruments; you can have eight Battery Simulators open, each with its own instrument. This makes it easy to conduct battery testing through multiple charge and discharge cycles with access to a wide variety of test cutoff conditions.

    Alternatively, up to eight KickStart apps can be run independently (and some apps support multiple connected instruments).

    Either way, millions of test points can be collected for subsequent test runs. The user interface is highly responsive, allowing changes to the simulated state of charge in real time.

    The application yields real-time table and graph views that have been created for instant data visualization and collection, showcasing dynamic and static battery models of battery VOC, Vt, SOC, ESR, current, and capacity. Multiple tests can be viewed in a single window, and data from multiple test runs can be presented in a single plot for comparison.

    A Better Battery Test Solution

    Altogether, the enhanced KickStart battery test solution will save test engineers money, time, and coding effort, all while providing more flexibility, extensive visualization, and greater accuracy.

    The one-box, no code approach we’ve taken with the Keithley KickStart Software Battery Simulator Application makes it possible for our customers to effortlessly generate battery models, simulate, and cycle test batteries from the convenience of a PC-based software.

    For more details, visit the Kickstart Software Battery Simulator App product page and check out the Keithley KickStart All-In-One Battery Test Solution demo video. If you're working with electric vehicle power, visit our EV battery testing page for details and other products available.

    • 12 Apr 2024
  • How to Read a Datasheet for Precision Equipment

    r.ngugi
    r.ngugi

    image

    This post first appeared on the Tektronix website. 

    When searching for the right product, the firsthand guide to doing so is the product’s datasheet. Whether you are searching for a Digital Multimeter (DMM), a power supply, an oscilloscope, or any precision test and measurement instrument, you should consult the datasheet to ensure the instrument will meet your needs. But datasheets can be confusing if you’re not familiar with them.

    What information is found in a datasheet?

    Every datasheet contains documentation on the product’s capabilities, features, and performance specifications. The general sections are:

    Key features

    A datasheet will call out any unique or special capabilities to help you decide on one product over another. These might be related to the user experience, software options, or especially important specifications.

    Typical use cases and applications

    In this section, the manufacturer details the circumstances in which the product will be used.   Ideally, clear examples are provided to help you determine whether or not the product can address your specific needs.

    Performance Specifications

    The specifications or ‘specs’ of an instrument are generally the main reason to check the datasheet. They quantitatively detail how you should expect an instrument to perform. The actual specifications that are included will vary depending on the instrument and manufacturer. Below is an example below of the Volts Specification from the 6517B Electrometer/High Resistance Meter datasheet. The specifications list the product’s resolution, range and accuracy along with specific notes on how to ensure proper measurement that will meet these specifications.

    Also be sure to check the time period for which the performance specifications are valid. This is typically 1 year, but some products might say their specifications are valid for 2 or even 3 years. After that amount of time, you should not rely on your product still meeting the defined performance. You will need to have your product calibrated to re-verify the performance and start the count down again.  

    You may sometimes find specifications by themselves in a separate document; in most cases, either can be used as a specification reference as long as both are up to date. Always use the most recent datasheet when looking at products, as a manufacturer may change instrument specifications over time.

    To learn more about reading instrument specifications, see Section 1.4 of the Keithley Low Level Measurements Handbook: About Instrument Specifications.

    image

    General Characteristics

    Besides performance specifications, a datasheet will include non-performance specifications, too. These can include the weight, power draw and many other miscellaneous but important features. Given below is an example from the DMM6500 Datasheet, which lists the product’s mechanical features, including the type of included display and the product’s dimensions.

    image

    Compatible Accessories

    A datasheet will often include a full or partial list of compatible accessories, software, and warranty or calibration plans. Accessories can help you better suit your instrument to your specific use case.

    Ordering Information

    Finally, for complex products with many options, a datasheet will include instructions on how to select the right options. This section usually calls out specific manufacturer part numbers that can be helpful when speaking to sales reps or looking at quotes.

    Useful terms to know when reading datasheets

    Some terms utilized in datasheets have specific definitions that are important to know to properly assess if the product fits your specific needs.

    Typical

    Typical represents an expected value of functionality that falls within the distribution of results from other instruments of the same make and model. Individual units may vary from this given specification.

    Nominal

    Guaranteed characteristics or traits that do not have specified value associated with them.

    Guaranteed / Guaranteed by Design

    A given range of specifications that have been derived from a large range of testing or data analysis. The manufacturer has a great deal of confidence that it will be within a given range.

    Warranted

    Characteristics that describe specified performance within tolerance limits or certain type-tested requirements.

    • 5 Apr 2024
  • Grade A Solutions for Battery Grading

    r.ngugi
    r.ngugi

    image

    *This blog was first published on the Tektronix website.

    Current technology markets are demanding more out of our batteries than ever before. These batteries are being pushed to charge faster, hold more and last longer. Makers of electric vehicles need batteries to be smaller, lighter, safer, and cheaper. All of these pressures lead manufacturers to one question: How do we guarantee the batteries live up to these tight standards?

    Why Grade Batteries?

    The battery manufacturing process as a whole can be reduced into two sections, cell manufacturing and module/pack manufacturing. When the cell is complete at the end of the cell manufacturing process, it is necessary to characterize the performance of the battery cell. This process is called grading the battery. Batteries that have the best performance (fully meet specifications) are considered grade A batteries. Batteries that mostly meet expectations are considered grade B batteries. The lowest category of performance then is grade C.

    Grading the batteries has several functions. Firstly, most of the battery cells will eventually be combined into modules and packs. These modules and packs perform better when the individual cells are similar in performance. Secondly, many applications such as electric vehicle and other transportation applications require the ability to charge quickly, output high power, and maintain performance over their lifespan. For this reason, many automotive OEMs require grade A batteries for their products. Grade B batteries are often uses in less demanding applications, such as stationary power storage.

    The Grade A Testing Solution for Battery Grading

    Batteries can be characterized using several measurements but one of the most important battery measurements is the open circuit voltage. Measuring the open circuit voltage of the battery while it rests can characterize the quality of the battery cell. Higher quality battery cells discharge less over time than cells with minor defects.

    image  

    The best solution for measuring the open circuit voltage of a battery cell is to use an accurate digital multimeter (DMM) like Keithley’s DMM7510. The DMM7510’s 7.5 digit resolution ensures that you can detect changes in the battery’s open circuit voltage faster, saving valuable testing time. On the 10 V measure range, the DMM7510 can measure single microvolts. The DMM7510 is also highly accurate, with an accuracy of 14ppm* on the 10V range, so instrument accuracy won’t be a limiting factor in the criteria between grade A and B batteries. The DMM7510 is reliable and accurate, allowing you to have confidence in your measurements to back the quality of your batteries.

    *14ppm of reading + 1.2 ppm of range, 10 V range at 1 year

    • 15 Mar 2024
  • 4 Key Testing Phases for Power Conversion Equipment

    r.ngugi
    r.ngugi

    This blog first appeared on the Tektronix website. 

    image

    While the types of electrical tests required during the design and production of power conversion equipment are similar to those required for previous generations of devices, the adoption of wide-bandgap materials like silicon carbide (SiC) or gallium nitride (GaN) requires added rigor and new test strategies.

    Bench testing continues to play an important role at every stage of the development of power conversion equipment to characterize, validate, benchmark, and document efficiency and other characteristics. It begins with testing the material to determine whether it is suitable for use, followed by additional testing after the SiC or GaN wafer has been fabricated. Testing proceeds after the devices or circuits are fabricated on the wafer followed by packaged part testing. Further testing is performed on an assembled circuit, and finally on the piece of power conversion equipment when it comes off the assembly line.

    Each of these four testing phases has individual importance to the undertaking as a whole, and each must be conducted at a specific point through the workflow/value stream. For example, breakdown voltage testing must be performed on a MOSFET as a stand-alone component, before it is installed on a circuit board. Likewise, switching energy must be measured after the MOSFET is installed on a circuit board, because that energy depends on factors associated with the circuit as a whole, with switching frequency depending on the gate driver.

    Tektronix provides a comprehensive set of test equipment that gives design and test engineers the ability to set up test benches robust enough to meet their most rigorous requirements. This equipment also sets the stage for emerging requirements that will come to the forefront as power conversion equipment becomes more sophisticated, the regulatory environment becomes more rigorous, and testing protocols become more challenging.

    Here are the four testing phases:

    1. Material-level Testing

      At the pre-component stage, testing must be conducted on the wide bandgap material itself, followed by testing at the wafer stage, to determine the specifications of its behavior. Wide-bandgap semiconductor material research and testing often involve determining the Resistivity and Hall mobility of a sample. The main techniques for measuring these parameters are:

      • Van der Pauw method
      • Hall Effect measurement

      All of these measurements can be made using a parameter analyzer. The Keithley 4200A-SCS Parameter Analyzer includes modules allowing researchers to perform both Van der Pauw resistivity and Hall Effect measurements automatically, saving valuable research time and eliminating the need to purchase a separate system to perform these tests.

      image 
    2. Component-level Testing

      The next stage of testing occurs for components/devices fabricated on the wafer or as a stand-alone component. Device I-V characterization is performed to compare simulation data to actual measurement data. Post-manufacture component testing plays an integral role in the device designer’s creation of data sheets and quality control. It is also used extensively by end customers to validate components against their specifications.

      I-V characterization measurements can be made with the 4200A-SCS or with Keithley’s series of high-power source measure units (SMU). Additionally, the 4200A-SCS supports CV measurements. When the 4200A-CVIV Multi-Switch is added to the 4200A-SCS, you gain the following advantages:

      • No need to reconnect any cables: reduces user error and permits automated testing.
      • Allows measuring circuit level capacitance directly.
      • Using bias tee at every terminal eliminates the need for external capacitors or shorts.
      • Full CV compensation out to the device under test (DUT).
      image
    3. Circuit-level Testing

      As mentioned above, the switching characteristics of a MOSFET must be tested and characterized after installation in a circuit, typically by means of double-pulse testing using an Arbitrary Function Generator (AFG) to create the pulse test waveform as shown in the diagram. This testing measures parameters that include turn-on and turn-off characteristics as well as thermal behavior. Component manufacturers typically create demonstration boards for internal development use on which they install their MOSFETs for circuit-level testing including the double-pulse test.

        image

      To learn more about double pulse testing, we encourage you to watch the video Double Pulse Test with the AFG31000. This video shows how to set up and run a double pulse test using the built-in software on the Tektronix AFG31000 Arbitrary Function Generator. Now you do not need to spend time creating waveforms on a PC or microcontroller. Instead, you can set up your double pulse test in under a minute right on the AFG31000.

    4. System-level Testing 
      A fully assembled power module undergoes testing in particular for its operating efficiency using a variety of instruments including oscilloscopes, power supplies, isolated probes and power analysis software as shown in the images below. These instruments and the measurements they provide play a critical role in meeting regulatory guidelines as well as qualifying for certifications such as Energy Star compliance.

    image
    image
    Innovations in test tools such as source measure unit instruments, capacitance-voltage units, arbitrary function generators, oscilloscopes, probes, and software tools enable design engineers at all phases of the life cycle to work toward power conversion equipment that can cost-effectively meet rigorous design requirements.
    • 8 Mar 2024
  • What is Data Acquisition (DAQ)?

    r.ngugi
    r.ngugi

    *This blog post first appeared on the Tektronix website.

    image

    Data Acquisition (DAQ) is the measurement of electrical or physical things like voltage, current, temperature, pressure, sound, or motion. Converting these signals into digital data is necessary to analyze and store them for further processing. DAQ systems are essential for a wide range of applications, from scientific research and industrial automation to environmental monitoring and medical diagnostics.

    Diverse Applications of Data Acquisition Across Fields

    Data acquisition plays a pivotal role in a wide array of sectors, enabling the precise measurement and analysis of various physical and electrical phenomena:

    1. In Scientific Research: Essential for exploring physical phenomena such as temperature fluctuations, pressure variations, and motion, data acquisition technology also proves vital in medical studies for monitoring key health indicators like heart rate and blood pressure.
    2. Within Industrial Automation: Here, data acquisition is integral to controlling and monitoring manufacturing processes. It helps in assessing critical factors such as temperature and pressure in chemical plants and overseeing the functioning of robotic assembly lines, thereby streamlining industrial operations.
    3. For Environmental Monitoring: This technology is a key ally in environmental conservation efforts. It aids in tracking important environmental metrics including air quality, humidity, and temperature, and is instrumental in evaluating emissions from industrial plants and analyzing water quality in rivers and lakes.
    4. In Aerospace and Defense: Data acquisition is crucial in managing and monitoring complex systems in aerospace and defense applications. It assists in evaluating aircraft engine performance and in the real-time monitoring of various parameters such as temperature and pressure in defense equipment.
    5. Within Medical Diagnostics: In the healthcare sector, data acquisition technologies are employed for recording critical physiological data, such as ECG, EEG, and EMG readings. This is particularly crucial during surgical procedures and in diagnostic tests.

    image

    Overall, the utility of data acquisition extends across various industries, underscoring its importance in applications that require detailed, accurate, and dependable data collection and analysis. Whether it's advancing scientific research, optimizing industrial processes, protecting the environment, ensuring safety in automotive, aerospace and defense, or aiding medical diagnostics, data acquisition technologies are indispensable.

    DAQ Systems

    What is a DAQ system?

    A DAQ (Data Acquisition) system is a set of components and devices used to measure and collect data from various sensors or transducers. It involves the conversion of physical or electrical signals into digital data for further analysis and processing.

    A typical DAQ system consists of three main parts:

    1. Sensors or Transducers: These devices convert physical or electrical signals, such as temperature, pressure, or voltage, into measurable quantities.
    2. Signal Conditioning Circuits: These circuits amplify, filter, or digitize the signals from the sensors to improve their quality and accuracy.
    3. Data Acquisition Device: This device samples and digitizes the conditioned signals and sends them to a computer or other processing unit for analysis and storage. The data acquisition device can be a standalone unit or a plug-in card that connects to a computer's PCI or USB port.

    image

    DAQ systems are used in a wide range of applications, including scientific research, industrial automation, environmental monitoring, aerospace and defense, and medical diagnostics. They play a crucial role in measuring, analyzing, and controlling physical or electrical phenomena, enabling researchers, engineers, and technicians to collect and analyze data accurately and efficiently.

    How to Choose a Data Acquisition System

    Selecting the right Data Acquisition (DAQ) system is crucial for obtaining precise and reliable measurements in various applications. The effectiveness of a DAQ system lies in its ability to accurately meet specific measurement requirements, which involves considering several key factors:

    1. Accuracy and Resolution: The core of DAQ system effectiveness is its accuracy, largely determined by the resolution of the analog-to-digital converter (ADC) and the stability of the reference voltage. Opt for systems with higher resolution ADCs and stable reference voltages for more precise measurements.
    2. Sampling Rate: Essential for applications involving rapidly changing signals, a higher sampling rate is crucial for high-speed data acquisition and dynamic control systems.
    3. Signal Conditioning: Look for robust signal conditioning capabilities, including amplifying, filtering, or digitizing signals from various sensors, to enhance their quality and accuracy. This is particularly important for adapting to different sensor types like thermocouples, strain gauges, and accelerometers.
    4. Software Compatibility and Functionality: Ensure the DAQ system comes with user-friendly software that offers effective data visualization tools and supports multiple programming languages. Compatibility with various operating systems like Windows, Linux, or Mac OS adds to the system’s versatility.
    5. Channel Count: Consider the number of channels the system can support. A higher channel count increases the system's flexibility and scalability in handling multiple signal types.
    6. Environmental Adaptability: Assess the system’s ability to operate under the specific environmental conditions of your application.
    7. Budget Constraints: Evaluate the overall cost, which includes the price of the system or device and any additional accessories or software required.

    By carefully considering these aspects, you can choose a DAQ system that not only aligns with your specific needs but also ensures a balance between performance, versatility, and budget. This approach guarantees that the selected system can effectively and efficiently handle the required data acquisition tasks.

    Enhancing Engineering Decisions with DAQ Systems

    Key Insights Gained from DAQ Systems

    DAQ systems are instrumental in capturing and recording data from various sensors, crucial for monitoring physical or electrical phenomena. These systems empower engineers with data-driven insights, allowing them to make more informed decisions in areas such as:

    • Trends and Patterns Analysis: Engineers use DAQ systems to identify trends in parameters like temperature or pressure, enabling early detection of potential issues.
    • Fault Detection and Diagnosis: By analyzing data from DAQ systems, engineers can pinpoint faults in systems, identifying malfunctioning components or sensors.
    • Performance Optimization: DAQ data aids in identifying inefficiencies, guiding engineers to optimize system performance and increase productivity.
    • Predictive Maintenance: Analyzing data trends helps in predicting maintenance needs, preventing system breakdowns.
    • Quality Control: In manufacturing, DAQ systems are pivotal in ensuring product quality, detecting any deviations from required specifications.

    Enhancing Data Acquisition with Advanced Techniques

    Incorporating Advanced Calibration

    Data Acquisition systems today benefit significantly from advanced self-calibration techniques, which employ third-order polynomials. This innovative approach greatly enhances the accuracy of measurements by auto-adjusting calibration coefficients based on predetermined input signals. Such accuracy is indispensable in sectors where precise data collection is critical, including aerospace, defense, and automotive applications.

    Importance of Isolation in Measurement Accuracy

    Isolation plays a pivotal role in ensuring the accuracy and reliability of DAQ systems. It involves shielding the measurement circuits from potential distortions like electrical noise and voltage discrepancies. Employing isolation techniques, such as galvanic and magnetic isolation, is crucial, especially in high-voltage environments or areas susceptible to electrical interference, to maintain the integrity of the data collected.

    Advanced Isolation Techniques for Reliable Measurements

    Maintaining the integrity of measurements is a fundamental aspect of data acquisition. DAQ systems often incorporate advanced isolation methods to protect sensitive measurement components from external electrical disturbances. By establishing either physical or electromagnetic barriers, these systems prevent noise or voltage fluctuations from impacting the accuracy of the data, a necessity in environments with high electromagnetic interference or unstable electrical conditions.

    Leveraging Signal Streaming and Remote Monitoring

    Signal streaming and remote monitoring are groundbreaking advancements in the realm of DAQ. High-speed signal streaming facilitates the real-time capture and analysis of data, essential in dynamic and demanding testing environments. Additionally, remote monitoring capabilities enable operators to manage and visualize data remotely, enhancing operational flexibility and efficiency, particularly in complex, continuously monitored systems.

    Keithley Instruments' Advanced DAQ Systems

    Overview of Keithley's DAQ Capabilities

    Keithley Instruments provides a range of advanced data acquisition systems, known for their accurate measurement capabilities, fast scanning, and versatile setup options. These systems are designed to cater to various measurement and analysis needs in fields like scientific research, industrial automation, and more.

    Keithley DAQ6510: Feature-Rich Data Acquisition System

    image 

    The Keithley DAQ6510 defines versatility in data acquisition, consolidating a suite of essential functions into a singular, robust unit. This system is engineered to cater to a range of measurement needs, with standout features that include:

    • Precision Multimeter: For accurate measurement of electrical parameters.
    • Rapid Scanning Capability: Ensures quick data collection.
    • Digitization Functionality: Converts analog signals into digital format.
    • Integrated Data Logger: For efficient recording and storage of data.
    • Extensive Measurement Range: Capable of measuring voltage, current, resistance, capacitance, temperature, and frequency.
    • High Channel Support: Accommodates up to 80 channels, making it ideal for large-scale data acquisition.
    • Fast Scan Rate: Achieves a scan rate of 1 MS/s, streamlining the data collection process.

    Designed for scenarios requiring comprehensive and varied data collection, the Keithley DAQ6510 excels in providing enhanced connectivity and seamless integration with diverse systems. Its ability to handle multiple channels and maintain a rapid scanning rate positions it as a prime choice for extensive data acquisition tasks.


    Keithley DMM7510: Digital Multimeter with Real-Time Sampling

    image 

    The Keithley DMM7510 combines the functionality of a precise digital multimeter with a real-time sampling oscilloscope. Key features include:

    • User-friendly interface
    • Capability to measure voltage, current, resistance, capacitance, and temperature
    • Equipped with 20 channels
    • A sampling rate of 1 MS/s This device is ideal for applications requiring detailed and rapid measurement across various parameters

    Keithley DMM6500: Versatile Bench/System Digital Multimeter

    image

    The DMM6500 61⁄2-Digit Bench/System Digital Multimeter is another key offering from Keithley. This multimeter is particularly useful for applications that demand high-speed measurements and multiple parameter tracking. It is notable for its flexibility, functioning both as a standalone instrument and as part of a larger DAQ system. Its capabilities include:

    • Measuring voltage, current, resistance, among others
    • Up to 10 channels
    • A high sampling rate of 10 MS/s

    Each of these systems from Keithley Instruments brings unique strengths to the table, enabling efficient and accurate data acquisition for various applications.


    Why Choose Keithley DAQ Systems?

    High Accuracy: Keithley Instruments' DAQ systems are designed with high-precision components, including high-resolution ADCs, stable reference voltages, and high-quality signal conditioning circuits, to ensure accurate measurements.

    High-Speed Scanning: Keithley Instruments' DAQ systems are capable of high-speed scanning, allowing for fast data acquisition and analysis. This makes them ideal for applications that require real-time monitoring and control.

    Flexible Configuration: Keithley Instruments' DAQ systems are designed to be flexible and configurable, allowing users to customize the system to meet their specific measurement requirements. This includes the ability to support multiple sensor types, input/output configurations, and signal conditioning options.

    User-Friendly Software: Keithley Instruments' DAQ systems come with user-friendly software that provides data visualization tools and supports multiple programming languages. This makes it easy for users to control and analyze the data from the system.

    Industry-Leading Support: Keithley Instruments is known for its industry-leading support, including comprehensive documentation, technical support, and training programs. This ensures that users can get the most out of their DAQ systems and achieve optimal performance.

    Overall, Keithley Instruments' DAQ systems are leading the way in terms of accuracy, speed, flexibility, and user-friendliness. Keithley Instruments' DAQ systems are great for many uses, like research, automation, and data collection in different industries. They have powerful parts, can be set up in different ways, and have easy-to-use software. to data acquisition and analysis. to aerospace and defense.

    In Conclusion

    In the diverse landscape of modern technology, Data Acquisition (DAQ) stands as an indispensable tool across various sectors. From enabling precise measurements in scientific research to optimizing industrial processes, ensuring environmental integrity, and advancing medical diagnostics, DAQ systems have become crucial. Their advanced calibration, robust isolation, and innovative features like signal streaming and remote monitoring exemplify their versatility and adaptability. As the demand for accurate and reliable data collection grows, the importance of DAQ systems in facilitating informed decision-making and driving technological advancement becomes increasingly evident.

    • 2 Feb 2024
>
Documentation
  • r.ngugi
    Group Intro Widget Content
    By r.ngugi > > over 1 year ago

  • Matt
    Setup
    By Matt > > over 3 years ago

  • Matt
    Featured Video
    By Matt > > over 3 years ago

  • Matt
    Main Group Widget
    By Matt > > over 3 years ago

  • BarbaraR
    Top 5 DMM user questions
    By BarbaraR > > over 3 years ago

  • migration.user
    3D Sensing & Imaging
    By migration.user > > over 3 years ago

  • migration.user
    Aerospace & Defence
    By migration.user > > over 3 years ago

  • migration.user
    Automotive
    By migration.user > > over 3 years ago

  • migration.user
    IoT (Internet of Things)
    By migration.user > > over 3 years ago

  • migration.user
    Materials Science & Engineering
    By migration.user > > over 3 years ago

More
element14 Community

element14 is the first online community specifically for engineers. Connect with your peers and get expert answers to your questions.

  • Members
  • Learn
  • Technologies
  • Challenges & Projects
  • Products
  • Store
  • About Us
  • Feedback & Support
  • FAQs
  • Terms of Use
  • Privacy Policy
  • Legal and Copyright Notices
  • Sitemap
  • Cookies

An Avnet Company © 2025 Premier Farnell Limited. All Rights Reserved.

Premier Farnell Ltd, registered in England and Wales (no 00876412), registered office: Farnell House, Forge Lane, Leeds LS12 2NE.

ICP 备案号 10220084.

Follow element14

  • X
  • Facebook
  • linkedin
  • YouTube