
Welcome to the Mathworks page on element14. Here you can find things such as our latest news, training videos, and product details. Additionally, you can engage with us in our forums.

What is an indoor climate monitoring system and why do we need one?
Indoor climate monitoring systems provide a quick glance at key climate related statistics such as temperature and relative humidity. Being able to see these stats and receive alerts on your phone when the room is too humid or dry can be very helpful. Using the alerts, you can take quick necessary actions to attain maximum comfort in the room by switching on the heater or opening the windows.
In this project, we will see how to use Simulink to:
You need MATLAB, Simulink and select Add-Ons to follow along and build your own indoor climate monitoring system.

Note - During installation, follow the on-screen instructions to set up your Pi to work with MATLAB and Simulink.
Click here to buy the software and the hardware needed for this project.

For those who are not familiar with Simulink, it is a graphical programming environment that is used to model and simulate dynamic systems. Once you have designed your algorithm in Simulink, you can automatically generate code and embed it onto a Raspberry Pi or other hardware.
Type the following on MATLAB Command Window to open the first example model. We will use this model to bring temperature, pressure and relative humidity data into the Raspberry Pi.
>> rpiSenseHatBringSensorData

The blocks LPS25H Pressure Sensor and HTS221HTS221 Humidity Sensor are from the Sense HAT library under Simulink Support Package for Raspberry Pi Hardware libraries.

The scope blocks are from the Sinks library under Simulink libraries. To ensure that your model is configured correctly, click on the gear icon in your Simulink model.

Note – You do not have to configure if you followed the setup instructions, while installing the Simulink Support Package for Raspberry Pi. The device address gets auto populated to that of your Pi.
Navigate to Hardware Implementation > Hardware board settings > Target hardware resources.

Ensure that the device address here matches the IP address that you hear when your Pi boots up. You might have to repower your Pi with an earphone connected to the jack to hear the device address.

Click on OK and press the Run button as shown below. Make sure your Pi is either physically connected to the PC via USB cable or is on the same Wi-Fi network as your PC.

When you press the Run button in External mode, Simulink automatically generates the C code equivalent to your model and downloads an executable to the Raspberry Pi. Both scope blocks are configured to open once the model starts to run. When Simulink is done deploying the code to the Raspberry Pi, you will see the pressure, temperature and relative humidity data on the scopes as shown below.

Note - The code is running on the Raspberry Pi and you are viewing the actual signals through the Simulink scope blocks, just like you would if you had an oscilloscope connected to the hardware itself.
The temperature value from the two sensors are slightly off from each other. Feel free to choose the one that reflects the actual temperature in your room more closely and use that in subsequent sections. In all the tests with the Sense HAT that we had, the HTS221HTS221 Humidity Sensor’s temperature values were closer to the actual temperature in the room. With that we have seen the basics of how to bring in sensor data from the Sense HAT into the Raspberry Pi.
In this section, we will see how the visual display portion of this project was added to the last model. The Sense HAT elements that are being used in this section are the humidity sensor (to get relative humidity and temperature), pressure sensor, LED matrix, and the joystick. The joystick is used to select which sensor we want to display.
To open the next example model, type the following in the MATLAB Command Window.
>> rpiSenseHatDisplay

The Joystick block is from the Sense HAT library. It helps us bring the joystick data in to the Raspberry Pi, just like the pressure and humidity sensor blocks did in the previous example. For now, we are using the Test Comfort block to display ‘good’ (when the block’s value is 1) on the LED matrix. It will display ‘bad’ when the block value is 2 or ‘ugly’ when the value is either 3 or 4. In the next section, we will see the actual algorithm that decides if the indoor humidity is good, bad or ugly. Let’s explore the Selector block by double clicking on it. MATLAB function blocks are used to integrate MATLAB code within your Simulink model. In this case we are bringing in SelectorFcn given below.
function [value, State] = SelectorFcn(JoyStickIn, pressure, ...
humidity, temp, ihval)
persistent JoyStickCount
if isempty(JoyStickCount)
JoyStickCount = 1;
end
if JoyStickIn == 1
JoyStickCount = JoyStickCount + 1;
if JoyStickCount == 6
JoyStickCount = 1;
end
end
switch JoyStickCount
case 1 % Display temperature in C
value = temp;
State = 1;
case 2 % Display pressure in atm
value = pressure/1013.25;
State = 2;
case 3 % Display relative humidity in %
value = humidity;
State = 3;
case 4 % Display temperature in F
value = temp*(9/5)+32;
State = 4;
case 5 % Display Good/Bad/Ugly
value = ihval;
State = 5;
otherwise % Don't display/Display 0
value = 0;
State = 6;
end
Switch-case statements are generally used as a selection control mechanism. In our case, we want the joystick input to be the selection control and select the next data to display every time the joystick button is pressed. For this, we set up an if loop which increments the JoyStickCount variable with each button press (JoyStickIn value is 1 if there is a button press). In the same loop, to ensure we are only cycling between the five options given above we added another condition that resets the variable value to 1.
Using this, we select which value will be displayed on the LED matrix. Case 1 will be the default as we define JoyStickCount to start at 1, and this means that the LED matrix will display temperature in Celsius. The State variable is used by the Scroll data block to understand which sensor value is currently being displayed and what unit should be displayed. Now that we know how to select the right sensor to display, let’s look at how the actual display works.
To display on the Sense HAT LED matrix, we created 8x8 matrices for:
These 8x8 matrices were used as input to the 8x8 RGB LED Matrix block. This block lights up the LEDs corresponding to those elements on the matrix that have a value of 1 as shown below.


The Scroll data block in our model scrolls through strings which can be up to 6 characters long. The value of 6 was chosen as that is the longest string that we will output in this project, example 23.8 °C or 99.1 °F. Note, here °C is considered one character. The same idea can be extended to scroll strings of other lengths as well. Here is a GIF that shows how it works –
To display a string of 6 characters each on the 8x8 matrix, we need an image of 8x48 size in total. To display a string that is maximum 4 characters long, we will need to create an 8x32 matrix.
Now let’s see the whole thing in action by pressing the Run button. The default display on the LED matrix is the temperature value in °C. The Scope block will show the State and value from the Selector block. Press the joystick button on the Sense HAT and hold for a second to verify that the value changes to the next sensor output and repeat this process until it reaches State value of 5. To observe the algorithm switching through all cases of the indoor humidity categorization, change the value of Test Comfort block to any number between 1 through 4. Notice how changing the value of a block on the Simulink model immediately changes the way the code behaves on the hardware. This can be useful in situations where one wants to change how the code behaves from a remote location.
With that we have seen the key elements behind the visualization aspect of climate monitoring system. In the next section we will learn how to complete our indoor climate monitoring system.
To understand if your room is too humid/dry or to know what indoor humidity level is considered comfortable, there are several methods. Using this article, we established an area curve to connect indoor relative humidity and outdoor temperatures as shown below:
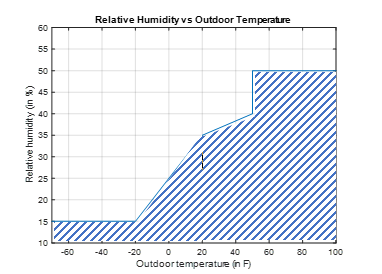
Any relative humidity value in this area, means your room is in a comfortable setting. For instance, if the outdoor temperature is -30 °F then any relative humidity value under 15% is acceptable. Likewise, if outdoor temperature is 60 °F then any relative humidity under 50% is acceptable.
To categorize indoor humidity into maximum comfort (good), average comfort (bad) or too humid/dry (ugly), you need outdoor temperature and relative humidity. We have seen how to bring in relative humidity into the Raspberry Pi. So, let’s focus on bringing in outdoor temperature. Type the following in MATLAB Command Window to open the model:
>> rpiOutdoorWeatherData

The WeatherData block is used to bring in external temperature of your city (in K) using https://openweathermap.org/. To configure this block, you need an API Key from the website. After creating your free account on this website, go to your account page. The API keys tab shown below gives you the key.

The WeatherData block needs the input of your city name in a specific format. Visit this page and input your city name then the comma symbol followed by 2 letters to denote country. Examples – Natick, US and Chennai, IN. If the search returns a result for your city, use that in the WeatherData block in that specific format. In case your city is unavailable, use a neighboring city whose weather conditions are closer to yours.
Now double click on the WeatherData block and input your city name and your API key from the website.

Press Run on this Simulink model to check that the block can bring in the temperature of your city into the Raspberry Pi. Now let’s see the algorithm that decides if the indoor humidity is good, bad or ugly. Type the following in MATLAB Command Window to open the next example:
>> rpisenseHatIHval

You might have noticed that the Test Comfort block from the previous model is missing and a new block called Find Room Comfort is providing the ihval to Selector block. Double click on this block to open and explore.

We are using the WeatherData block to bring in outdoor temperature. The Humidity Limits subsystem represents the Relative Humidity vs Outdoor Temperature chart that we saw above. Depending on the outdoor temperature it will output what the maximum humidity limit value should be. Let’s open the DecideIH MATLAB function block by double clicking on it.

If the relative humidity value exceeds the maximum humidity limit, then the sign will be positive based on the way we are subtracting the data, implying the room is too humid. We are outputting a 3 (ugly) for this scenario. The reason behind using numbers instead of strings is it is easy to display on graphs and create alerts from. The rest of the classifications in the MATLAB function are based on arbitrary criteria that we came up with. When the difference is less than 10 it is categorized maximum comfort and when it is less than 20 it is average comfort and above that is too dry. Feel free to run this model and check your room’s comfort level.
In this next section we will see how to log data on the cloud. To open this example, type the following in MATLAB Command Window.
>> rpiSenseHatLogData

In this model, the display portion of the previous example model is purposefully removed as we don’t need the monitoring system to be showing the stats while logging data and sending out alerts. We are using ThingSpeak, a free open-source IoT platform that includes MATLAB analytics, for the data logging aspect. We chose ThingSpeak since there are direct ways to program Raspberry Pi and other low-cost hardware boards to send data to ThingSpeak using Simulink.
The ThingSpeak Write block is from the Simulink Support Package for Raspberry Pi Hardware library, and can be configured using the Write API Key from your ThingSpeak channel* as shown below -


* Note – detailed instructions on how to create the channel are provided in the following section.
To continually log data onto the cloud, you want your Pi to work independent of Simulink. For this, you can press the “Deploy to Hardware” button in your Simulink model as shown below.

Here is a screenshot of the ThingSpeak channel logging data on the cloud for a 45-minute period:

Those who do not have an account can sign up on ThingSpeak website. If you have a MathWorks account, then you automatically have a ThingSpeak account.


Once you have logged in, you can create a channel by going to Channels > My Channels and clicking on New Channel.

All you need is a name for the channel and names for the fields that you are going to log as shown below.

The Show Channel Location option needs the latitude and longitude of your city as input and can show the location inside the channel on a map. (Example values used here are for Natick, MA)

Then press Save Channel to finish creating your channel.
To complete our indoor climate monitoring system, we must see how to receive alerts based on cloud data. This is critical because, without it you will not be able to take necessary actions to change the comfort level in the room. In this section, we will see how to receive a notification on your phone whenever the cloud data indicates that the room is too humid or dry. We will achieve this by using two services: IFTTT Webhooks and ThingSpeak TimeControl. IFTTT (stands for If this, then that) is an online service that can handle events and trigger actions based on the events.
Note: Try these on a computer for best results.


The important pieces here in the template code are –


Now MATLAB Analysis runs automatically every half hour and sends a trigger to IFTTT Webhooks service if the value is greater than or equal to 3. Then the IFTTT phone app will alert the user with a notification as shown below.

With that we have seen all the important aspects of how to build your own climate monitoring system. In this project, we saw how Simulink can be used to –
What are some of the changes that you would do to this indoor climate monitoring system? Please share your suggestions via comments.
Have you worked with Simulink before? Do you already have a great project or an idea for a great project?
Then Simulink student challenge is for you. It gives you the opportunity to win up to 1000 USD and all you have to do is create a short YouTube video and enter the challenge. For more details visit this page before the deadline for submissions Dec 7th.
https://www.mathworks.com/academia/student-challenge/simulink-student-challenge-2018.html
For inspiration, here are all the entries from 2017 challenge - https://www.youtube.com/playlist?list=PLn8PRpmsu08oSdJ2sk0WIUO5NX7W9xCV3
Madhu
As some of you here might already know, element14/newark was one of the first to bundle up MATLAB and Simulink Student Suite with different hardware under the Learn to Program pack name. This was a great way for non-programmers to learn how to program some of our favorite hardware boards such as Arduino, Raspberry Pi, etc.
The latest version of Student Suite (R2018b), which is what you will get if you buy now from e14, has Parallel Computing Toolbox and Curve Fitting Toolbox instead of Data Acquisition Toolbox and Simulink Control Design. I thought this was particularly good because a) Machine Learning is one of the hottest topics right now and students and engineers can take full control of any GPUs or cores that they might have on their PCs with the Parallel Computing Toolbox and b) Machine Learning projects with hardware are cool.
This webpage has a ton of resources for those who want to learn more about Machine learning - https://www.mathworks.com/solutions/machine-learning.html and those for who want to learn Introductory Deep learning concepts in a self-paced environment please visit this link and select Deep Learning Onramp - https://matlabacademy.mathworks.com/?s_tid=srchtitle
Have fun 
Are you a student? Here is how you can win up to 1000 USD -
1) Show off your cool projects in which you used Simulink by creating a video which explains how you used Simulink.
2) Visit this page and use the appropriate hashtag while uploading your video to YouTube and complete the entry form on it.
And as always please share your projects with e14 community and earn the respect of your peers here as well.
For more details and the challenge rules please visit the challenge homepage.


