Use a USB air-quality sensor dongle to quickly mount an indoor air monitoring system and prevent headaches and further impact on health.
Things used in this project
1.OhmTech.io uThing::VOC
VOCs
Volatile organic compounds (VOCs) are emitted as gases from certain solids or liquids. VOCs include a variety of chemicals, some of which may have short- and long-term adverse health effects. Concentrations of many VOCs are consistently higher indoors (up to ten times higher) than outdoors. VOCs are emitted by a wide array of products numbering in the thousands.
Organic chemicals are widely used as ingredients in household products. Paints, varnishes and wax all contain organic solvents, as do many cleaning, disinfecting, cosmetic, degreasing and hobby products.
Since many people spend much of their time indoors, long-term exposure to VOCs in the indoor environment can contribute to serious health issues.
Good ventilation and air-conditioning systems are helpful at reducing VOCs in the indoor environment.
In this project, we will learn how to measure VOC levels using a USB sensor dongle connected to a Raspberry Pi, store the data into an InfluxDB time-series database and use the Grafana application to quickly build an air-quality monitoring dashboard.
Measuring VOCs indoor levels
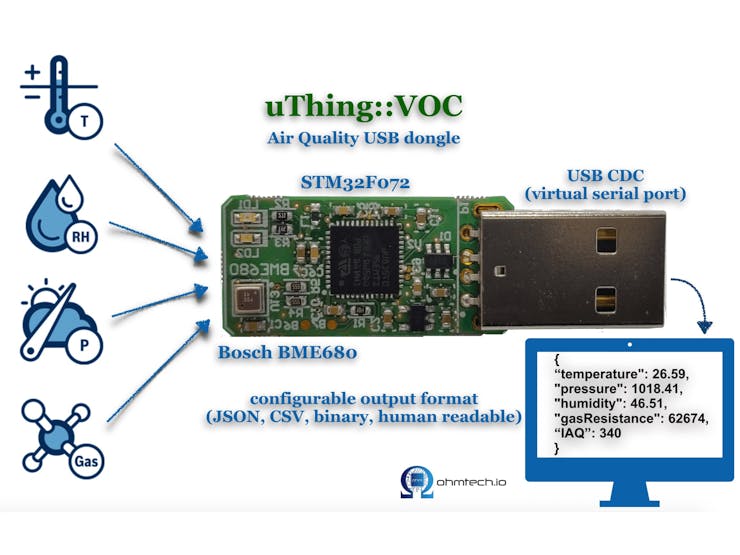
OhmTech's uThing::VOC USB air-quality sensor dongle provides a quick way of obtaining data from the Bosch Sensortec BME680 sensor module.
The STM32 MCU integrated in the USB dongle captures raw data from the sensor and uses the Bosch's proprietary Air Quality calculation algorithms to obtain equivalent air-quality (IAQ Index), temperature, relative humidity and atmospheric pressure values. These values are then output over a simple Virtual Serial Comm on the USB connector in different configurable formats (JSON, CSV, Human readable or binary).
The uThing::VOC can be configured for different output data rates and formats. By default the sensor data is output every 3 seconds in JSON format. We will use the default settings for this project, but they can be changed easily, check the datasheet for more information.
Python script
The python3 script can be found in the code section below.
In this case we send the sensor data to an InfluxDB database, but the script can be used as a base example to send the data over MQTT instead, or use the IFTTT service to get notifications on your phone when the air-quality reaches unhealthy levels.
The script is very simple: it connects to the uThing::VOC over the Virtual Serial Port ('/dev/ttyACM0' by default in the RaspberryPi), listen for an incoming message, parse the text to find the different measurement results, store it into a JSON message and finally uses the InfluxDB client library to store the new measurements.
If you use a different platform, make sure to change according the VCP device name. More information on this can be found in the device datasheet.
In this example we are running the InfluxDB app on the RaspberryPi itself, but the host name can be changed in line 14 in case the DB runs in a different machine.
Script auto-run
In order to make the python script auto-load when the RaspberryPi restart, we can create a simple service to run the python script:
1) Create a "airquality.service" file with the following content:
[Unit] Description=airQualityDaemon After=network.target [Service] ExecStart=/usr/bin/python3 -u serialtoinflux.py WorkingDirectory=/home/pi/air-quality StandardOutput=inherit StandardError=inherit Restart=always User=pi [Install] WantedBy=multi-user.target 2) Copy this file into /etc/systemd/system as root:
sudo cp airquality.service /etc/systemd/system/airquality.service Once this has been copied, you can attempt to start the service using:
sudo systemctl start airquality.service 3) When you are happy that this starts the app, you can have it start automatically on reboot by using this command:
sudo systemctl enable airquality.service
https://www.hackster.io/damancuso/indoor-air-quality-monitor-b181e9#toc-influxdb-installation-4InfluxDB installation
1) Add the repository:
curl -sL https://repos.influxdata.com/influxdb.key | sudo apt-key add - source /etc/os-release test $VERSION_ID = "7" && echo "deb https://repos.influxdata.com/debian wheezystable" | sudo tee /etc/apt/sources.list.d/influxdb.list test $VERSION_ID = "8" && echo "deb https://repos.influxdata.com/debian jessiestable" | sudo tee /etc/apt/sources.list.d/influxdb.list test $VERSION_ID = "9" && echo "deb https://repos.influxdata.com/debian stretch stable" | sudo tee /etc/apt/sources.list.d/influxdb.list sudo apt-get update 2) Install dependencies and InfluxDB:
sudo apt-get install libfontconfig1 sudo apt-get -f install sudo apt-get install influxdb 3) Start the service:
sudo service influxdb start 4) Create Admin user and "airquality" database
We will create a database named "airquality". Start InfluxDB running "influx" and run the following commands:
> CREATE USER "user" WITH PASSWORD 'password' WITH ALL PRIVILEGES > create database airquality > use airquality > show measurements Grafana installation
1) Download and install latest ARMv7 version:
cd ~ && wget https://s3-us-west-2.amazonaws.com/grafana-releases/release/grafana_5.2.1_armhf.deb sudo apt-get install -y adduser libfontconfig sudo dpkg -i grafana_5.2.1_armhf.deb 2) Enable service (so it autostarts):
sudo systemctl enable grafana-server 3) Start service:
sudo systemctl start grafana-server 4) Open the web interface (http://rasbperrypi.local:3000)
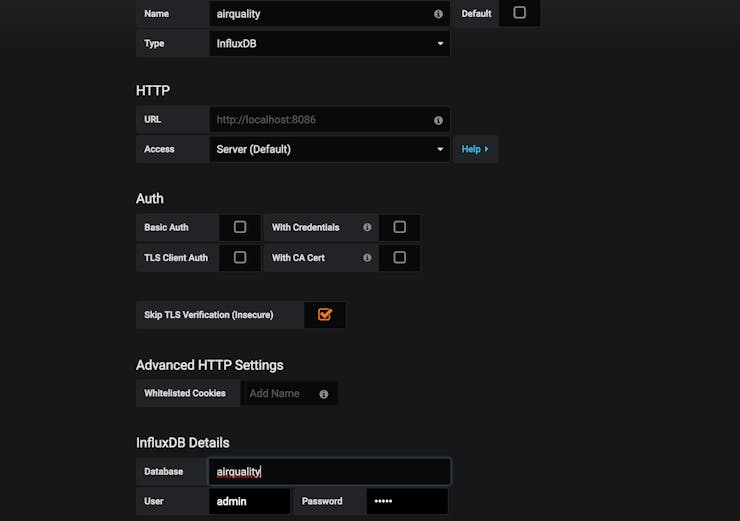
5) Configure a data source (local InfluxDB database airquality) with the following parameters:
- Name: airqualityMonitor
- Type: InfluxDB
- URL: http://localhost:8086
- Skip TLS verification
- Database: airquality
- User identification: not needed since it’s disabled on theInflux configuration.
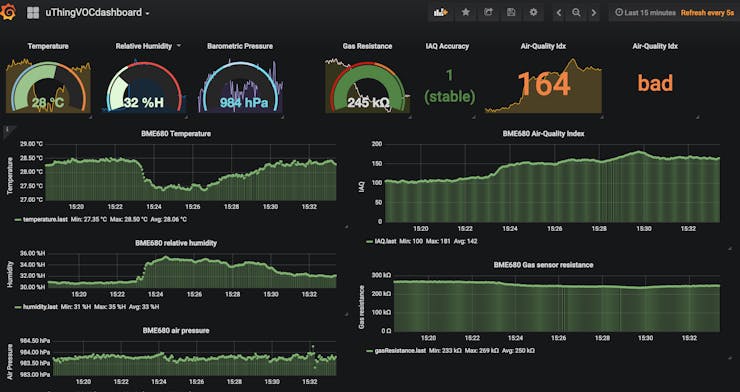
6) Import the demo dashboard:“Upload json file” (’airqualitymonitoringDashboard.json’)
If everything goes well, the Dashboard should look like this:
Further steps
Apart from the real-time and historical data visualisation, it could be useful to set up notifications when the air-quality enters into unhealthy ranges.
For a basic prototyping / proof-of-concept, Grafana provides some configurable rules over the connected data to create exception notification rules. These alerts can be sent over a few supported channels as e-mail, Slack, Pushover (push notifications for Android and iOS) and a few more.
Reference Links:
https://www.hackster.io/damancuso/indoor-air-quality-monitor-b181e9


