


The Remote Home Monitor will encourage you to upgrade your home to a smarter and more secure one, offering safety measures, protection, monitoring and key indicators for later improvement using the Nova Cellular USB Modem and a Raspberry Pi.
This project is not about just turning ON/OFF a light from a smart phone. It is focused on integrating a network of sensors, nicely presenting the data in a dashboard, monitoring and controlling all the features with a simple and friendly user interface, accessible from a web browser or a touch screen console at home.
This project was originally posted at Hackster.io where I was sponsored with a free kit to participate in a contest.
-
- 1. How it works
- 2. BOM
- 3. Instructions
- 4. Other ideas to improve the Remote Home Monitor
- 5. Source Code and Custom Parts
1. How it works
An array of sensors are connected to the Raspberry Pi, data is collected and stored in the cloud using the NOVA, the most recent data is re-routed to a Webhook that will help presenting the data nicely on a web page. Also, the system is capable of sending email alerts on critical events, like basement flooding risk.
| {gallery:width=620,height=425,autoplay=false} Remote Home Monitoring |
|---|
|
Remote Home Monitor: Hologram NOVA |
|
Remote Home Monitor: Assembled components |
|
Remote Home Monitor: Main components |
|
Non-contact current sensor: Known also as split core current transformer |
|
Remote Home Monitor: Components description |
|
Remote Home Monitor: Other components |
|
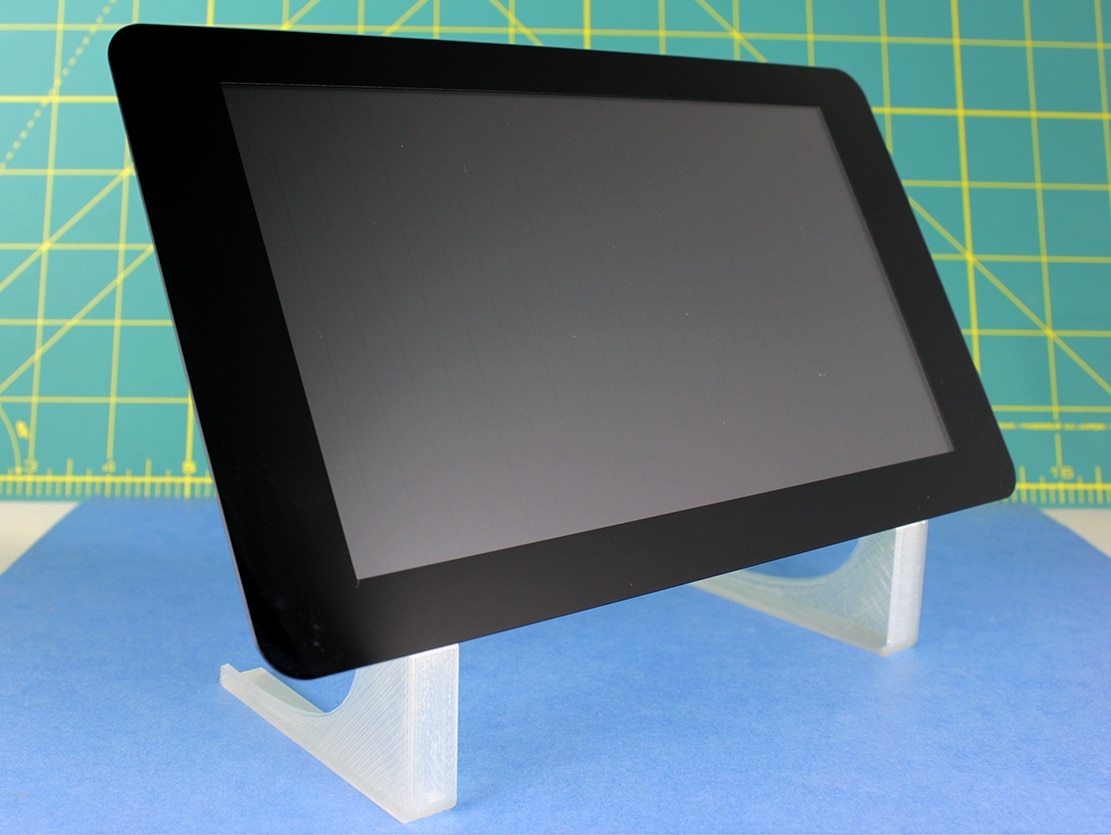
Stand for Touch Screen: 3d-printed stand for Raspberry Pi Touchscreen |


1.1. Advantages
- Low initial cost: each component or sensor can be made or bought for a low cost, avoiding the need of expensive "smart appliances".
- Flexibility: nodes and sensors compatible with Arduino will work, and can be tuned to your needs. You are not limited only to the features I have provided. Also the web app can be easily expanded with more Widgets.
- Reliability: with the Nova Cellular USB Modem and the Raspberry Pi paired together with a rechargeable battery implementation, an impressive up-time and an extra redundancy layer can be added making this a reliable and independent monitoring system when Internet is not working, during power outages and so on.
- Low maintenance cost: data sent is lightweight and the frequency at which is triggered can be adjusted, which makes this inexpensive to maintain.
1.2. Features Included
The current implementation is very simple and tries to explain how easy it is to build a remote monitoring system like this.
The features included in this project:
- Tracks the power consumption of your most important appliances like HVAC, Oven, etc. Implemented with a non-invasive current sensor attached to a power cord.
- Monitors the stove status: using the same current sensor, have peace of mind knowing you didn't leave the stove ON.
- Sump water level meter: water level is measured with an ultrasonic distance sensor (HC-SR05), measuring the distance between transceiver and the fluid. I used the same concept in my Smart Watering System project.
- Sends an email alert when the Sump Water Level is critical.
- Sensor's data can be monitored using a web browser -compatible with most web browsers-.
- See all the sensor's data in a Touch DisplayTouch Display at home using Chromium web browser on the Raspberry Pi 3Raspberry Pi 3.
- The web browser doesn't need to be refreshed to see the latest data in the Dashboard (this is acomplished using jQuery, Javascript and CSS)
1.3. Dashboard
Three simple widgets were designed for the dashboard which visually change depending on their status and were easily adapted using jQuery, JavaScript and CSS.

1.3.1. Stove Widget
Displays the apparent power consumption and the status of the Stove. When it is detected to be ON, the stove will be visualized a "little hot" with a status in red.
| Stove OFF | Stove ON |
|---|---|
|
Stove OFF - Widget |
Stove ON - Widget |


Data for this widget is simulated with the CT sensor connected to a power cord connected to an appliance. Due to local regulations, I can't tap the stove or electric main panel.
1.3.2. Sump
Water level changes color according to its level. Also displays the status of the sump pump.
| Sump - Low level | Sump - Medium level |
|---|---|
|
Sump widget - Low water level |
Sump widget - Medium water level |
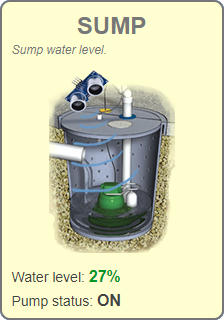
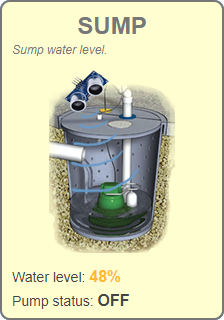
Pump status (ON/OFF) is simulated in the circuit with a push-button.
1.3.3. Temperature
Displays the room temperature in °F and °C. Temperature color changes gradually from blue to red (cool to warm), also the thermometer will adjust its thread level according to the temperature.
| Temperature | Temperature |
|---|---|
|
Temperature widget - Cool |
Temperature widget - Warm |

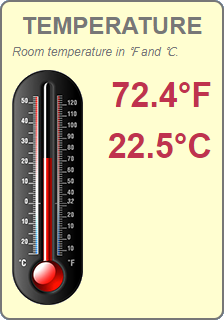
The temperature color change was accomplished changing the font-color with a function in JavaScript that does color mixing gradually.
2. BOM
- Raspberry Pi 3 Model BRaspberry Pi 3 Model B or any other RPi.
- Raspberry Pi Touch DisplayRaspberry Pi Touch Display
- Hologram Nova
- Hologram Global IoT SIM Card
- Texas Instruments LM35 Precision Centigrade Temperature SensorTexas Instruments LM35 Precision Centigrade Temperature Sensor
- Microchip MCP3008Microchip MCP3008 8-Channel 10-Bit ADC With SPI
- HC-SR05 Ultrasonic Sensor or HC-SR04HC-SR04
- SCT013 Non-invasive AC Current Sensor also known as a Split core current transformer
- Push-button switch
- Various resistors: 2k, 3.9k, 10k, 3.3k, 470k
- Ceramic capacitor 0.01µF
- Electrolitic capacitor 10µF
- Jumper wiresJumper wires
- BreadboardBreadboard
3. Instructions
Step 1: Configure your raspberry Pi
We'll assume that you already have a Raspberry Pi working and connected to the internet, so the first thing required is to update your software in Raspbian.
Open a terminal and run the following commands
sudo apt-get update
sudo apt-get upgrade
sudo apt-get dist-upgrade
Install the python Dev libraries
sudo apt-get install python-dev python-pip
Upgrade the GPIO and PIP libraries to the latest version
sudo pip install --upgrade RPi.GPIO
sudo pip install pip --upgrade
Install the Hologram SDK and make sure the NOVA works by following these instructions.
curl -L hologram.io/python-install | bash
Step 2: Build the hardware
Build the circuit as shown in the Fritzing diagram (attached in PDF too).

Important things to consider
- For demo purposes, a Raspberry Pi 3 Model BRaspberry Pi 3 Model B was used with a touch display (optional).
- the Red jumper wires in the diagram, represent the 5V connections.
- the Orange jumper wires in the diagram represent the 3.3V connections.
- There are two voltage dividers that will convert 5V outputs from the sensors to 3.3V.

- A 3.3k ohm resistor was used as a Burden Resistor in order to maximize the sensibility of the CT sensor.
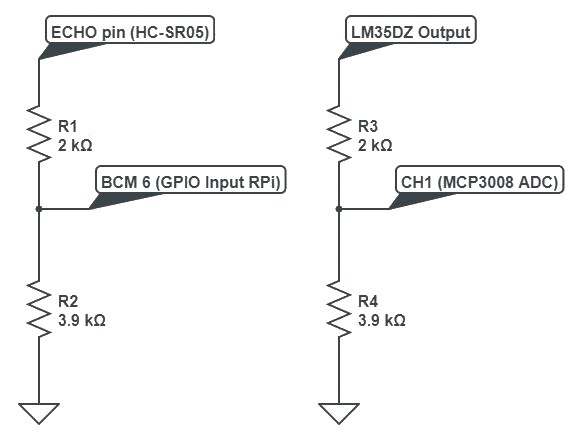
The Burden Resistor value must be adjusted in relation to the maximum AC current value expected.
Step 3: Programming the Raspberry Pi
Paste the Python script (attaced) to a file home_monitor.py on your Raspberry Pi and make it executable
$ chmod +x home_monitor.py
$ ls -l home_monitor.py
-rwxr-xr-x 1 pi pi 8908 Jan  5 21:29 home_monitor.py
Test the script with variable DEBUG = 1 , it should print all the readings of the sensors without sending the data
sudo ./home_monitor.py
If everything is correct, the sensors' data is displayed in the console output, including the Payload that will be sent to the Hologram Cloud in JSON format.

We are now ready to send the data to the Hologram Cloud, first on the python script, change the debug variable to DEBUG = 0 and save the changes, plug in the NOVA, wait for the blinking lights and run the program again.
This time, the only output from the console should be a "Message sent successfully".

Data should now be visible in the Hologram console in JSON format:

{
  "dtUTC":"2018-01-09T00:47:37.235216Z",
  "iRMS":0.01,
  "apparentPower":1.21,
  "stoveStatus":"OFF",
  "sumpLevel":69,
  "sumpPump":"OFF",
  "tempC":25.0,
  "tempF":77.0
}
Step 4: Create a Route for the Dashboard data
A home monitor is not complete without a dashboard, right?. In that order, we'll use the Hologram Data Router, to re-send the data collected by the Hologram Cloud to a webhook that will keep the most recent data and will present it nicely using PHP, HTML, CSS and jQuery.
Create a new route, select Custom Webhook URL (Your Own App), select the topic power-usage, assign a ROUTE NICKNAME and a WEBHOOK KEY of your choice. Type the Destination URL where you plan to put the webhook receiver PHP <script attached>.

The topics can be personalized in the phyton script home_monitor.py by changing the parameters of the sendMessage function that sends the main JSON values:
response_code = hologram.sendMessage(json, topics = ["power-usage"])
With some minor adjustments to the webhook receiver PHP script, the Advanced Webhook Builder may also be used to send the data to be published in the dashboard.
Step 5: Deploy the Dashboard files
This may not be an easy step for some as this requires a PHP web server, but source files are provided anyway with enough documentation and instructions.
Dashboard
The home monitor dashboard displays the status of the different sensors connected to the Remote Home Monitor in a nice and friendly way. It gets the information published in JSON format using jQuery.
The dashboard code requires the Dashboard external CSS file. PHP is not mandatory for the dashboard to work -the php code could be removed-.
The address of the script that delivers the Hologram Payload in JSON format should be adjusted in case it is placed in a different path
$.get( "./publish_payload_json.php?t=t", function( data ) {
Webhook Receiver
Receives the webhook data from the Hologram Router and stores the payload in a .txt file in its original format.
Copy the same WEBHOOK KEY assigned to the route in the Hologram router to the $hologram_wh_Key variable in the PHP script.

$hologram_wh_Key = "webhookkey1234567890"; // Hologram Webhook key
Publish payload in JSON
Decodes Hologram payload previously saved in a .txt file and publishes it in JSON format. JSON data is later used by the Dashboard to present the data with jQuery.
Step 6: Prevent Basement Flooding (send an e-mail)
We don't want to let our basement flood right?. What if the Hologram Cloud sends an email when the sump water level is critical?, lets say 90% or more?. We will use this time the Hologram Email Data Router:
Create a new route, select Email, select or type the topic email-sump-level, fill in the ROUTE NICKNAME, SUBJECT and EMAIL RECIPIENTS of your choice, then type the following in the EMAIL MESSAGE field:
Sump water level is at <<decdata.sumpLevel>>%, sump pump is <<decdata.sumpPump>>
Things should look similar to the image below

If everything is working correctly, when the sump water level is 90% or more, the python script should show a message with the topic name:
email-sump-level: Message sent successfully
and we should see a message in the Hologram Message Console with the same topic name: email-sump-level and the email route triggered:

{
  "dtUTC":"2018-01-09T01:12:16.419195Z",
  "sumpLevel":92,
  "sumpPump":"OFF"
}
and an email from the Hologram Cloud:

The email topic can be personalized in the phyton script home_monitor.py by changing the parameters of the sendMessage function that sends the jsonEmail data
response_code = hologram.sendMessage(jsonEmail, topics = ["email-sump-level"])
Step 7 (optional): Enjoy a Touch Display dashboard
To enjoy the Remote Home Monitor Dashboard on a nice Touch DisplayTouch Display, Chromium web browser is required, since it is one of the few capable of handling the adjustments in the CSS styles I've used.
Select the Add / Remove Software

Then type "Chromium" in the search, once found, select it and click the OK button to proceed with the installation.

Once the Chromium web browser is installed, Create a shortcut in the desktop pointing to the Home Monitor Dashboard by creating a new text file called home_monitor.desktop in the /home/pi/Desktop/ directory.
It should contain the following (assign the correct web address to your dashboard):
[Desktop Entry]
Name=HomeMonitor Dashboard
TryExec=/usr/bin/x-www-browser
Exec=x-www-browser http://luislab.com/path/dashboard.php
Icon=rpi
Terminal=false
Type=Application
Categories=Application;Network;
StartupNotify=true
Comment[en_US]=Remote Home Monitor with Hologram Nova
the shortcut should be visible in the desktop, and enjoy...
| {gallery:width=620,height=425} Dashboard in Chromium web browser |
|---|
|
Dashboard: Remote Home Monitor Dashboard in the Chromium web browser |
|
Dashboard full screen: Remote Home Monitor Dashboard - chromium web browser (full screen) |


4. Other ideas to improve the Remote Home Monitor
The Home Remote Monitoring could be expanded with many more features, here are some ideas:
- Monitoring status of doors: find when your doors are open/close (main door, garage, back door) and send notifications in case of a security breach.
- Home surveillance / Intruder alert: add cameras, motion detectors, vibration, noise and pressure sensors.
- Water flow sensor: detect a water leak -very useful when not at home-.
- Add more Sensors: smoke/fire, Carbon dioxide (CO2).
- Video door bell.
- Control relays/switches: to activate/deactivate blinds, fans, lights, home appliances, etc.
- Control valves: to activate/deactivate the main water supply or an irrigation system.
- Save/visualize important information -like he power consumption- this is very helpful analyze trends, to add automatic features and to save money.
- Send Important alerts: via email, text message and other methods.
5. Source Code and Custom Parts
The source code, schematics and all supporting material required to replicate this project are attached, also, a description of each file is provided below.
| {tabbedtable} Tab Label | Tab Content |
|---|---|
| Schematic |
Fritzing diagram in PDF format
remote_home_monitor_fritzing_diagram.pdf |
| Main python program |
Main program for the Raspberry Pi. Gathers all sensors data and will publish the data collected to the Hologram Data Engine in JSON format using the Hologram Nova.
raspberry_main_python_program.py |
| Webhook receiver |
PHP that receives the webhook data from the Hologram router and stores the payload in its original format (base64) in a in a .txt file.
webhook_receiver.php |
| Publish payload |
PHP that decodes Hologram payload previously saved in a .txt file and publishes it in JSON format. JSON data is later loaded by the Remote Home Monitor dashboard with JQuery.
publish_payload_in_json.php |
| Dashboard |
The home monitor dashboard displays the status of the different sensors connected to the Remote Home Monitor in a nice and friendly way using HTML/PHP.
remote_home_monitor_dashboard.php |
| Dashboard CSS |
Dashboard External Style Sheet (CSS)
dashboard_external_css.css |
| Raspberry Pi 7" touchscreen Stand | For my prototype, I used the Raspberry Pi 7" Touchscreen 60 degrees stand |
Top Comments